ACPD
15, 31287–31333, 2015Diurnal cycle and multi-decadal trend
of formaldehyde
B. Franco et al.
Title Page
Abstract Introduction
Conclusions References
Tables Figures
◭ ◮
◭ ◮
Back Close
Full Screen / Esc
Printer-friendly Version Interactive Discussion
Discussion
P
a
per
|
Discussion
P
a
per
|
Discussion
P
a
per
|
Discussion
P
a
per
|
Atmos. Chem. Phys. Discuss., 15, 31287–31333, 2015 www.atmos-chem-phys-discuss.net/15/31287/2015/ doi:10.5194/acpd-15-31287-2015
© Author(s) 2015. CC Attribution 3.0 License.
This discussion paper is/has been under review for the journal Atmospheric Chemistry and Physics (ACP). Please refer to the corresponding final paper in ACP if available.
Diurnal cycle and multi-decadal trend of
formaldehyde in the remote atmosphere
near 46
◦
N
B. Franco1, E. A. Marais2, B. Bovy1, W. Bader1, B. Lejeune1, G. Roland1, C. Servais1, and E. Mahieu1
1
Institute of Astrophysics and Geophysics of the University of Liège, Liège, Belgium
2
School of Engineering and Applied Sciences, Harvard University, Cambridge, MA, USA
Received: 28 September 2015 – Accepted: 30 October 2015 – Published: 9 November 2015
Correspondence to: B. Franco ([email protected])
ACPD
15, 31287–31333, 2015Diurnal cycle and multi-decadal trend
of formaldehyde
B. Franco et al.
Title Page
Abstract Introduction
Conclusions References
Tables Figures
◭ ◮
◭ ◮
Back Close
Full Screen / Esc
Printer-friendly Version Interactive Discussion
Discussion
P
a
per
|
Discussion
P
a
per
|
Discussion
P
a
per
|
Discussion
P
a
per
|
Abstract
Only very few long-term trends of formaldehyde (HCHO) exist. Furthermore, many un-certainties remain as to its diurnal cycle, representing a large short-term variability su-perimposed on seasonal and inter-annual variations that should be accounted for when comparing ground-based observations to e.g., model results. In this study, we derive
5
a multi-decadal time series (January 1988–June 2015) of HCHO total columns from ground-based high-resolution Fourier transform infrared (FTIR) solar spectra recorded at the high-altitude station of Jungfraujoch (Swiss Alps, 46.5◦N, 8.0◦E, 3580 m a.s.l.), allowing for the characterization of the mid-latitudinal atmosphere for background con-ditions. First we investigate the HCHO diurnal variation, peaking around noontime and
10
mainly driven by the intra-day insolation modulation and methane (CH4) oxidation. We also characterize quantitatively the diurnal cycles by adjusting a parametric model to the observations, which links the daytime to the HCHO columns according to the monthly intra-day regimes. It is then employed to scale all the individual FTIR measure-ments on a given daytime in order to remove the effect of the intra-day modulation for
15
improving the trend determination and the comparison with HCHO columns simulated by the state-of-the-art chemical transport model GEOS-Chem v9-02. Such a paramet-ric model will be useful to scale the Jungfraujoch HCHO columns on satellite overpass times in the framework of future calibration/validation efforts of space borne sensors. GEOS-Chem sensitivity tests suggest then that the seasonal and inter-annual HCHO
20
column variations above Jungfraujoch are predominantly led by the atmospheric CH4 oxidation, with a maximum contribution of 25 % from the anthropogenic non-methane volatile organic compound precursors during wintertime. Finally, trend analysis of the so-scaled 27 year FTIR time series reveals a long-term evolution of the HCHO columns in the remote troposphere to be related with the atmospheric CH4fluctuations and the
25
short-term OH variability:+2.9 % yr−1between 1988 and 1995,
ACPD
15, 31287–31333, 2015Diurnal cycle and multi-decadal trend
of formaldehyde
B. Franco et al.
Title Page
Abstract Introduction
Conclusions References
Tables Figures
◭ ◮
◭ ◮
Back Close
Full Screen / Esc
Printer-friendly Version Interactive Discussion
Discussion
P
a
per
|
Discussion
P
a
per
|
Discussion
P
a
per
|
Discussion
P
a
per
|
1 Introduction
Formaldehyde (HCHO) is the most abundant aldehyde and one of the highest reactive species in the Earth’s atmosphere, with a midday lifetime on the order of a few hours (Logan et al., 1981; Possanzini et al., 2002). Being a product of the oxidation of most of the volatile organic compounds (VOCs), HCHO plays a primary role in tropospheric
5
chemistry and in the control of air quality. Besides dry and wet deposition of generally lesser importance (Atkinson, 2000), HCHO is predominantly removed from the atmo-sphere via catalytic pathways that are photochemically driven (Luecken et al., 2012). Indeed, large losses occur when HCHO reacts with the hydroxyl radicals (OH) available in the atmosphere to yield water vapor (H2O) and the HCO radical. By consuming OH,
10
the main sink of methane (CH4) in the troposphere, the HCHO abundance contributes to increasing the lifetime of this major greenhouse gas. HCHO also decomposes by photolysis either in H2 (molecular hydrogen) and CO (carbon monoxide) or in H (hy-drogen) and HCO. Since HCO reacts with oxygen, all these catalytic pathways release CO and hydrogen oxides (HOx), making HCHO a key component in the production of
15
CO by oxidation of hydrocarbons (Cantrell et al., 1990; Anderson et al., 1996; Calvert et al., 2000; Fried et al., 2002). As HOxradicals are major oxidizers in the atmosphere,
HCHO also constitutes a useful tracer of the atmospheric oxidative capacity (Staff el-bach et al., 1991). Moreover, in the presence of sufficient amounts of nitrogen oxides (NOx), for instance in polluted air masses over urban areas (Hak et al., 2005), the 20
HOx produced by the HCHO removal processes converts nitric oxide to nitrogen diox-ide, which results in a net production of tropospheric ozone by photolysis (O3; Cantrell et al., 1990; Houweling et al., 1998; Hak et al., 2005; Kanakidou et al., 2005).
On the global scale, CH4oxidation by OH constitutes the main source throughout the background troposphere, accounting for more than half of the overall production, while
25
produc-ACPD
15, 31287–31333, 2015Diurnal cycle and multi-decadal trend
of formaldehyde
B. Franco et al.
Title Page
Abstract Introduction
Conclusions References
Tables Figures
◭ ◮
◭ ◮
Back Close
Full Screen / Esc
Printer-friendly Version Interactive Discussion
Discussion
P
a
per
|
Discussion
P
a
per
|
Discussion
P
a
per
|
Discussion
P
a
per
|
tion, especially in the continental boundary layer (Millet et al., 2008; Pfister et al., 2008; Dufour et al., 2009a, b; Stavrakou et al., 2009a, b). Among the NMVOCs emitted over continents, biogenic compounds are dominant during the growing season of vegeta-tion, providing∼85 % of the total emissions with the largest contribution coming from isoprene (e.g., Palmer et al., 2003, 2006; Millet et al., 2008). Global HCHO production
5
from anthropogenic NMVOCs is relatively reduced, but is significantly enhanced over largely populated and industrialized areas. NMVOCs from pyrogenic sources (mainly biomass burning) generally provide small HCHO contributions on the global scale, al-though fire events can enhance HCHO emissions in specific areas (see e.g., Vigouroux et al., 2009). In addition, only a negligible fraction of HCHO (<1 %) results from direct
10
emissions to the atmosphere by various sources such as biomass burning, vegetation or incomplete fossil fuel combustion (e.g., Carlier et al., 1986; Lee et al., 1997; Hak et al., 2005; Herndon et al., 2005; Fu et al., 2007; De Smedt et al., 2010).
Formaldehyde has already been intensely observed, using measurements obtained from in situ instruments (e.g., de Serves, 1994; DiGangi et al., 2011, 2012), aircraft
15
campaigns (e.g., Fried et al., 2002, 2008, 2011; Frost et al., 2002; Wert et al., 2003) and various satellite sensors (e.g., Chance et al., 2000; Wittrock et al., 2006; Dufour et al., 2009a, b; Stavrakou et al., 2009a, b, 2015; De Smedt et al., 2010, 2015; Marais et al., 2012, 2014), as well as ground-based remote measurements derived from UV-Visible passive Multi-AXis Differential Optical Absorption Spectroscopy (MAX-DOAS)
20
instruments (e.g., Heckel et al., 2005; Pikelnaya et al., 2007; Inomata et al., 2008; Irie et al., 2011; Wagner et al., 2011; Pinardi et al., 2013; Franco et al., 2015b) and from high-resolution infrared solar spectra recorded with Fourier Transform InfraRed (FTIR) spectrometers (e.g., Mahieu et al., 1997; Notholt et al., 1997; Jones et al., 2009; Vigouroux et al., 2009; Paton-Walsh et al., 2010; Viatte et al., 2014; Franco
25
ACPD
15, 31287–31333, 2015Diurnal cycle and multi-decadal trend
of formaldehyde
B. Franco et al.
Title Page
Abstract Introduction
Conclusions References
Tables Figures
◭ ◮
◭ ◮
Back Close
Full Screen / Esc
Printer-friendly Version Interactive Discussion
Discussion
P
a
per
|
Discussion
P
a
per
|
Discussion
P
a
per
|
Discussion
P
a
per
|
GOME, GOME-2 (Global Ozone Monitoring Experiment) and OMI (Ozone Monitoring Instrument), provide some sensitivity in the free troposphere and have been used re-cently to produce regional decadal trends of HCHO columns at the global scale (De Smedt et al., 2010, 2015). Nonetheless, most space borne observational campaigns are time-limited, added to the fact that such measurements can be considerably
af-5
fected by instrumental ageing as well as by noise and error sources in the lowermost atmospheric layers, where lies the bulk of HCHO.
Although the seasonal intra-day variation of HCHO has been studied in field cam-paigns in different environments (Junkermann, 2009; Choi et al., 2010; MacDonald et al., 2012) or using ground-based MAX-DOAS and space borne UV-Vis
measure-10
ments at various locations (De Smedt et al., 2015; Stavrakou et al., 2015), consistent diurnal observations of HCHO columns remain sparse and time-limited. Hence the un-certainties on the intra-day cycle remain high, added to the fact that the diurnal pattern of HCHO may vary considerably from site to site according to many local factors, such as the emissions of NMVOC precursors, the chemical regime and the influence of the
15
planetary boundary layer. More particularly, the HCHO diurnal cycle may be responsi-ble for significant short-term variability that needs to be accounted for when comparing results derived from space borne instruments, according to their respective overpass times. Furthermore, the HCHO intra-day modulation remains incompletely captured by the chemistry transport models (CTMs), especially for remote conditions (Stavrakou
20
et al., 2015). Therefore, the characterization of the HCHO diurnal cycle using high-quality ground-based observations is definitely required for validation/calibration efforts of satellite sensors and models.
Ground-based instruments, such as the high-resolution FTIR spectrometers dis-tributed worldwide at strategic locations and part of the Network for the Detection of
At-25
ACPD
15, 31287–31333, 2015Diurnal cycle and multi-decadal trend
of formaldehyde
B. Franco et al.
Title Page
Abstract Introduction
Conclusions References
Tables Figures
◭ ◮
◭ ◮
Back Close
Full Screen / Esc
Printer-friendly Version Interactive Discussion
Discussion
P
a
per
|
Discussion
P
a
per
|
Discussion
P
a
per
|
Discussion
P
a
per
|
8.0◦E, 3580 m a.s.l.). The results have been successfully validated against MAX-DOAS
measurements and simulation of two CTMs, GEOS-Chem (Goddard Earth Observing System – chemical transport model; Bey et al., 2001) and IMAGES v2 (Intermediate Model of Annual and Global Evolution of Species; Stavrakou et al., 2013), over the 2010–2012 time period (Franco et al., 2015b). The Jungfraujoch FTIR observational
5
database covers now more than 30 years (back to 1988 in the case of HCHO obser-vations) and is unique worldwide in terms of the quality and density of the measure-ments as well as of their temporal coverage. Time series of high-quality geophysical data derived from this database are particularly appropriate for multi-decadal studies of many important constituents of the Earth’s atmosphere, including HCHO and its VOC
10
precursors. Used as comparative and complementary data, they are also of crucial im-portance for the calibration and validation of models as well as of current and future satellite sensors.
In the present study, we use the observational database of ground-based solar spec-tra recorded by two high-resolution FTIR spectrometers operated at the
Jungfrau-15
joch station, in order to produce a 27 year time series of HCHO total column (from 1988 to mid-2015). To our best knowledge, it represents the longest time series of re-mote HCHO measurements. We first investigate the intra-day variation of HCHO total columns in the remote troposphere, using a consistent subset of observations span-ning more than twenty years. As this 20 year subset provides robust statistics without
20
inducing errors and/or biases resulting from the use of different sources of measure-ments, we also characterize the HCHO diurnal cycle on a monthly basis by adjusting a fitting parametric model to the observed intra-day variations. These parameters being determined according to the observations, we employ this model to scale all individual HCHO measurements of the entire Jungfraujoch database at a given moment of the
25
ACPD
15, 31287–31333, 2015Diurnal cycle and multi-decadal trend
of formaldehyde
B. Franco et al.
Title Page
Abstract Introduction
Conclusions References
Tables Figures
◭ ◮
◭ ◮
Back Close
Full Screen / Esc
Printer-friendly Version Interactive Discussion
Discussion
P
a
per
|
Discussion
P
a
per
|
Discussion
P
a
per
|
Discussion
P
a
per
|
In the second part of this study, we employ simulations made with the state-of-the-art 3-D CTM GEOS-Chem to investigate the main sources and drivers of HCHO above Jungfraujoch. First we compare the ground-based FTIR observations with HCHO total columns simulated by the CTM, taking into account the vertical resolution and spe-cific sensitivity of the FTIR retrievals. Then sensitivity runs are performed with the aim
5
of evaluating the contribution of different precursor species or source category (from anthropogenic, biogenic and biomass burning sources) to the HCHO loadings and sea-sonality.
Finally, we analyze the multi-decadal FTIR time series of the Jungfraujoch station (1988–2015) in order to study the inter-annual variability and deduce trends of HCHO
10
columns in the remote troposphere of the mid-latitudinal Northern Hemisphere. This paper is organized as follows: we briefly introduce in Sect. 2 the FTIR instrumen-tal setups and data sets, as well as the GEOS-Chem model. In Sect. 3, we investigate the HCHO diurnal variation, describe the fitting parametric model and how it is adjusted to the observations. We report in Sect. 4 the results of the comparison between FTIR
15
measurements and GEOS-Chem simulations, as well as of the sensitivity runs. Sec-tion 5 is devoted to the analysis of the 1988–2015 time series of HCHO total columns above the Jungfraujoch station, involving trends determination. Section 6 concludes this study with discussions of the results and identifies avenues for future work.
2 Data sets 20
2.1 FTIR instrumentation and measurements
The long-term HCHO time series presented and investigated in this study has been produced from the analysis of solar spectra recorded between January 1988 and June 2015 under clear-sky conditions at the high-altitude International Scientific Station of the Jungfraujoch (hereafter ISSJ; Swiss Alps, 46.5◦N, 8.0◦E, 3580 m a.s.l.). These
25
ACPD
15, 31287–31333, 2015Diurnal cycle and multi-decadal trend
of formaldehyde
B. Franco et al.
Title Page
Abstract Introduction
Conclusions References
Tables Figures
◭ ◮
◭ ◮
Back Close
Full Screen / Esc
Printer-friendly Version Interactive Discussion
Discussion
P
a
per
|
Discussion
P
a
per
|
Discussion
P
a
per
|
Discussion
P
a
per
|
A “home-made” instrument was primarily in operation until the mid-1990s and then progressively replaced by a more sensitive commercial Bruker-120 HR instrument. A thorough description of the instrumentation is given by Zander et al. (2008). The consistency among the HCHO columns retrieved from the two subsets is evaluated in Sect. 5.1 using all available coincident measurement days of 1995–1997.
5
The ISSJ is mainly located in the free troposphere during winter and represents a unique site to study the atmospheric background conditions over central Europe. During the rest of the year, injections of air masses from the planetary boundary layer can occur, bringing biogenic and anthropogenic pollutants from the nearby valleys. Furthermore, the very high dryness due to the altitude, combined to the presence of
10
the Aletsch Glacier (adding to the local dryness) in the immediate vicinity of the station, limits significantly the interference by water vapor in the infrared solar measurements. More details regarding the measurement site can be found in Zander et al. (2008) and Franco et al. (2015b), as well as in references therein.
The overall database investigated here consists of 10 979 solar spectra, of which
15
1436 were recorded by the ”home-made” spectrometer over the 1988–1997 period and 9542 were obtained with the Bruker instrument between 1995 and June 2015 (re-ferred to below as the LIEGE and BRUKER data sets, respectively), both equipped with indium antimonide (InSb) cooled detectors. The spectra were recorded using opti-cal filters maximizing the signal-to-noise (S/N) ratio over the 2400–3310 cm−1spectral
20
domain, thus encompassing the ν1 infrared band of HCHO centered at 2783 cm−
1 . The typical spectral resolution (defined here as twice the maximum optical path diff er-ence) alternates between 0.003 and 0.005 cm−1for both instruments, with the highest resolution adopted for minimum variation of the airmass and observing geometry, pre-dominantly around midday. S/N ratios vary between 550 to more than 3100 (average
25
spectra resulting from several successive individual scans).
tro-ACPD
15, 31287–31333, 2015Diurnal cycle and multi-decadal trend
of formaldehyde
B. Franco et al.
Title Page
Abstract Introduction
Conclusions References
Tables Figures
◭ ◮
◭ ◮
Back Close
Full Screen / Esc
Printer-friendly Version Interactive Discussion
Discussion
P
a
per
|
Discussion
P
a
per
|
Discussion
P
a
per
|
Discussion
P
a
per
|
posphere (up to 12 km altitude). The mean Degree Of Freedom for Signal (DOFS) over the entire data set is∼1, hence only total columns of HCHO may be obtained. In addi-tion, the individual observations characterized by a DOFS value lower than 0.35 have been discarded. Franco et al. (2015b) also provides a complete error budget of the
HCHO measurements, quoting the total systematic and random components at ±14
5
and±21 %, respectively.
2.2 GEOS-Chem simulations and processing
GEOS-Chem is a global 3-D chemical transport model capable of simulating global trace gas (more than 100 tracers) and aerosol distributions. In the present study, GEOS-Chem is driven by the Goddard Earth Observing System v5 (GEOS-5)
as-10
similated meteorological fields from the NASA Global Modeling Assimilation Office (GMAO). The GEOS-5 data are available at a native horizontal resolution of 0.5◦× 0.667◦ and at a 6 h temporal frequency (3 h for surface variables and mixing depths). These meteorological fields provide a description of the atmosphere on the basis of 72 hybrid pressure-σ levels from the surface up to 0.01 hPa. For the simulations used
15
here, the GEOS-5 meteorological fields are degraded to a 2◦×2.5◦horizontal resolution and 47 vertical levels, lumping together levels above∼80 hPa. We apply the standard full chemistry GEOS-Chem simulation that includes detailed O3–NOx–VOCs–aerosol coupled chemistry described by Bey et al. (2001) and Park et al. (2004), with updates by Mao et al. (2010).
20
Conversely to Franco et al. (2015b) who used GEOS-Chem version 9-01-03, we employ here the model version 9-02 (http://acmg.seas.harvard.edu/geos/doc/archive/ man.v9-02/index.html) that implements a new isoprene oxidation scheme as standard. This chemistry is largely based on the work of Paulot et al. (2009a, b) and has been proved to yield more HCHO from the isoprene oxidation pathways for weakly-polluted
25
ACPD
15, 31287–31333, 2015Diurnal cycle and multi-decadal trend
of formaldehyde
B. Franco et al.
Title Page
Abstract Introduction
Conclusions References
Tables Figures
◭ ◮
◭ ◮
Back Close
Full Screen / Esc
Printer-friendly Version Interactive Discussion
Discussion
P
a
per
|
Discussion
P
a
per
|
Discussion
P
a
per
|
Discussion
P
a
per
|
isoprene oxidation scheme applied in GEOS-Chem v9-01-03 is described in Mao et al. (2013).
In GEOS-Chem, the global biomass burning emissions are derived from the Global Fire Emissions Database (GFED) v3 (van der Werf et al., 2010) and the global bio-genic emissions are obtained with the Model of Emissions of Gases and Aerosols
5
from Nature (MEGAN) v2.0 (Guenther et al., 2006) in GEOS-Chem v9-01-03 and v2.1 (Guenther et al., 2012) in version 9-02. Over Europe, the anthropogenic
emis-sions of CO, NOx, SOx (sulfur oxides), ammonia and NMVOCs are provided by
the European Monitoring and Evaluation Programme (EMEP; http://www.ceip.at/) re-gional inventory for the year 2010 (Simpson et al., 2010), except for ethane and
10
propane that are derived from an offline simulation (Xiao et al., 2008), and acetone that is from the REanalysis of the TROpospheric chemical composition (RETRO; http://gcmd.gsfc.nasa.gov/records/GCMD_GEIA_RETRO.html) global emission tory (Van het Bolscher et al., 2008) for base year 2000. The global and regional inven-tories are scaled to the years of interest using energy statistics (van Donkelaar et al.,
15
2008). Annual average CH4concentrations are prescribed over four latitude bands (0– 30; 30–90◦) on the basis of CH
4 measurements from the NOAA Global Monitoring
Division flask measurements.
In addition to the standard full chemistry simulations of GEOS-Chem v9-02 (here-after called standard runs), three other runs also implementing the standard full
chem-20
istry have been performed with the version 9-02, but in each of them either the an-thropogenic, biogenic or biomass burning emissions of NMVOCs and NO (nitric ox-ide) have been turned off. These additional simulations are referred to below as non-anthropogenic, non-biogenic and non-biomass burning runs, respectively. It is worth noting that CH4concentrations in these sensitivity runs are still derived from the NOAA
25
ACPD
15, 31287–31333, 2015Diurnal cycle and multi-decadal trend
of formaldehyde
B. Franco et al.
Title Page
Abstract Introduction
Conclusions References
Tables Figures
◭ ◮
◭ ◮
Back Close
Full Screen / Esc
Printer-friendly Version Interactive Discussion
Discussion
P
a
per
|
Discussion
P
a
per
|
Discussion
P
a
per
|
Discussion
P
a
per
|
a 1 year run for chemical initialization, restarted several times to remove the effect of initial conditions.
The GEOS-Chem outputs consist of HCHO volume mixing ratio (VMR) profiles sim-ulated at the closest pixel to the Jungfraujoch station and saved at a 3 h time step. The comparisons between the GEOS-Chem simulations and the FTIR total columns
5
account for the vertical resolution and sensitivity of the FTIR retrievals. To this end, the individual VMR profiles simulated by GEOS-Chem have been regridded onto the 39-layer vertical scheme adopted at the ISSJ for the FTIR retrievals, according to a mass conservative interpolation (see details in Bader et al., 2015). Then these profiles have been smoothed according to the formalism of Rodgers and Connor (2003) by
con-10
volving them with the FTIR averaging kernels, seasonally averaged over March–May, June–August, September–November and December–February, as well as over suc-cessive years, on the basis of the July 2005–May 2013 FTIR dataset. The GEOS-Chem total columns have eventually been computed from these smoothed VMR profiles by using the corresponding regridded air density profiles simulated by the model. The
15
comparisons between the FTIR measurements and the GEOS-Chem simulations are performed over the 919 days with observations available in the July 2005–May 2013 time range.
3 Formaldehyde diurnal variation
3.1 Observed intra-day modulation 20
In this Section, we investigate the HCHO diurnal variation above the ISSJ using the total column measurements derived from the January 1995–June 2015 BRUKER data set, owing to their overall improved temporal regularity and measurement density com-pared to the LIEGE data set. The total columns have been normalized to the mean annual pressure at the ISSJ (654 hPa) in order to avoid the effects due to pressure
vari-25
ACPD
15, 31287–31333, 2015Diurnal cycle and multi-decadal trend
of formaldehyde
B. Franco et al.
Title Page
Abstract Introduction
Conclusions References
Tables Figures
◭ ◮
◭ ◮
Back Close
Full Screen / Esc
Printer-friendly Version Interactive Discussion
Discussion
P
a
per
|
Discussion
P
a
per
|
Discussion
P
a
per
|
Discussion
P
a
per
|
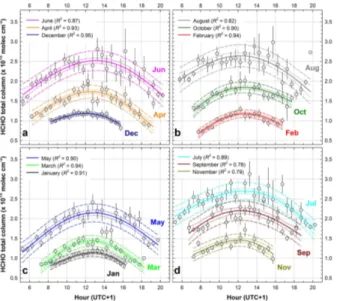
the intra-day modulation of the HCHO abundance above Jungfraujoch averaged over each month of the mean year (with the HCHO total columns averaged every 0.5 h as grey circles), according to the FTIR observations made over the entire 1995–mid-2015 time period (a global view of the observed and modelled monthly intra-day cycles is available in Fig. S1 in the Supplement and in Fig. 3a, Sect. 4.1, respectively).
5
At the global scale, the diurnal cycles of HCHO loadings depend on local chemical regimes, which generally vary across the seasons and determine the HCHO formation and loss, as well as local emissions of NMVOC precursors and their diurnal variability. For instance, it has been shown that daytime photochemical production and anthro-pogenic NMVOC emissions drive the HCHO diurnal modulation over highly-populated
10
and industrialized areas, such as in Belgium and Holland (see Stavrakou et al., 2015). However, at a remote site such as the ISSJ, located in the free troposphere during most part of the year, the overall sunrise to sunset modulation of the HCHO total columns is predominantly driven by the atmospheric photochemistry and the CH4 oxidation (see Sect. 4.2): enhanced insolation and higher temperatures intensify the concentration in
15
OH radicals and hence the photochemical oxidation rate of VOC precursors of HCHO. It is characterized by a.m. increases and p.m. decreases of the HCHO columns, peaking around mid-day and in the early afternoon. The amplitude of the intra-day modula-tion varies largely from month to month: from 0.2×10¹⁵molec cm−2 in December up to 1.0×10¹⁵molec cm−2during summertime. The weaker amplitude in winter is due to
20
relatively low solar zenith angle (SZA) around noontime, inducing less radiation, as well as to the weak moisture, both hindering the formation of OH. A similar pattern of HCHO diurnal cycle was reported over the remote ocean by MAX-DOAS measurements (Pe-ters et al., 2012).
The FTIR measurements are irregularly distributed throughout the day, with most
25
ob-ACPD
15, 31287–31333, 2015Diurnal cycle and multi-decadal trend
of formaldehyde
B. Franco et al.
Title Page
Abstract Introduction
Conclusions References
Tables Figures
◭ ◮
◭ ◮
Back Close
Full Screen / Esc
Printer-friendly Version Interactive Discussion
Discussion
P
a
per
|
Discussion
P
a
per
|
Discussion
P
a
per
|
Discussion
P
a
per
|
servations increases (see the error bars in Fig. 1). Furthermore, the retrievals from low-SZA spectra (around mid-day) are characterized by relatively low DOFS values, such as illustrated in Fig. 2a, due to the very weak solar absorptions by HCHO for low airmasses. This contributes to increasing the uncertainty on the retrieved total columns and explains the fluctuations of the running average observed around noontime during
5
the summer months (see Fig. 1). The diurnal variation of the HCHO abundance also shows for some months (e.g., August and September in Fig. 1b and d, respectively) a small re-increase of the total columns at the end of the day. This results from the fact that only observations made during later (earlier) days of the month are available at this moment for the first (last) six months of the year (see Fig. 2b), due to the
increas-10
ing (shortening) day length. Given the typical seasonal cycle of HCHO throughout the year, such measurements hence provide somewhat larger (lower) HCHO columns.
3.2 Parametric model of the diurnal variation
The diurnal modulation of the HCHO abundance above Jungfraujoch corresponds to a large short-term variability that should be accounted for when comparing
ground-15
based observations to e.g., satellite measurements and model results. Moreover, it is worth describing such a modulation in order to remove it before investigating seasonal/inter-annual variability of HCHO in the following parts of this study. There-fore, we have adjusted a fitting parametric model to each monthly subset, the results being presented in Fig. 1. To this end, the intra-day modulation used to adjust the
para-20
metric model consists of a running average (not shown in Fig. 1) of all individual FTIR measurements within each month, calculated using a 0.5 h time step and a 1.5 h-wide integration length (compatible with the HCHO lifetime). The smoothing associated with the running average helps dampening the contribution of very high HCHO loadings that correspond to “polluting” events. The previous analysis has highlighted that modelling
25
cy-ACPD
15, 31287–31333, 2015Diurnal cycle and multi-decadal trend
of formaldehyde
B. Franco et al.
Title Page Abstract Introduction Conclusions References Tables Figures ◭ ◮ ◭ ◮ Back Close
Full Screen / Esc
Printer-friendly Version Interactive Discussion Discussion P a per | Discussion P a per | Discussion P a per | Discussion P a per |
cles, in order to keep enough p.m. observations (i.e. statistics) for adjusting the model with high reliability.
The model used here (described in Eq. 1) consists in a re-parametrization of the standard statistical form of the Weibull continuous probability distribution of a random variablex. In this study, it determines the HCHO total column (y) as a density function
5
of the hour of the day (x), according to the amplitude (a), the scale parameter (b), the shape parameter (c) and the location parameter (or threshold; x0) of the distribution. The Weibull density function is a versatile distribution capable of adopting the charac-teristics of other types of distributions, according to the value of the shape parameter (c), and is widely used to mimic peaking distributions with asymmetric slopes.
10
y=a
c
−1 c
(1−cc)
×
x−x0
b +
c
−1 c
(1c)
(c−1)
× exp−
x−x0 b +(c−c1)(
1 c) c
+c−1 c
(1)
The model has been adjusted to the observations and the parameters calculated by using the iterative Levenberg–Marquardt algorithm (Marquardt, 1963) that minimizes the sum of the squared differences between the observations and the predicted values
15
of the model until convergence occurs (i.e. when the residuals no longer decreases sig-nificantly). The model fit for each month is represented as solid color curves in Fig. 1, along with the associated 95 % confidence and prediction bands. The coefficients of determination (R2) calculated between the monthly observations and model fits are high and range from 0.78 to 0.95 (see Fig. 1). The parameters a,b, cand x0
deter-20
mined by the adjustments are given for each month in Table S1 in the Supplement so that one may reproduce the model fits using Eq. (1).
The model is able to reproduce with reliability the diurnal modulation of HCHO load-ings above Jungfraujoch and allows for its quantitative characterization for a typical day of each month of the year, thanks to the large BRUKER statistical database. Since this
ACPD
15, 31287–31333, 2015Diurnal cycle and multi-decadal trend
of formaldehyde
B. Franco et al.
Title Page
Abstract Introduction
Conclusions References
Tables Figures
◭ ◮
◭ ◮
Back Close
Full Screen / Esc
Printer-friendly Version Interactive Discussion
Discussion
P
a
per
|
Discussion
P
a
per
|
Discussion
P
a
per
|
Discussion
P
a
per
|
model is parameterized, we use it in this study to scale individual FTIR measurements on a given moment of the day before carrying out a comparison with GEOS-Chem outputs (see Sect. 4.1) and a long-term trend study (see Sect. 5.2). Nonetheless, such a model cannot be used to extrapolate the HCHO total columns outside the actual range of measurements. In addition, this model is only valid if the condition in Eq. (2) is
5
true, otherwise the Weibull distribution collapses and the results are null (e.g., for the very first hours of the day).
x > x0−b
c
−1 c
(1c)
(2)
In order to remove the effect of the intra-day cycle, the pressure-normalized to-tal columns obtained from all individual measurements have been scaled to 9 a.m.
10
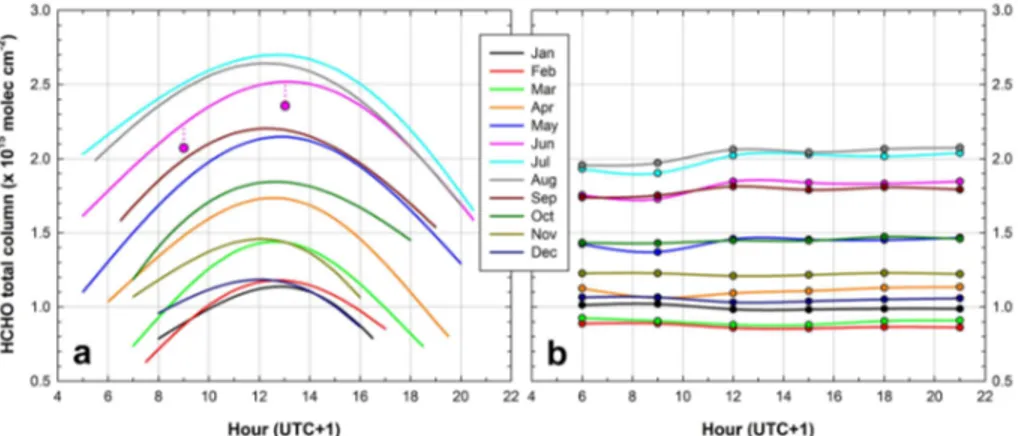
(UTC+1) on the basis of the parametric model described previously. Using Eq. (1) that links the daytime to the HCHO columns, as well as the constant parameters deter-mined for each month, the total column derived from a solar spectrum is scaled ac-cording to the difference between the actual time of the corresponding observation and 9 a.m. (UTC+1). An example is illustrated for June by the color circles in Fig. 3a (see
15
Sect. 4.1): an initial total column of 2.356×10¹⁵molec cm−2 derived from an obser-vation made at 13.025 a.m. is decreased to 2.072×10¹⁵molec cm−2 when scaled at 9 a.m. Here we have chosen 9 a.m. as reference time because observations for every month are available at this moment of the day, added to the fact that the gap between the different monthly intra-day regimes in terms of HCHO columns is minimal in the
20
ACPD
15, 31287–31333, 2015Diurnal cycle and multi-decadal trend
of formaldehyde
B. Franco et al.
Title Page
Abstract Introduction
Conclusions References
Tables Figures
◭ ◮
◭ ◮
Back Close
Full Screen / Esc
Printer-friendly Version Interactive Discussion
Discussion
P
a
per
|
Discussion
P
a
per
|
Discussion
P
a
per
|
Discussion
P
a
per
|
4 Formaldehyde simulated by GEOS-Chem
4.1 Comparison with GEOS-Chem standard run
Figure 3 presents the monthly diurnal variations as adjusted by the parametric model on the basis of the FTIR observations in Sect. 3.2 (Fig. 3a) and as derived from the 3 h outputs of the GEOS-Chem v9-02 standard run spanning the mid-2005–mid-2013
5
time period (Fig. 3b). The diurnal modulation of HCHO loadings above Jungfraujoch represents a large short-term variability superimposed on seasonal and inter-annual variations (Fig. 3a) that should be accounted for when comparing ground-based ob-servations to e.g., model results. However, Fig. 3b shows that GEOS-Chem does not capture the observed monthly intra-day variation. That a CTM is unable to simulate the
10
observed HCHO diurnal modulation, especially for remote conditions, has already been reported with IMAGES v2 (Stavrakou et al., 2015). This can be partially explained by the fact that different oxidation pathways of VOC precursor leading the HCHO produc-tion, which are numerous, might not be optimally implemented (especially very short-lived VOCs) or merely not considered in the model. In addition, large uncertainties
15
remain concerning the various sources of precursor emissions, their geographical dis-tribution and how these latter can influence the air masses over remote sites such as the ISSJ. Finally, the CTMs dilute local enhancements in HCHO due to their relatively coarse spatial resolution (2◦×2.5◦here), which also affects the comparison with obser-vations.
20
For this reason, we compare in this section HCHO total columns simulated by GEOS-Chem and obtained from the 9 a.m. model outputs, to the daily-averaged FTIR to-tal columns calculated on the basis of the 9 a.m.-scaled individual observations (see Sect. 3.2). This comparison is made over the May 2005–June 2015 time period, for the days with available FTIR observations only. In this study, some outliers, likely due to
25
ACPD
15, 31287–31333, 2015Diurnal cycle and multi-decadal trend
of formaldehyde
B. Franco et al.
Title Page
Abstract Introduction
Conclusions References
Tables Figures
◭ ◮
◭ ◮
Back Close
Full Screen / Esc
Printer-friendly Version Interactive Discussion
Discussion
P
a
per
|
Discussion
P
a
per
|
Discussion
P
a
per
|
Discussion
P
a
per
|
been identified as the daily-averaged HCHO total columns with relative anomalies to the curve fitted by the method of Gardiner et al. (2008, see Sect. 5.2 and Fig. 7 here below) higher than the 95th percentile value of all relative anomalies of the 2003–2015 data set.
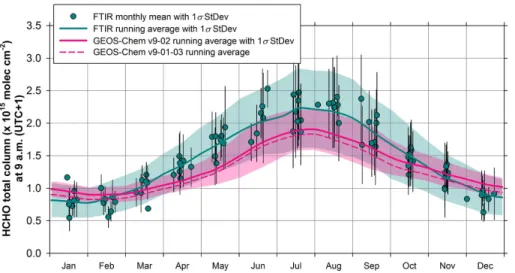
Figure 4 presents the good agreement (R=0.72) in terms of seasonal cycles of
5
HCHO loadings above Jungfraujoch, obtained from the FTIR observations and such as simulated by the GEOS-Chem v9-02 standard run. A similar seasonal comparison over the mid-2010–2012 time range has been carried out by Franco et al. (2015b), but involving results from the GEOS-Chem v9-01-03 standard run (in dashed red line in Fig. 4). This comparison illustrates the higher HCHO columns simulated by the
ver-10
sion 9-02 of GEOS-Chem compared to the version 9-01-03, due to the implementa-tion of the new isoprene oxidaimplementa-tion scheme (Paulot et al., 2009a, b) that enhances the HCHO formation under very low-NOxconcentrations. We refer to Franco et al. (2015b), Sect. 4.1, for the discussion regarding the mean seasonal bias of the GEOS-Chem re-sults to the FTIR HCHO total columns, which is here of −4.7±31.3 %. As the model
15
does not reproduce the HCHO intra-day variations at the ISSJ, this bias increases to −21.3±26.4 % for the comparison involving the 12 a.m. GEOS-Chem outputs and the 12 a.m.-scaled individual FTIR observations (withR=0.69).
4.2 GEOS-Chem sensitivity tests
In this part of the study, we investigate the influence of the different categories of
emis-20
sion sources implemented in GEOS-Chem v9-02, on the HCHO abundance simulated by the model above Jungfraujoch. To this end, we compare the results from the stan-dard run and from the three sensitivity runs performed without either anthropogenic, biomass burning or biogenic emissions of NMVOCs and NO. Figure 5a shows the monthly-averaged HCHO total columns at the ISSJ, derived from these simulations
25
ACPD
15, 31287–31333, 2015Diurnal cycle and multi-decadal trend
of formaldehyde
B. Franco et al.
Title Page
Abstract Introduction
Conclusions References
Tables Figures
◭ ◮
◭ ◮
Back Close
Full Screen / Esc
Printer-friendly Version Interactive Discussion
Discussion
P
a
per
|
Discussion
P
a
per
|
Discussion
P
a
per
|
Discussion
P
a
per
|
In Fig. 5a and b, it can be seen that none of the missing emission sources signifi-cantly impacts the simulated HCHO loadings in summer at the ISSJ, with the HCHO columns derived from either the non-anthropogenic or non-biogenic runs still account-ing for∼95 % of the total columns from the standard run (Fig. 5b). During this sea-son, biogenic primary NMVOCs such as isoprene may constitute a significant source
5
of HCHO, especially in the continental boundary layer. However, it is most likely that a large part of these very short-lived NMVOCs are already oxidized before being trans-ported to the ISSJ. Hence these compounds do not contribute directly to the HCHO loadings above Jungfraujoch, although they release biogenic secondary products that can be transported to the upper troposphere and in turn can be oxidized, adding to the
10
HCHO abundance in the upper tropospheric layers. During wintertime, the absence of anthropogenic emissions decreases the HCHO burden down to 75 % of the stan-dard run (Fig. 5b), with a December–February average of 82 % over July 2005–May 2013. Due to their longer lifetimes and more intensive anthropogenic combustion dur-ing this season, more elevated concentrations in reactive anthropogenic compounds
15
can be measured in winter at the ISSJ (Balzani Lööv et al., 2008; Legreid et al., 2008; Starokozhev et al., 2009), which contributes to the HCHO formation. Finally, the miss-ing biomass burnmiss-ing emissions have almost no effect on the simulated HCHO load-ings above Jungfraujoch (Fig. 5b). These tests suggest that the contribution of anthro-pogenic, biogenic and pyrogenic NMVOCs to the HCHO burden above Jungfraujoch is
20
quite limited, and that the oxidation of CH4(not included in the emission sources shut offhere) by OH dominates the HCHO production and constitutes the main driver of its seasonality.
It is worth noting that turning offthe emission sources in the GEOS-Chem sensitivity tests investigated here, may eventually result in slightly enhanced HCHO amounts (by
25
ACPD
15, 31287–31333, 2015Diurnal cycle and multi-decadal trend
of formaldehyde
B. Franco et al.
Title Page
Abstract Introduction
Conclusions References
Tables Figures
◭ ◮
◭ ◮
Back Close
Full Screen / Esc
Printer-friendly Version Interactive Discussion
Discussion
P
a
per
|
Discussion
P
a
per
|
Discussion
P
a
per
|
Discussion
P
a
per
|
OH is the main sink, inducing enhanced OH loadings above Jungfraujoch available for oxidation of other VOC precursors of HCHO, such as CH4. Indeed, Fig. 5c illustrating the monthly-averaged OH amounts simulated by the different sensitivity runs, as rela-tive to the standard run, shows OH total columns from the non-biomass burning and non-biogenic runs increased by up to 10 %. However, it is hard to evaluate the impact
5
of the excluded NO emissions, since this compound plays a key role in both HCHO formation (through the NMVOC oxidation pathways) and destruction (by contributing to the regeneration of OH). Investigating the balance between all these reactions would require a specific study that is beyond the scope of the present work.
According to the GEOS-Chem simulation performed without anthropogenic
emis-10
sions, the wintertime contribution of anthropogenic NMVOC precursors to the HCHO total column above Jungfraujoch varies from year to year (from 15 to 25 %; Fig. 5b). However, the wintertime total carbon emissions of anthropogenic origin as imple-mented into GEOS-Chem from the inventories, are approximately constant throughout the entire July 2005–May 2013 time range (∼2.7 Tg C month−1; Fig. 5d) when
inte-15
grated over Europe (between 38–56◦N and−15–55◦E). Hence this suggests that the HCHO production from oxidized anthropogenic compounds and its inter-annual vari-ability at the ISSJ are mainly driven in GEOS-Chem by the simulated OH burden and its year-to-year fluctuation (Fig. 5c).
5 Formaldehyde time series 20
5.1 Consistency between the FTIR data sets
We investigate hereafter the long-term evolution of the HCHO abundance at ISSJ, us-ing both the LIEGE and BRUKER FTIR data sets. We first evaluate the consistency of the measurements derived from both instruments. To this end, we compare the HCHO total columns derived from solar spectra recorded on the same days, using the 1995–
25
ACPD
15, 31287–31333, 2015Diurnal cycle and multi-decadal trend
of formaldehyde
B. Franco et al.
Title Page
Abstract Introduction
Conclusions References
Tables Figures
◭ ◮
◭ ◮
Back Close
Full Screen / Esc
Printer-friendly Version Interactive Discussion
Discussion
P
a
per
|
Discussion
P
a
per
|
Discussion
P
a
per
|
Discussion
P
a
per
|
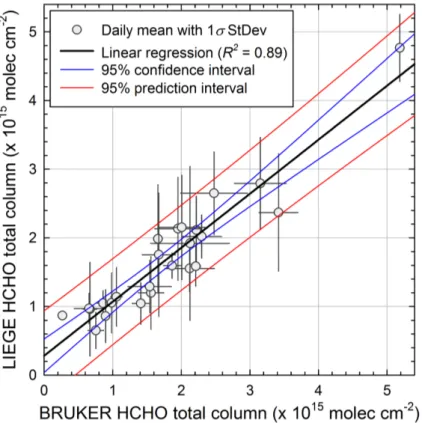
abundance. Figure 6 shows a scatter plot of the scaled (to 9 a.m.) BRUKER vs. LIEGE total column daily means, including the 25 days available over the 1995–1997 years. The comparison demonstrates a very good agreement between both data sets, with a high coefficient of determination (R2=0.89), for both low and high HCHO columns (corresponding globally to measurements performed during winter and summer). Given
5
the good consistency and absence of significant bias, the LIEGE and BRUKER data sets will be jointly used hereafter to investigate the long-term variation of the HCHO abundance above Jungfraujoch.
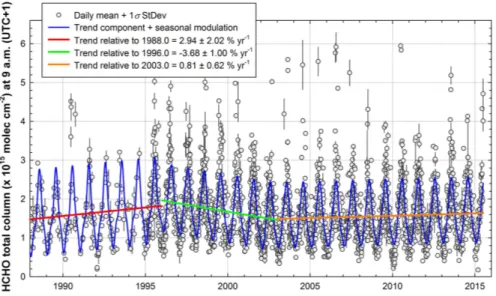
5.2 Formaldehyde multi-decadal trend
Combined together, the LIEGE and BRUKER data sets constitute a unique database
10
covering more than twenty-seven years (from January 1988 to June 2015), providing to our best knowledge the longest consistent time series of remote ground-based ob-servations of HCHO worldwide. In this part of the study, we employ the HCHO total columns derived from all individual FTIR observations made over the 1988–2015 time period, scaled at 9 a.m. according to the method described previously, and eventually
15
combined as daily means. The entire daily mean total column time series is illustrated in Fig. 7. We have applied to the whole data set a running mean characterized by a 3 year integration length and a 6-month time step, in order to minimize the influence of the large intra-annual variability of HCHO. This has revealed a significant maximum of HCHO columns between end 1995 and early 1996, as well as a minimum around the
20
beginning of 2003. The trend and associated uncertainty affecting each subset (i.e. the daily mean total column subsets spanning the 1988–1995, 1996–2002 and 2003–2015 periods, respectively) have been determined using a statistical bootstrap resampling tool (Gardiner et al., 2008) combining a linear function and a third-order Fourier series that accounts for the strong seasonal modulation of HCHO (in blue curve in Fig. 7).
25
ACPD
15, 31287–31333, 2015Diurnal cycle and multi-decadal trend
of formaldehyde
B. Franco et al.
Title Page
Abstract Introduction
Conclusions References
Tables Figures
◭ ◮
◭ ◮
Back Close
Full Screen / Esc
Printer-friendly Version Interactive Discussion
Discussion
P
a
per
|
Discussion
P
a
per
|
Discussion
P
a
per
|
Discussion
P
a
per
|
and 2003–2015, respectively. Using the 1988.0, 1996.0 and 2003.0 columns modelled by the bootstrap tool as references, we obtain the following relative annual trends: 2.94±2.02 % yr−1up to 1995,−3.68±1.00 % yr−1between 1996 and 2002, and 0.81± 0.62 % yr−1from 2003 onwards. It is worth noting that the choice of the reference hour for scaling the individual HCHO columns has no significant impact on the calculated
5
rates of change. For example, the relative annual trends obtained from HCHO total columns scaled at 12 p.m., i.e. when the difference between the 12 monthly intra-day regimes is near its maximum, are 2.55±1.75 % yr−1(1988–1995),−3.26±0.90 % yr−1 (1996–2002) and 0.70±0.54 % yr−1 (2003–2015). However, these trends may differ when calculated over specific seasons only. The corresponding results are summarized
10
in Table 2.
The HCHO increase observed above Jungfraujoch between 1988 and 1995 may be related to the sharp rise of the atmospheric CH4growth rate from the 1980s to the be-ginning of the 1990s (Nisbet et al., 2014), which is its main precursor in the background troposphere (see Sect. 4.2). Above the ISSJ, Zander et al. (2008) calculated discrete
15
annual changes of CH4total column derived from FTIR observations equal to 0.72 and 0.31 % yr−1 for 1987–1988 and 1995–1996, respectively. In addition, all seasons also present a significant positive rate of change of HCHO loadings at the 2σ confidence level over this time period, excepting fall (see Table 2). Nonetheless, the data set cov-ering this time range is mainly constituted of FTIR measurements recorded with the
20
LIEGE instrument, which are sparser than those obtained with the BRUKER spectrom-eter from 1995 onwards (as obvious in Fig. 7). This may explain the relatively large 2σ confidence levels associated with the trends determined over this period. Conversely, the decreased HCHO loadings from 1996 to 2002 may be due to the global stabilization of the CH4concentrations during most of this period (Dlugokencky, 2003), which was
25
ACPD
15, 31287–31333, 2015Diurnal cycle and multi-decadal trend
of formaldehyde
B. Franco et al.
Title Page
Abstract Introduction
Conclusions References
Tables Figures
◭ ◮
◭ ◮
Back Close
Full Screen / Esc
Printer-friendly Version Interactive Discussion
Discussion
P
a
per
|
Discussion
P
a
per
|
Discussion
P
a
per
|
Discussion
P
a
per
|
However, it should be noted that the wintertime minimum of HCHO is not affected by this decrease (see Table 2).
The observed rise of the HCHO total columns at the ISSJ during the last decade (over 2003–mid-2015), which mainly occurs during spring (see Table 2), may be ex-plained by the highly-studied global renewed increase of atmospheric CH4, starting
5
in the mid-2000s (Kirschke et al., 2013; Nisbet et al., 2014). Indeed, this enhanced growth rate of CH4total columns have already been highlighted at the ISSJ from 2005 onwards, using ground-based FTIR measurements and a GEOS-Chem tagged simula-tion (Bader et al., 2015). It is also worth noting that the decrease of many anthropogenic precursors of HCHO as a result of pollution abatements in the Northern Hemisphere
10
has no apparent influence on the HCHO evolution during the last decade, probably due to the fact that the HCHO formation coming from these oxidized anthropogenic com-pounds is dominated by the methane-originated production, as pointed out in Sect. 4.2. Globally over the 1996–mid-2015 time period, the high-rate depletion of the HCHO loadings at the ISSJ over 1996–2002 still dominates the slow renew from 2003
on-15
wards: the rate of change of the HCHO burden is −0.61±0.26 % yr−1 from January 1996 to June 2015.
6 Summary and conclusions
In this study, we use the strategy developed by Franco et al. (2015b) to retrieve HCHO total columns from high-resolution ground-based FTIR solar spectra recorded at the
20
high-altitude station of Jungfraujoch. Because of its localization, this site allows for the study of the continental background conditions in the remote troposphere at mid-latitude of the Northern Hemisphere. Using the large statistics that represents the Jan-uary 1995–June 2015 data set of solar spectra recorded with a Bruker instrument, we first investigate the HCHO diurnal variations above the station. These variations,
re-25
inso-ACPD
15, 31287–31333, 2015Diurnal cycle and multi-decadal trend
of formaldehyde
B. Franco et al.
Title Page
Abstract Introduction
Conclusions References
Tables Figures
◭ ◮
◭ ◮
Back Close
Full Screen / Esc
Printer-friendly Version Interactive Discussion
Discussion
P
a
per
|
Discussion
P
a
per
|
Discussion
P
a
per
|
Discussion
P
a
per
|
lation modulation and the CH4 oxidation. Then, we characterize quantitatively these monthly diurnal variations by adjusting a parametric model to the observations, con-sisting in a re-parametrization of the standard statistical form of the Weibull continuous probability distribution of a random variable. The equation of the model and its pa-rameters determined on the basis of the observations are provided. As this model is
5
fully parameterized and links the daytime to the HCHO columns, it is eventually used to scale all the individual FTIR measurements on 9 a.m. (i.e. when the difference between the monthly intra-day regimes is minimal) in order to remove the effect of the intra-day modulation.
In the next part of the study, we perform a GEOS-Chem v9-02 simulation of the
10
HCHO loadings above Jungfraujoch over the July 2005–May 2013 time period. As the analysis of the model outputs revealed that GEOS-Chem does not reproduce the ob-served diurnal variations of the HCHO columns, we use the daily-mean 9 a.m.-scaled FTIR measurements to compare with the simulated 9 a.m. total columns, accounting for the vertical resolution and sensitivity of the FTIR retrievals. Over this period, the
15
enhanced HCHO burden simulated by GEOS-Chem v9-02 compared to the version 9-01-03 reduces the mean bias with the observations, due to the implementation of the new isoprene oxidation scheme in version 9-02. Results from GEOS-Chem sensitiv-ity runs (turning offsuccessively either the anthropogenic, biogenic or biomass burn-ing emissions of NMVOCs and NO implemented in the model) are also investigated
20
and suggest that the HCHO loadings above Jungfraujoch, as well as its seasonal and inter-annual variations, are predominantly led by the atmospheric CH4 oxidation. The anthropogenic precursors of HCHO are estimated to contribute up to 25 % to the win-tertime HCHO total columns, while the impact of each of the other emission sources is limited to 5 %.
25
ACPD
15, 31287–31333, 2015Diurnal cycle and multi-decadal trend
of formaldehyde
B. Franco et al.
Title Page
Abstract Introduction
Conclusions References
Tables Figures
◭ ◮
◭ ◮
Back Close
Full Screen / Esc
Printer-friendly Version Interactive Discussion
Discussion
P
a
per
|
Discussion
P
a
per
|
Discussion
P
a
per
|
Discussion
P
a
per
|
a 27 year time series of HCHO total columns, which is to our best knowledge the longest time series of remote HCHO observations worldwide. Employing the paramet-ric model, the intra-day variation is removed by scaling all the individual measurements of the data set to 9 a.m. We eventually use the so-scaled entire time series to study the long-term evolution of the HCHO columns in the background troposphere. Trend
analy-5
sis reveals an increasing HCHO burden between 1988 and 1995 (2.9 % yr−1), followed by a sharp depletion over 1996–2002 (−3.7 % yr−1) and a slow renew of the growth rate from 2003 onwards (0.8 % yr−1). This long-term evolution above Jungfraujoch is likely to be related with the fluctuations of the atmospheric CH4as well as with the short-term variability of the OH concentrations.
10
Regional decadal trends at the global scale of mid-morning and early-afternoon HCHO columns have been recently derived from combined SCIAMACHY–GOME-2A, B and OMI measurements, respectively, over the 2004–2014 time period (De Smedt et al., 2015). Over Western Europe, these trends show an overall significant decrease of the HCHO abundance (between−1.5 and−3.0 % yr−1, mainly attributed to effective
15
pollution regulation measures (De Smedt et al., 2010). According to the ground-based FTIR observations, we observe on the contrary a weak significant increase (less than 1 % yr−1) of the HCHO total columns above the ISSJ, over approximately the same time period (2003–2015). These opposite trends may be explained by the fact that the space borne measurements cover entire regions (more specifically Germany, France
20
and Spain) that are largely under influence of anthropogenic emissions of NMVOC pcursors, while the Jungfraujoch HCHO columns are generally characteristic of the re-mote troposphere and mainly originate from the CH4oxidation (see results in Sect. 4.2). Due to its very short lifetime, the abundance and spatial distribution of HCHO in the atmosphere can be closely related to the emissions of its NMVOC precursors and
25
predomi-ACPD
15, 31287–31333, 2015Diurnal cycle and multi-decadal trend
of formaldehyde
B. Franco et al.
Title Page
Abstract Introduction
Conclusions References
Tables Figures
◭ ◮
◭ ◮
Back Close
Full Screen / Esc
Printer-friendly Version Interactive Discussion
Discussion
P
a
per
|
Discussion
P
a
per
|
Discussion
P
a
per
|
Discussion
P
a
per
|
nantly originating from the photochemical oxidation regimes of CH4, such inverse mod-elling studies will be difficult to carry out on the basis of the ground-based FTIR mea-surements of HCHO. Nevertheless, identifying in the Jungfraujoch time series the large HCHO columns that are due to the injection of “polluted” air masses from the planetary boundary layer (e.g., from the nearby industrialized valleys), by the use of backward
5
trajectories models, can help in the determination of significant trends of HCHO ac-cording to the origin of the air masses.
As HCHO is a key component in the global catalytic cycle responsible for generating or destroying tropospheric O3 (depending on the NOx levels), monitoring and
under-standing of the HCHO evolution for background conditions are of primary importance.
10
Indeed, many questions arise as regards to the renewed increase of atmospheric CH4, the main precursor of HCHO in the remote troposphere. According to Stickler et al. (2006) and Fried et al. (2008), oxidized CH4 still represents an important source to HCHO production in the uppermost tropospheric layers, with contributions that vary from 40 to more than 50 %, depending on the air masses. More particularly, a sharp
in-15
crease of the ethane (C2H6) burden close to 5 % yr− 1
since 2009, attributed to the mas-sive growth of shale gas exploitation in North America, has recently been highlighted above Jungfraujoch (Franco et al., 2015a). Therefore, as C2H6 is a HCHO precursor and shares most of its sources with CH4, there are some concerns as to the impact on the evolution of the HCHO loadings. Ground-based FTIR measurements combined to
20
model simulations can undoubtedly help on these issues.
The parametric model implemented in this study and the quantitative characteriza-tion of the monthly intra-day variacharacteriza-tions of HCHO may be a very useful tool in future works dedicated to the comparison between ground-based FTIR and space borne HCHO measurements. Indeed, long-term consistent data sets of regular HCHO
ob-25
ACPD
15, 31287–31333, 2015Diurnal cycle and multi-decadal trend
of formaldehyde
B. Franco et al.
Title Page
Abstract Introduction
Conclusions References
Tables Figures
◭ ◮
◭ ◮
Back Close
Full Screen / Esc
Printer-friendly Version Interactive Discussion
Discussion
P
a
per
|
Discussion
P
a
per
|
Discussion
P
a
per
|
Discussion
P
a
per
|
HCHO columns to the respective overpass times of the satellite sensors, this paramet-ric model applied to the Jungfraujoch long-term time series may be of high value for future validation/calibration tasks in remote conditions at mid-latitude of the Northern Hemisphere. The parameters are made available as Table S1 in the Supplement.
The Supplement related to this article is available online at 5
doi:10.5194/acpd-15-31287-2015-supplement.
Acknowledgements. The University of Liège contribution has been primarily supported by the PRODEX project ACROSAT funded by the Belgian Science Policy Office (BELSPO). The F.R.S.-FNRS and the Fédération Wallonie Bruxelles contributed to observational activities sup-port. The Swiss GAW-CH program is further acknowledged. E. Mahieu is research associate
10
with F.R.S.-FNRS. We are grateful to the International Foundation High Altitude Research Sta-tions Jungfraujoch and Gornergrat (HFSJG, Bern) for supporting the facilities needed to per-form the observations. We further acknowledge the vital contribution from all the Belgian col-leagues in performing the Jungfraujoch FTIR observations, among which Philippe Demoulin for recording all the homemade spectra used here. This research was also financially supported
15
at ULg by the EU 7th Framework Programme projects NORS (contract 284421) and AGACC-II (BELSPO, Brussels).
References
Anderson, L. G., Lanning, J. A., Barrell, R., Miyagishima, J., Jones, R. H., and Wolfe, P.: Sources and sinks of formaldehyde and acetaldehyde: An analysis of Denver’s ambient concentration
20
data, Atmos. Environ., 30, 12, 2113–2123, doi:10.1016/1352-2310(95)00175-1, 1996. 31289 Atkinson, R.: Atmospheric chemistry of VOCs and NOx, Atmos. Environ., 34, 2063–2101,
doi:10.1016/S1352-2310(99)00460-4, 2000. 31289
Aydin, M., Verhulst, K. R., Saltzman, E. S., Battle, M. O., Montzka, S. A., Blake, D. R., Tang, Q., and Prather, M. J.: Recent decreases in fossil-fuel emissions of ethane and methane derived
25
ACPD
15, 31287–31333, 2015Diurnal cycle and multi-decadal trend
of formaldehyde
B. Franco et al.
Title Page
Abstract Introduction
Conclusions References
Tables Figures
◭ ◮
◭ ◮
Back Close
Full Screen / Esc
Printer-friendly Version Interactive Discussion
Discussion
P
a
per
|
Discussion
P
a
per
|
Discussion
P
a
per
|
Discussion
P
a
per
|
Bader, W., Bovy, B., Conway, S., Strong, K., Smale, D., Turner, A. J., Bernath, P. F., Blumen-stock, T., Coulon, A., Franco, B., Garcia, O., Griffith, D., Hase, F., Hausmann, P., Jones, N., Lejeune, B., Murata, I., Morino, I., Nakajima, H., Paton-Walsh, C., Robinson, J., Schnei-der, M., Servais, C., Sussmann, R., and Mahieu, E.: Changes of atmospheric methane (CH4) since 2005 from NDACC FTIR measurements and GEOS-Chem tagged simulation, J.
Geo-5
phys. Res.-Atmos., in review, 2015. 31297, 31308
Balzani Lööv, J. M., Henne, S., Legreid, G., Staehelin, J., Reimann, S., Prévôt, A. S. H., Steinbacher, M., and Vollmer, M. K.: Estimation of background concentrations of trace gases at the Swiss Alpine site Jungfraujoch (3580 m a.s.l.), J. Geophys. Res., 113, D22305, doi:10.1029/2007JD009751, 2008. 31304
10
Bey, I., Jacob, D. J., Yantosca, R. M., Logan, J. A., Field, B. D., Fiore, A. M., Li, Q., Liu, H. Y., Mickley, L. J., and Schultz, M. G.: Global modeling of tropospheric chemistry with assimi-lated meteorology: model description and evaluation, J. Geophys. Res.-Atmos., 106, 23073– 23095, doi:10.1029/2001JD000807, 2001. 31292, 31295
Calvert, J. G., Atkinson, R., Kerr, J. A., Madronich, S., Moortgat, G. K., Wallington, T. J., and
15
Yarwood, G. (Eds.): The mechanisms of atmospheric oxidation of the alkenes, Oxford Uni-versity Press, New York, 552 p., 2000. 31289
Cantrell, C. A., Davidson, J. A., McDaniel, A. H., Shetter, R. E., and Calvert, J. G.: Temperature-dependent formaldehyde cross sections in the near-ultraviolet spectral region. J. Phys. Chem., 94, 3902–3908, doi:10.1021/j100373a008, 1990. 31289
20
Carlier, P., Hannachi, H., and Mouvier, G.: The chemistry of carbonyl compounds in the at-mosphere: A review, Atmos. Environ., 20, 2079–2099, doi:10.1016/0004-6981(86)90304-5, 1986. 31290
Chance, K., Palmer, P. I., Spurr, R. J. D., Martin, R. V., Kurosu, T. P., and Jacob, D. J.: Satellite observations of formaldehyde over North America from GOME, Geophys. Res. Lett., 27,
25
3461–3464, doi:10.1029/2000GL011857, 2000. 31290
Choi, W., Faloona, I. C., Bouvier-Brown, N. C., McKay, M., Goldstein, A. H., Mao, J., Brune, W. H., LaFranchi, B. W., Cohen, R. C., Wolfe, G. M., Thornton, J. A., Sonnen-froh, D. M., and Millet, D. B.: Observations of elevated formaldehyde over a forest canopy sug-gest missing sources from rapid oxidation of arboreal hydrocarbons, Atmos. Chem. Phys.,
30
10, 8761–8781, doi:10.5194/acp-10-8761-2010, 2010. 31291