ACPD
10, 29631–29682, 2010SO2 and BrO in Eyjafjallaj ¨okull’s
plume
K.-P. Heue et al.
Title Page
Abstract Introduction
Conclusions References
Tables Figures
◭ ◮
◭ ◮
Back Close
Full Screen / Esc
Printer-friendly Version
Interactive Discussion
Discussion
P
a
per
|
Dis
cussion
P
a
per
|
Discussion
P
a
per
|
Discussio
n
P
a
per
|
Atmos. Chem. Phys. Discuss., 10, 29631–29682, 2010 www.atmos-chem-phys-discuss.net/10/29631/2010/ doi:10.5194/acpd-10-29631-2010
© Author(s) 2010. CC Attribution 3.0 License.
Atmospheric Chemistry and Physics Discussions
This discussion paper is/has been under review for the journal Atmospheric Chemistry and Physics (ACP). Please refer to the corresponding final paper in ACP if available.
SO
2
and BrO observation in the plume of
the Eyjafjallaj ¨okull volcano 2010:
CARIBIC and GOME-2 retrievals
K.-P. Heue1, C. A. M. Brenninkmeijer1, A. K. Baker1, A. Rauthe-Sch ¨och1,
D. Walter1,3, T. Wagner1, C. H ¨ormann1,3, H. Sihler1,3, B. Dix2, U. Frieß3, U. Platt3,
B. G. Martinsson4, P. F. J. van Velthoven5, M. Hermann6, A. Zahn7, and
R. Ebinghaus8
1
Max-Planck-Institut f ¨ur Chemie (MPI), Mainz, Germany
2
Department of Chemistry and Biochemistry, University of Colorado, Boulder, USA
3
Institut f ¨ur Umweltphysik, Universit ¨at Heidelberg, Heidelberg, Germany
4
Avdelningen f ¨or k ¨arnfysik, Lunds universitet, Lund, Sweden
5
Koninklijk Nederlands Meteorologisch Instituut (KNMI), De Bilt, The Netherlands
6
Leibniz-Institut f ¨ur Troposph ¨arenforschung, Leipzig, Germany
7
Institut f ¨ur Meteorologie und Klimaforschung (IMK) Karlsuhe Insitute of Technology, Karlsruhe, Germany
8
ACPD
10, 29631–29682, 2010SO2 and BrO in Eyjafjallaj ¨okull’s
plume
K.-P. Heue et al.
Title Page
Abstract Introduction
Conclusions References
Tables Figures
◭ ◮
◭ ◮
Back Close
Full Screen / Esc
Printer-friendly Version
Interactive Discussion
Discussion
P
a
per
|
Dis
cussion
P
a
per
|
Discussion
P
a
per
|
Discussio
n
P
a
per
|
Abstract
The ash cloud of the Eyjafjallaj ¨okull1volcano on Iceland caused closure of large parts of European airspace in April and May 2010. For the validation and improvement of the European volcanic ash forecast models several research flights were performed. Also the CARIBIC (Civil Aircraft for the Regular Investigation of the atmosphere Based on 5
an Instrument Container) flying laboratory, which routinely measures at cruise altitude (≈11 km) performed three dedicated measurements flights through sections of the ash plume. Although the focus of these flights was on the detection and quantification of the volcanic ash, we report here on sulphur dioxide (SO2) and bromine monoxide (BrO)
measurements with the CARIBIC DOAS (Differential Optical Absorption Spectroscopy) 10
instrument during the second of these special flights on 16 May 2010. As the BrO and the SO2 observations coincide, we assume the BrO to have been formed inside the
volcanic plume. Both SO2and BrO observations agree well with simultaneous satellite
(GOME-2) observations. SO2 column densities retrieved from satellite observations are often used as an indicator for volcanic ash. For SO2 some additional information
15
on the local distribution can be derived from a comparison of forward and back scan GOME-2 data. More details on the local plume size and position are retrieved by combining CARIBIC and GOME-2 data.
1 Introduction
Volcanic eruptions emit large amounts of ash and reactive gases into the atmosphere. 20
Depending on the mass of ashes emitted, its height and the geographical position of the volcano, the influence on the atmospheric composition varies between local and global (e.g., Pinatubo 1991). As an explosive eruption of the Icelandic volcano Eyjafjallaj ¨okull (63◦37′48′′N 19◦37′12′′W) from 14 April to 24 May 2010 demonstrated, a modest
1
ACPD
10, 29631–29682, 2010SO2 and BrO in Eyjafjallaj ¨okull’s
plume
K.-P. Heue et al.
Title Page
Abstract Introduction
Conclusions References
Tables Figures
◭ ◮
◭ ◮
Back Close
Full Screen / Esc
Printer-friendly Version
Interactive Discussion
Discussion
P
a
per
|
Dis
cussion
P
a
per
|
Discussion
P
a
per
|
Discussio
n
P
a
per
|
volcanic eruption can have serious atmospheric consequences as large parts of the Western European airspace were closed. Satellite observations of Eyjafjallaj ¨okull’s plume showed enhanced values of sulphur dioxide (SO2) mainly after 19 April 2010.
Sulphur dioxide is typically emitted by volcanoes and therefore often used as tracer for volcanic plumes and hence for volcanic ash (Carn et al., 2009). Moreover, volcanic 5
bromine monoxide (BrO) was detected by satellite measurements close to Iceland but also further downwind, suggesting that bromine was emitted by the Eyjafjallaj ¨okull as well.
Here we present observations of SO2 and BrO north of Ireland on 16 May 2010.
Based on the combination of the DOAS CARIBIC data with GOME-2 satellite data 10
additional information on spatial distribution details can be gained. The data were recorded during a special mission of the CARIBIC observatory (Civil Aircraft for the Regular Investigation of the atmosphere Based on an Instrument Container, http: //www.caribic-atmospheric.com; Brenninkmeijer et al., 2007) deployed on board of a Lufthansa Airbus A340-600 passenger aircraft. Three special flights were aimed 15
at a fairly complete observation of the volcanic plume by means of in situ trace gas and aerosol measurements, complemented by air and aerosol sampling. As the SO2 and BrO column densities were below the detection limit during the first flight (20 April 2010, when the plume originated from the first eruption phase having low SO2
emis-sions), and the DOAS instrument malfunctioned during the third (19 May 2010), we 20
focus on the second flight. Besides the Lufthansa – CARIBIC measurement flights, other airborne measurements (e.g. Schumann et al., 2010) as well as ground based observations by lidar and ozone soundings were made (Ansmann et al., 2010; Flentje et al., 2010).
ACPD
10, 29631–29682, 2010SO2 and BrO in Eyjafjallaj ¨okull’s
plume
K.-P. Heue et al.
Title Page
Abstract Introduction
Conclusions References
Tables Figures
◭ ◮
◭ ◮
Back Close
Full Screen / Esc
Printer-friendly Version
Interactive Discussion
Discussion
P
a
per
|
Dis
cussion
P
a
per
|
Discussion
P
a
per
|
Discussio
n
P
a
per
|
monoxide (BrO) forms inside their plumes primarily through heterogeneous reactions (Eqs. R1–R5). The mechanism is similar to the one observed in polar spring leading to the “bromine explosion” and the concurrent arctic tropospheric ozone depletion events (e.g. Simpson et al., 2007). After attachment of HBr or HOBr to acidic aerosols, Br2is produced in the aqueous phase by the reaction with Br− and H+. Molecular bromine is released into the atmosphere, where it is photolysed and the bromine atoms react with O3 to form BrO and O2. Hence the production of BrO takes only place under daylight conditions. Moreover the mixing ratio of ozone must be sufficient through mixing in of background air from outside the plume. Other studies (Bobrowski et al., 2007) on volcanic BrO close to a crater observed a higher BrO concentration towards the plume edges compared to the centre. They concluded that the enhanced mixing in of ozone towards the edges caused the higher BrO concentration there, in contrast to the plume centre, where the ozone concentration is too low.
HBr→HBraq (R1)
HOBraq+Br−+H+ →Br
2,aq+H2O (R2)
Br2,aq →Br2 (R3)
Br2
h·ν
→2·Br (R4)
Br+O3→BrO+O2 (R5)
BrO+BrO→Br2+O2 (R6)
As the heterogeneous reaction of HCl is slower by several orders of magnitude (Sander et al., 1997) a corresponding chlorine explosion is not observed. However instead of Br2 also BrX (X=F, Cl or I) may be released from the aerosols and become photo dissociated, leading to a small chlorine source. Indeed chlorine oxides (ClO, OClO) have been observed in volcanic plumes (e.g. Bobrowski et al., 2007). For the 5
ACPD
10, 29631–29682, 2010SO2 and BrO in Eyjafjallaj ¨okull’s
plume
K.-P. Heue et al.
Title Page
Abstract Introduction
Conclusions References
Tables Figures
◭ ◮
◭ ◮
Back Close
Full Screen / Esc
Printer-friendly Version
Interactive Discussion
Discussion
P
a
per
|
Dis
cussion
P
a
per
|
Discussion
P
a
per
|
Discussio
n
P
a
per
|
2 Description of the instruments
2.1 CARIBIC project
CARIBIC is based on a Lufthansa Airbus A340-600 retrofitted with a three probe (trace gases, water and aerosol) inlet system. Under normal operations the aircraft carries the instrument container on a monthly basis during four consecutive regular passenger 5
flights for 2–3 days. CO, CO2, O3, NO, NO2, NOy, CH4, some organic compounds (e.g. acetone), mercury, total and gaseous water and aerosols are measured in real time. In addition, 16 aerosol samples and 116 air samples (28 prior to spring 2010) are collected for post flight laboratory analysis of aerosol elemental composition, (Nguyen et al., 2006) and of a host of trace gases (Schuck et al., 2009; Baker et al., 2010a). 10
A video camera in the inlet pylon takes a frame every second for post flight cloud cover analysis. Furthermore three miniature DOAS telescopes are mounted in the pylon. The instruments are maintained and operated by nine scientific groups from institutes in Europe (http://www.caribic-atmospheric.com, August 2010).
The instrumental container was updated in winter 2009/2010 with three new instru-15
ments: a new high resolution air sampler for 88 additional air samples, a cavity ring down absorption spectrometer (CRDS) for the D/H and18O/16O ratios of water (Dyroff
et al., 2010) and an offaxis integrated cavity output spectrometer (OA-ICOS) for in situ measurements of CH4 and CO2 (Kattner et al., 2010). A new optical particle counter
(OPC) for the aerosol size distribution between 125 nm and 1 µm was installed instead 20
of the old one. The O3analyser, the H2O instruments were improved and the NOy in-strument was extended for NO2. Also the DOAS instrument was upgraded (Sect. 2.2).
The trace gas and aerosol measurements are complemented by standard in flight observations from the plane (e.g. position, temperature, wind speed, pressure) which are provided by Lufthansa. The Royal Dutch Meteorological Institute (KNMI) supports 25
ACPD
10, 29631–29682, 2010SO2 and BrO in Eyjafjallaj ¨okull’s
plume
K.-P. Heue et al.
Title Page
Abstract Introduction
Conclusions References
Tables Figures
◭ ◮
◭ ◮
Back Close
Full Screen / Esc
Printer-friendly Version
Interactive Discussion
Discussion
P
a
per
|
Dis
cussion
P
a
per
|
Discussion
P
a
per
|
Discussio
n
P
a
per
|
interpolated to the position and time of the CARIBIC observation.
2.2 DOAS on CARIBIC
The CARIBIC DOAS instrument is described in detail in Dix et al. (2009) and Heue et al. (2010). It measures scattered sunlight and uses Differential Optical Absorption Spectroscopy (DOAS) (Platt and Stutz, 2008) to retrieve trace gas amounts in the at-5
mosphere. DOAS is based on the Lambert-Beer-Law:
I(λ)=I0(λ)·eSCD·σ(λ) (1) It describes the reduction in the intensityI0 at a certain wavelength (λ) when passing through a medium with absorption cross section (σ(λ)), with SCD being the absorber concentration (c) integrated along the light path:
10
SCD=
Z
lightpath
c(r)dr (2)
It is usually referred to as Slant Column Density (SCD). Since many atmospheric trace gases e.g. NO2, SO2, BrO, O3, O4or HCHO have unique absorption cross sections in
the UV/Vis wavelength range, several tracers can be quantified simultaneously when using a certain wavelength interval. In principle the determination of SCDs requires 15
knowledge of the solar radiationI0before entering the atmosphere. However, as this cannot be measured with the same instrument and the strong Fraunhofer absorptions have to be removed, a reference spectrum is included in the retrieval. Usually a nor-mal scattered light spectrum recorded before or after the period of interest is used. Because of that the retrieved slant column is a differential column, relative to the refer-20
ACPD
10, 29631–29682, 2010SO2 and BrO in Eyjafjallaj ¨okull’s
plume
K.-P. Heue et al.
Title Page
Abstract Introduction
Conclusions References
Tables Figures
◭ ◮
◭ ◮
Back Close
Full Screen / Esc
Printer-friendly Version
Interactive Discussion
Discussion
P
a
per
|
Dis
cussion
P
a
per
|
Discussion
P
a
per
|
Discussio
n
P
a
per
|
to those below the plume. For some trace gases, e.g. BrO, the subtraction of the refer-ence spectrum automatically includes the correction for the stratospheric signal, if the change in the solar zenith angle is small enough.
As the slant column density is highly dependent on factors like viewing geometry, solar position, cloud coverage and aerosol content, the vertical column density is in-5
troduced to compare the observation with other data e.g. satellite observations. The vertical column density (VCD) is defined as the height integral of the concentration (Eq. 3). For the conversion of measured SCD to VCD an Air Mass Factor (AMF) is introduced as the ratio between SCD and VCD (Eq. 4). The AMF is numerically sim-ulated under consideration of all above mentioned parameters. We used the radiative 10
transfer model McArtim (Deutschmann, 2009), a full spherical Monte Carlo radiative transfer model, to retrieve the AMFs. Because of the Monte Carlo algorithm, the AMF has a statistical error. Together with the simulated AMF the 1σ variance is estimated by the program. For our study the error in the AMFs is below 7%.
VCD= ZTOA
0
c(z)d z (3)
15
AMF=SCD
VCD (4)
The CARIBIC DOAS instrument observes scattered sunlight under three different elevation angles (−82◦, named nadir, −10◦, +10◦, relative to the horizon). The three small telescopes present in the CARIBIC-pylon are connected to the three spectrome-ters mounted in the container via quartz fibre bundles. In Winter 2009/2010 the exist-20
ACPD
10, 29631–29682, 2010SO2 and BrO in Eyjafjallaj ¨okull’s
plume
K.-P. Heue et al.
Title Page
Abstract Introduction
Conclusions References
Tables Figures
◭ ◮
◭ ◮
Back Close
Full Screen / Esc
Printer-friendly Version
Interactive Discussion
Discussion
P
a
per
|
Dis
cussion
P
a
per
|
Discussion
P
a
per
|
Discussio
n
P
a
per
|
time resolution could be reduced from 30 to 8 s (corresponding to 7.5 km and 2 km horizontal resolution, respectively) without increasing the measurement errors.
Unfortunately during the same period the quartz fibres in the bundle connecting the
+10◦ telescope with its spectrometer was damaged and could not be replaced before the volcanic flights. So, for this study only two viewing directions are active. Moreover 5
since these were the first data recorded with the new system (immediately after the recertification of the CARIBIC container after the updates) some parameter settings were still suboptimal. Particularly the intensity detected with the −10◦ spectrometer is far below that of nadir and some spectra reached oversaturation since the determi-nation of the integration time had to be optimized under real flight conditions. Apart 10
from the high temporal resolution analyses of all spectra, occasionally up to ten spec-tra were co-added (excluding the oversaturated ones) to reduce noise and improve the detection limit.
The wavelength interval for the SO2analysis ranged from 311.6 nm to 333 nm (5 SO2 bands) for comparison also the wavelength range down to 307.5 nm was considered, 15
covering another SO2 band. Due to strong absorption of UV light by stratospheric
ozone, the signal strength deteriorates when extending the wavelength range to shorter wavelengths. For the same reason BrO was retrieved in a second fitting window, (324 to 353 nm) which includes 6 bands where the recorded intensity of the spectra is up to 3 times higher compared to the SO2 interval. A third fitting window (332–367 mm) 20
was added to retrieve the O4column density. It should be mentioned that similar SCDs
were observed in the different wavelength intervals (except for a higher noise in the SO2fitting window).
Besides SO2 (Bogumil et al., 2003, 273 K) and BrO (Wilmouth et al., 1999, 228 K),
also O3(Bogumil et al., 2003, 223 K and 243 K) and NO2(Vandaele et al., 1996) were
25
taken into account in the data retrieval. For the BrO and the O4fitting windows (Fig. 1) O4(Greenblatt et al., 1990) was included. To distinguish between the O4slant column
densities (molec2cm−5) and the normal SCD (molec cm−2) the O4 SCDs∗are marked
ACPD
10, 29631–29682, 2010SO2 and BrO in Eyjafjallaj ¨okull’s
plume
K.-P. Heue et al.
Title Page
Abstract Introduction
Conclusions References
Tables Figures
◭ ◮
◭ ◮
Back Close
Full Screen / Esc
Printer-friendly Version
Interactive Discussion
Discussion
P
a
per
|
Dis
cussion
P
a
per
|
Discussion
P
a
per
|
Discussio
n
P
a
per
|
light (Grainer and Ring, 1962) was corrected by including a Ring spectrum (Bussemer, 1993; Kraus, 2005) in the retrieval. The Ring spectrum is calculated from the reference spectrum. Depending on the size of the fitting window a polynomial of third to fifth order was included to simulate the broad band effects like molecular scattering or aerosol scattering. The temperature in the plume was roughly −5◦C, hence the SO2 cross
5
section for 273 K is used for the SO2retrieval for CARIBIC and for GOME-2.
We also checked for OClO (Kromminga et al., 2003), which has already been ob-served in other volcanic plumes (e.g. Bobrowski et al., 2007). However, the resulting column density was always below the detection limit of 6×10¹³molec cm−2for the co-added spectra, corresponding to≈4 ppt in the plume as described below (Sect. 4.1). 10
Formaldehyde (HCHO) is predicted by some models (R. von Glasow, personal com-munication, 2010) as product of enhanced methane oxidation caused by elevated chlo-rine concentrations. Although some retrieved column densities for HCHO approached the detection limit (1.5×10¹⁶molec cm−2), the respective DOAS fits were not robust as the retrieved columns showed a strong dependence on the choice of the wavelength 15
range and the cross sections included in the retrieval. Assuming a plume height range from 3 to 6 km the retrieved SCD corresponds to an upper limit mixing ratio of roughly 1 ppb. HCHO results will not be further discussed.
In Fig. 1 an example fit for the three wavelength ranges (fitting windows) is shown, only a few trace gas absorptions are depicted here to keep the figure clear. The SO2 20
absorption is very strong in this spectrum, but also the BrO absorption is clearly ob-served.
The typical fit error for BrO in the co-added spectra was around 1×10¹³molec cm−2, which is similar or slightly higher than depicted in Fig. 1. For the SO2 the error in the
SCD is in most cases less than 4×10¹⁵molec cm−2 for the averaged nadir data. Due 25
to the low optical density of BrO the relative measurement errors are higher. For the in-dividual spectra the typical errors are 1.5–2×10¹³molec cm−2and 8×10¹⁵molec cm−2 for BrO and SO2, respectively in nadir and 6×10
13
ACPD
10, 29631–29682, 2010SO2 and BrO in Eyjafjallaj ¨okull’s
plume
K.-P. Heue et al.
Title Page
Abstract Introduction
Conclusions References
Tables Figures
◭ ◮
◭ ◮
Back Close
Full Screen / Esc
Printer-friendly Version
Interactive Discussion
Discussion
P
a
per
|
Dis
cussion
P
a
per
|
Discussion
P
a
per
|
Discussio
n
P
a
per
|
calculated according to Eq. (4), whereby an error of the AMF of less than 7% can be assumed. Table 1 shows the total error of the vertical column density for both lines of sight and the important trace gases for this study.
2.3 GOME-2 on MetOp-A
A short description of the GOME-2 instrument and the SO2 data retrieval is given in 5
Heue et al. (2010). The GOME-2 (Global Ozone Monitoring Experiment) on MetOp-A is the first of a series of three identical instruments. MetOp-A was launched into a sun-synchronous polar orbit at 800 km altitude in October 2006 and crosses the equator at 09:30 LT (local time). The GOME-2 instrument is a 4 channel UV/Vis grating spectrom-eter, which covers the wavelength region of 240–790 nm with a spectral resolution of 10
0.2–0.4 nm. Besides the backscattered and reflected radiance from the Earth it also observes direct sunlight.
The ground pixel size is roughly 80×40 km2 and the total swath width is 1920 km (24 pixels wide), thereby achieving daily coverage at mid latitudes (http://www.esa.int/ esaLP/LPmetop.html, September 2009). The respective pixels are scanned from the 15
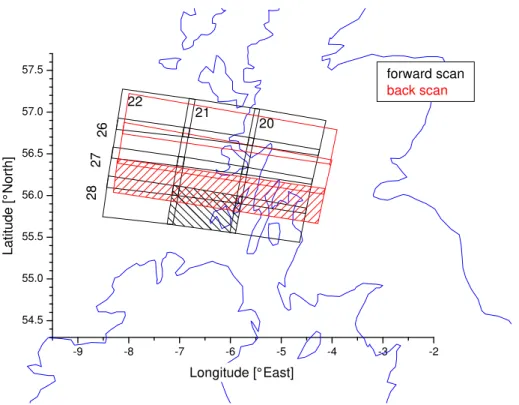
east to the west by rotating a mirror in the optical system of the entrance optics. When it turns back, the respective ”back scan” pixel (240×40 km2) is obtained. The forward and backward scan pixel partially overlap (Fig. 2). In Fig. 2 1/8 of the total swath is shown, it has 24 forward and 8 back scan pixels. The figure can be extended to both sides, and so the back scans shown here also partly overlap with the previous forward 20
scans to the east, which are not shown.
The SO2 absorption is analysed from the satellite spectra in the wavelength range
from 312.1 to 324 nm (Fig. 1 left SO2 window) using the DOAS method. To remove
the Fraunhofer lines, a direct sun spectrum (containing no atmospheric absorptions) is included in the fitting process. The trace gas cross sections for O3 (G ¨ur et al., 2005,
25
223 K), SO2(Bogumil et al., 2003, 273 K), a Ring spectrum (Bussemer, 1993; Wagner
ACPD
10, 29631–29682, 2010SO2 and BrO in Eyjafjallaj ¨okull’s
plume
K.-P. Heue et al.
Title Page
Abstract Introduction
Conclusions References
Tables Figures
◭ ◮
◭ ◮
Back Close
Full Screen / Esc
Printer-friendly Version
Interactive Discussion
Discussion
P
a
per
|
Dis
cussion
P
a
per
|
Discussion
P
a
per
|
Discussio
n
P
a
per
|
account for broad band effects and atmospheric scattering. Because the atmospheric light paths within the selected fitting window change systematically with wavelength (e.g. van Roozendael et al., 2006), not only the original ozone absorption cross section but also a second one (the original cross section scaled with a fourth order polynomial in wavelength) are included in the fitting algorithm. As the SO2column density in this 5
study is rather low, the saturation effects as documented by Richter et al. (2009) or Yang et al. (2009) need not to be considered. The retrieval error of the SO2 SCD is
5×10¹⁶molec cm−2. Hence, it is a factor of ten higher than for CARIBIC DOAS.
The wavelength range from 336 to 360 nm includes 4 BrO bands (Fig. 1 right: O4
win-dow) and is therefore well suited for the retrieval of the BrO slant column density. The 10
BrO cross section from Wilmouth et al. (1999) was used, the considered ozone cross sections (22 3K and 243 K) (G ¨ur et al., 2005) were measured with the flight model spec-trometers of GOME-2. Moreover O4 (Greenblatt et al., 1990), NO2 (Vandaele et al.,
1996), OClO (Bogumil et al., 2003) and SO2 (Bogumil et al., 2003) were included in the data retrieval. Also in the BrO retrieval a Ring spectrum (Bussemer, 1993; Wagner 15
et al., 2009) and an inverse spectrum were included, calculated from the direct sunlight spectrum. The statistical retrieval error of the BrO SCDs is 3×10¹³molec cm−2. As a matter of fact, the retrieved column densities in the plume (≈6×10¹³molec cm−2) are close to the detection limit, nevertheless the comparison with the CARIBIC columns shows quite good agreement (Sect. 4.2.2).
20
In order to calculate the vertical column density in the plume, the measured slant column densities were corrected for the latitudinal and longitudinal dependent offset, which in the case of SO2 is mainly caused by the spectral interference with ozone or
imperfect fitting of the Ring effect. In the case of BrO, the observed volcanic signal is superimposed on the strongly latitudinal-dependent stratospheric BrO distribution. 25
The correction process was only applied to a preselected area of interest (38◦W–15◦E, 35◦N–72◦N), including 3 adjacent GOME-2 orbits. To account for the di
ACPD
10, 29631–29682, 2010SO2 and BrO in Eyjafjallaj ¨okull’s
plume
K.-P. Heue et al.
Title Page
Abstract Introduction
Conclusions References
Tables Figures
◭ ◮
◭ ◮
Back Close
Full Screen / Esc
Printer-friendly Version
Interactive Discussion
Discussion
P
a
per
|
Dis
cussion
P
a
per
|
Discussion
P
a
per
|
Discussio
n
P
a
per
|
applying the geometric AMF:
AMFgeom=
1 cos(LOS)+
1
cos(SZA) (5)
Here, LOS and SZA are the line of sight (nadir=0◦) and the solar zenith angle, respec-tively. As the VCDgeom is independent of the LOS, the back-ground can now be esti-mated as a smooth function of the pixels outside the plume. Therefore, a 2-dimensional 5
polynomial fit of 3rd order was applied to the VCD of all pixels, where the SO2 VCD
does not exceed the 1σ variation (and therefore are supposed not to be part of the volcanic plume).
The corresponding BrO VCDsgeom were fitted by a 2-dimensional polynomial of 4th
order to the same back ground pixels. By subtracting the resulting polynomial from all 10
VCDs (including the VCDs from the presumed volcanic plume pixels) we obtained the offset corrected (normalised) vertical column densities VCDnorm(Fig. 12).
During the plume observation the SZA was≈44◦, hence the geometrical AMF varied between 2.4 (nadir) and 2.8 (LOS±45◦). For the direct comparison to the CARIBIC DOAS observation (Sect. 4.2) radiative transfer simulations with McArtim (Sect. 2.2) 15
(Deutschmann, 2009) were performed including the same cloud and aerosol settings as for CARIBIC DOAS. Beforehand the corrected VCDnormis multiplied with the
geo-metric AMF to calculate a corrected slant column density SCDnorm.
For the retrieval of the BrO vertical column densities the error of slant column den-sities is dominating and the error of the AMF (Sect. 2.2) can be neglected. Therefore 20
the total error can be estimated by 3×10¹³/AMF≈1.6×1013molec cm−2. For the SO2
ACPD
10, 29631–29682, 2010SO2 and BrO in Eyjafjallaj ¨okull’s
plume
K.-P. Heue et al.
Title Page
Abstract Introduction
Conclusions References
Tables Figures
◭ ◮
◭ ◮
Back Close
Full Screen / Esc
Printer-friendly Version
Interactive Discussion
Discussion
P
a
per
|
Dis
cussion
P
a
per
|
Discussion
P
a
per
|
Discussio
n
P
a
per
|
3 Observations
3.1 Measurement flights
Three special measurement flights were performed to help validate the volcanic ash forecasts. Several forecast models (e.g. VAAC, British Met Office (Fig. 3), Eurad (Uni-K ¨oln), Flexpart (NILU)) were compared to get the best possible estimate on the plume’s 5
position and movement. Obviously no fly zones as stipulated by the European Volcanic Ash Advisory Centre had to be avoided at all times. According to the forecasts (Fig. 3) for 16 May 2010 the optimal areas to observe particle mass concentrations close to the given aviation safety threshold of 2000 µg m−3were over Ireland and the Irish Sea and accordingly these areas were probed, with a first leg over Ireland and a second one 10
over the Irish Sea. The transfer flights to and from Ireland were flown at higher altitude (Fig. 4) to reach the research airspace at minimum cost and time.
The actual flight pattern is shown in Fig. 4. As the airspace north of the Isle of Man (≈54◦N) was closed, the plane had to turn south at this point. During the plume ob-servation the flight altitude varied between 2 and 7 km. This altitude range was chosen 15
because above flight level 200 (6.1 km) the models predicted low concentrations. On the same day the DLR Falcon also performed measurements over the British Isles and its lidar data observed the maximum plume altitude at 6 km (Schumann et al., 2010) only a few hundred kilometres east over the North Sea close to the British coast (54.6◦N, 0.2◦W).
20
ACPD
10, 29631–29682, 2010SO2 and BrO in Eyjafjallaj ¨okull’s
plume
K.-P. Heue et al.
Title Page
Abstract Introduction
Conclusions References
Tables Figures
◭ ◮
◭ ◮
Back Close
Full Screen / Esc
Printer-friendly Version
Interactive Discussion
Discussion
P
a
per
|
Dis
cussion
P
a
per
|
Discussion
P
a
per
|
Discussio
n
P
a
per
|
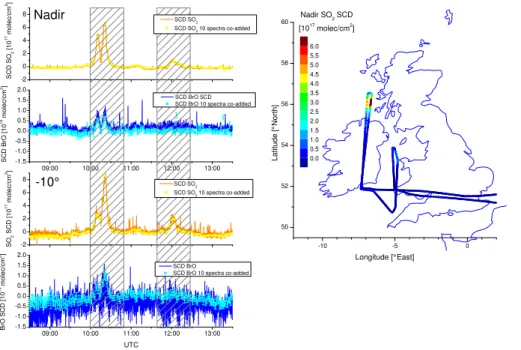
3.2 CARIBIC DOAS observation
The DOAS instrument measured three major enhancements of SO2 (Fig. 6): two of
them were very close together (10:05–10:25 LT) and a third, weaker one was measured about 2 h later over the Irish Sea. The first two SO2peaks can be attributed to the same
plume (Fig. 6). It was observed north of Ireland (Fig. 6) just before and after the u-turn. 5
At the same time enhanced BrO was observed as shown in Figs. 1 and 6.
We are confident that the third peak is just the edge of the large plume that extends further north (Fig. 13), although the Airbus could not fly further north due to the aviation safety rules. At the plume’s edge no BrO was observed. Based on the elemental com-position of aerosol sample No 6 taken between 11:38:19 and 12:27:20 LT, the minor 10
peak south of the Isle of Man can also be attributed to the volcanic plume (Sect. 3.3.1). The oxygen dimer O4 provides a standard tool for passive DOAS observations to
estimate the aerosol optical thickness along the light path (e.g. Wagner et al., 2004; Frieß et al., 2006; Heue, 2005). Therefore the observed O4 slant column densities
are compared to calculated SCDs∗ (Sect. 2.2) based on radiative transfer simulations. 15
The parameterisation of the aerosol extinction in the model is adapted to the measure-ment. Other parameters e.g. cloud cover, solar zenith angle, and viewing geometry, are included in the model. In Fig. 7 the decrease in the O4SCD∗and the simultaneous
increase in the SO2 column densities is shown. The coincidence with the SO2 peaks indicates convincingly that volcanic aerosols caused the observed reductions in the 20
light path.
However, because there was nearly complete cloud cover below the plane, the cloud top height and optical thickness have to be included in the radiative transfer simulation. The video camera in the pylon has an elevation of−13.2◦, and a field of view of 36◦. When a cloud is first observed in the centre of the video image and a few seconds 25
ACPD
10, 29631–29682, 2010SO2 and BrO in Eyjafjallaj ¨okull’s
plume
K.-P. Heue et al.
Title Page
Abstract Introduction
Conclusions References
Tables Figures
◭ ◮
◭ ◮
Back Close
Full Screen / Esc
Printer-friendly Version
Interactive Discussion
Discussion
P
a
per
|
Dis
cussion
P
a
per
|
Discussion
P
a
per
|
Discussio
n
P
a
per
|
(MODIS – http://ladsweb.nascom.nasa.gov/, August 2010) of the cloud top height, so in the radiative transfer simulation the cloud top height was fixed to 1.5 km. The ge-ometrical and optical thickness (COT) of the cloud were set to 1 km and 10 (Fig. 8), respectively. The horizontal variability in the COT seems to be small (Fig. 8), hence we assumed the same cloud parameters for the plume as well as for the reference. 5
The geometrical thickness of the plume was assumed to be constant, with plume bottom at 3 and plume top at 6 km altitude (U. Schumann, personal communication, 2010). The aerosol optical thickness and the single scattering albedo were varied in the range from 0.3 km−1 to 2.5 km−1 and from 0.8 to 0.99, respectively, for the simu-lation of the optical properties of the volcanic ash cloud. As the algorithm to calculate 10
the exposure time of the spectrometers still had to be optimised, the intensity ratios were weighted by only 10% compared to the O4 columns. An aerosol extinction of
0.8 km−1combined with a single scattering albedo of 0.95 leads to the best agreement between simulations and observations. Compared to the MODIS observation the to-tal aerosol extinction (TAE≈1) is much higher, which can at least partly be explained 15
with the higher spatial resolution of the CARIBIC DOAS instrument (2 km to 15 km) and by the slight temporal mismatch (10:20 UTC for CARIBIC and 10:56 UTC for MODIS) combined with the strong variability of the volcanic ash cloud.
3.3 Other CARIBIC data
As the aeroplane flew over the ash cloud first and went through it after the u-turn, most 20
instruments observed the plume during the second leg. However, just before the first SO2 peak a small aerosol peak was detected, perhaps remains of an older plume at
higher altitude, or a small streak that reached slightly higher.
3.3.1 Aerosols
During the flight on 16 May 2010 the optical particle counter (Sect. 2.1) failed. There-25
ACPD
10, 29631–29682, 2010SO2 and BrO in Eyjafjallaj ¨okull’s
plume
K.-P. Heue et al.
Title Page
Abstract Introduction
Conclusions References
Tables Figures
◭ ◮
◭ ◮
Back Close
Full Screen / Esc
Printer-friendly Version
Interactive Discussion
Discussion
P
a
per
|
Dis
cussion
P
a
per
|
Discussion
P
a
per
|
Discussio
n
P
a
per
|
volcanic ash plume were measured. The CPCs (condensation particle counters) mea-sure small particles and cover the size range of 4 nm to 2 µm providing three size bins of 4–12 nm, 12–18 nm and above 18 nm. The respective results are illustrated in Fig. 9. The first aerosol peak seems not to correlate with DOAS O4 or SO2 data. This indi-cates that the condensation nuclei number density is dominated by small particles, 5
which have only a minor influence on the O4SCD∗. The second and third peak were
observed just before the SO2column densities peak. In contrast to the third peak the aerosol number concentration of the second one reaches background levels before the DOAS instrument observes the plume’s maximum. The aerosol data indicate that the aeroplane passed through the main plume during the period when the second SO2 10
peak was observed. Whether or not the first two narrow peaks can be attributed to parts of the plume cannot be inferred from our observation.
Moreover, during the plume observations aerosol samples were collected from 9:59:32 to 10:49:09 LT and 11:38:19 to 12:27:20 LT (Fig. 6). Based on the particle-induced X-ray emission (PIXE) analysis the aerosols were clearly identified as being 15
of volcanic origin by their enhanced concentration of several elements such as silicon, potassium, calcium and iron (samples 4 and 6). We found a similar elemental com-position for a volcanic ash sample from Iceland, and Flentje et al. (2010) also reported a similar composition for rain water probes containing washed out particles at Hohen-peißenberg. In addition to these crustal elements, the CARIBIC aerosol samples con-20
tained enhanced concentrations of secondarily produced sulphurous aerosol as well as carbonaceous matter, in agreement with observations from the 2008 eruption of the Kasatochi volcano (Martinsson et al., 2009).
3.3.2 Mercury, ozone and carbon monoxide
CARIBIC measures mercury with a single amalgamation, cold vapour atomic fluores-25
ACPD
10, 29631–29682, 2010SO2 and BrO in Eyjafjallaj ¨okull’s
plume
K.-P. Heue et al.
Title Page
Abstract Introduction
Conclusions References
Tables Figures
◭ ◮
◭ ◮
Back Close
Full Screen / Esc
Printer-friendly Version
Interactive Discussion
Discussion
P
a
per
|
Dis
cussion
P
a
per
|
Discussion
P
a
per
|
Discussio
n
P
a
per
|
Glasow, 2010). However, in the measured concentrations (Fig. 9) neither an increase nor a decrease is discernible.
The CARIBIC flying laboratory contains two ozone analysers (Brenninkmeijer et al., 2007), namely a fast (0.2 s) chemiluminescence and a slower (4 s) UV absorption in-strument. Since the UV absorption instrument is more accurate, its data are shown in 5
Fig. 9. However, it has a weak cross sensitivity to SO2caused by the absorption cross
section of SO2 in the UV range. The interference is proportional to the ratio of the ab-sorption cross sections. At 265 nm the ratioσ(SO2)
σ(O3) is close to 4×10
−2
i.e. an additional SO2mixing ratio of 40 ppb (Sect. 4.1) causes an overestimation of 1.6 ppb in O3. This
difference is too small to be resolved by the two ozone analysers. 10
The ozone mixing ratio is enhanced during the first aerosol peak, indicating that the local air masses might have been stratospherically influenced. During the second observation of the plume, however, it slightly decreases (to 25 ppb), which compared to the background variations is not significant.
During the observation of the second SO2peak an increase in CO is observed, while
15
for the first peak again the stratospheric signal (here a decrease) is found. The increase of 70 ppb is not a specific, but in this case clear indicator for the volcanic plume (e.g. Mori and Notsu, 1997). Similar observations (≈60 ppb) are reported by Schumann et al. (2010) for measurements on 17 May 2010.
Several in situ measurements show evidence of volcanic influence during the DOAS 20
observation of the second SO2 peak. During, or rather prior to the first observation
only an increase in the aerosol was found, preceding the SO2and O4 column density
increase. The aerosol peak does however correlate with high O3values. We conclude that the aeroplane crossed above the plume before it turned around, descended and subsequently crossed the plume.
ACPD
10, 29631–29682, 2010SO2 and BrO in Eyjafjallaj ¨okull’s
plume
K.-P. Heue et al.
Title Page
Abstract Introduction
Conclusions References
Tables Figures
◭ ◮
◭ ◮
Back Close
Full Screen / Esc
Printer-friendly Version
Interactive Discussion
Discussion
P
a
per
|
Dis
cussion
P
a
per
|
Discussion
P
a
per
|
Discussio
n
P
a
per
|
3.3.3 Hydrocarbons
Volcanoes do not to emit any higher hydrocarbons. On contrary the emitted gases, via complex chemistry, reduce the mixing ratios of a suite of hydrocarbons within the plume. In particular free chlorine radicals formed in the plume deplete a number of hydrocarbons, e.g. ethane and propane (Fig. 10, whole air sample no 9, 10:25 UTC), 5
whereas benzene which has a much slower rate of reaction with chlorine, remained unaffected (Baker et al., 2010b). The fact that the reactive hydrocarbons are not or very little reduced in the preceding samples (7 and 8) until 10:15 UTC confirms that the plane flew over the plume during this period. Samples no 13 to 16 were influenced by marine air masses according to the back trajectories.
10
3.4 Satellite data
Satellite instruments e.g. OMI (Ozone Monitoring Instrument, Levelt et al., 2006) on AURA and GOME-2 on Metop-A (Sect. 2.3) observed the evolution of Eyjafjallaj ¨okull’s plume right from the beginning. The SO2 columns were astonishingly low during the first phase of the eruption until 18 April 2010, thereafter substantial SO2 column
den-15
sities were observed.
Figure 11 shows the SO2 distribution over Western Europe on 16 May 2010. An
SO2 plume appears to be moving from Southern Iceland towards the British Isles, where the remainders of an older plume are located which moved towards Belgium and the Netherlands the following day. The AURA satellite, carrying also the OMI in-20
strument, passed over Europe around noon (12:51 UTC). To minimize time differences the CARIBIC data is compared to the GOME-2 data (Fig. 12) where the maximum dif-ference in the overpass times is less 15 min. In Fig. 12 only the forward scans are con-sidered, in the overlap regions (Sect. 2.3) the averages are shown. The SO2data show a compact plume situated over Northern England, with the BrO plume being patchy. 25
ACPD
10, 29631–29682, 2010SO2 and BrO in Eyjafjallaj ¨okull’s
plume
K.-P. Heue et al.
Title Page
Abstract Introduction
Conclusions References
Tables Figures
◭ ◮
◭ ◮
Back Close
Full Screen / Esc
Printer-friendly Version
Interactive Discussion
Discussion
P
a
per
|
Dis
cussion
P
a
per
|
Discussion
P
a
per
|
Discussio
n
P
a
per
|
Ireland where the CARIBIC flying laboratory observed the plume (6.67◦W/56.07◦N).
4 Discussion
4.1 CARIBIC DOAS data
Both viewing directions of the DOAS instrument observed the plume twice with the hor-izontal distance between the two observations being approximately 15 km. Especially 5
in the−10◦, line of sight the differences between the SO2 slant column densities are
quite obvious (Figs. 6 and 13). However, despite some variations of the SO2
concen-trations inside the plume also the different sensitivity for the SO2 layer, caused by the change in flight altitude is very important for the understanding of the SCDs.
The AMF for SO2 (315 nm – Fig. 14) and BrO (340 nm) were simulated using the
10
aerosol properties as retrieved from the O4 column densities (Sect. 3.2). Inside the
plume the visibility is strongly reduced by the volcanic aerosol, therefore the Box AMFs decrease very fast with distance from the plane.
The SO2 vertical column densities (Eqs. 3 and 4) for −10◦, and nadir agree quite
well (Fig. 15), with only the first observation of the plume with the −10◦, telescope 15
being slightly smaller than the respective nadir observation. This might be caused by some local variations in the SO2 concentration, both horizontally and vertically. For
BrO this effect is smaller, however as the noise in the −10◦, data is high, we assume the relative distributions of BrO and SO2to be the same. Because the viewing direction
changed rapidly during the turn no AMFs are calculated for this flight section. 20
In contrast to other observations made close to a volcanic crater (e.g. Bobrowski et al., 2007), we observe no increase in the BrO to SO2ratio towards the edges. This
was to be expected as the O3 mixing ratio in the plume centre (Fig. 9≈25 to 50 ppb)
is still high enough for the oxidation of bromine (R5). According to von Glasow (2010) between 10 and 30% of the total bromine in the plume is BrO, the retrieved BrO mixing 25
ACPD
10, 29631–29682, 2010SO2 and BrO in Eyjafjallaj ¨okull’s
plume
K.-P. Heue et al.
Title Page
Abstract Introduction
Conclusions References
Tables Figures
◭ ◮
◭ ◮
Back Close
Full Screen / Esc
Printer-friendly Version
Interactive Discussion
Discussion
P
a
per
|
Dis
cussion
P
a
per
|
Discussion
P
a
per
|
Discussio
n
P
a
per
|
is still much lower than the observed ozone mixing ratio of 25–50 ppb.
If we assume a constant mixing ratio for the complete layer from 3 to 6 km we retrieve roughly 40 ppb for SO2and 5 ppt BrO (Table 2). The values in Table 2 are calculated
with the maximum observations of the 80 s averages, the individual 8 s spectra result in similar mixing ratios with a 1-σvariation of 1.8 ppt BrO and 1.2 ppb SO2 during the 5
observation of the maximum in the nadir data. A better agreement between the vertical columns or the mixing ratios of the four individual observations cannot be expected, since different air masses were observed. The difference of 10 min corresponds to 6 km shift of the plume according to the wind speed (20 knts≈10 m s−1), which is not enough to compensate for the difference of 15 km between the two observation points. 10
In situ SO2 measurements on the DLR Falcon over the British east coast reached values over 30 ppb on the same day but a few hours later (Schumann et al., 2010). This is in good agreement with our data; although a different part of the plume was probed.
The horizontal extension of the plume is estimated based on the width of the SO2
15
peaks. The fact that two peaks can be distinguished in the time series of the SO2and
the BrO column densities proofs that for the short period in between the aeroplane did neither sample inside the plume nor flew over it. If this short period was due to the fact that the aeroplane briefly left the plume to return later, we calculate that the plume was 60 km wide. Compared to the model prediction (Fig. 3) the observed SO2 plume 20
is further north and smaller. The fact that the O4 time series (Fig. 7) show a similar
pattern indicates that the SO2and the aerosol plume coincide.
4.2 Comparison with GOME-2 satellite data
Comparing airborne DOAS observations with those from satellites always faces two questions:
25
ACPD
10, 29631–29682, 2010SO2 and BrO in Eyjafjallaj ¨okull’s
plume
K.-P. Heue et al.
Title Page
Abstract Introduction
Conclusions References
Tables Figures
◭ ◮
◭ ◮
Back Close
Full Screen / Esc
Printer-friendly Version
Interactive Discussion
Discussion
P
a
per
|
Dis
cussion
P
a
per
|
Discussion
P
a
per
|
Discussio
n
P
a
per
|
– If the spatial variation is small enough, do the instruments agree when the same air masses are observed?
Based on previous comparisons (Heue et al., 2010) we know that both observations can agree very well if the AMFs are calculated using the correct cloud and aerosol description and the data are corrected for differences in overpass times. In this study 5
the measurements were almost simultaneously i.e. 10:05 to 10:25 UTC for CARIBIC and 10:09 for GOME-2. Therefore large parts of the observed differences are most probably caused by the different spatial resolution of the two instruments in combination with the distribution of the trace gases.
4.2.1 Sulphur dioxide vertical column densities
10
A comparison of the SO2vertical columns is shown in Fig. 16, the surrounding GOME-2
pixels are shown for each CARIBIC DOAS observation, including forward and back-ward scan, as well as overlapping pixels. The lengths of the GOME-2 measurement points in this “time series” are given by the time the CARIBIC system spent in the re-spective pixel. The figure shows a clear symmetry for GOME-2, which is caused by the 15
fact that before, and after the u-turn CARIBIC flew over the same GOME-2 pixels. The location of the SO2 maximum agrees well with the CARIBIC observation for
both forward and back scan. Also the minimum to the north of the plume (10:15 UTC-CARIBIC) can be seen in the GOME-2 dataset. Due to the smaller pixel size the maxima are more pronounced in the forward scan, compared to the back scan, where 20
additional parts of the plume might be observed further east and west. Therefore it is apparently surprising that the better quantitative agreement with respect to the vertical column density is found for the backward scan. This finding can be understood when taking into account the local distribution of the SO2relative to the GOME-2 pixels.
According to Fig. 12, the SO2 plume is almost parallel to the GOME-2 scan
direc-25
ACPD
10, 29631–29682, 2010SO2 and BrO in Eyjafjallaj ¨okull’s
plume
K.-P. Heue et al.
Title Page
Abstract Introduction
Conclusions References
Tables Figures
◭ ◮
◭ ◮
Back Close
Full Screen / Esc
Printer-friendly Version
Interactive Discussion
Discussion
P
a
per
|
Dis
cussion
P
a
per
|
Discussion
P
a
per
|
Discussio
n
P
a
per
|
density than the smaller forward scan. At least at the position of the CARIBIC obser-vation the plume was located in the centre of the back scan (Fig. 17). An alternative explanation for higher back scan columns would be that the maximum is further east or west i.e. there is a second SO2maximum covered by the back scan but not observed by the respective GOME-2 forward scan. That implies that it is observed by any other 5
forward scan overlapping with this back scan.
The vertical column density for the back scan (swath 27) is 1.49×10¹⁷molec cm−2, the VCDs for the respective forward scans are listed in Table 3. Only pixel 19 of swath 28 (not shown in Fig. 2) has a VCD that is higher than the backward scan, due to its small overlap (≈390 km2) it contributes less than 4% to the back scan VCD.
10
80% of the area of the forward pixel 21 (swath 27) is also covered by the back scan, therefore the contribution of the back scan signal to this forward scan can easily be estimated. If the plume was homogenously distributed inside the back scan, then the signal of this forward pixel would be higher than 1.2×10¹⁷molec cm−2, even if the VCD vanished in the other 20% of the pixel. Therefore the SO2 column density cannot
15
have been homogenously distributed in the back scan. Of course this was not to be expected, especially as the CARIBIC data already showed local variability.
A combination of the CARIBIC and GOME-2 data might be used to estimate the size of the part of the plume which was observed by CARIBIC. The plume is about 60 km wide (Fig. 17) and the distance between the two CARIBIC observations is about 20
15 km. If we assume this part of the plume to be 60×40 km2 with an average VCD of 2×10¹⁷molec cm−2 (Fig. 16) then it contributes about 98% to the column density observed by GOME-2 forward scan (pixel 21 of swath 27), and 49% to the VCD of the pixel 21 of swath 28. The assumption that the plume expands over 80 km i.e. that it stretches over the complete pixel results in a VCD of 1.7×10¹⁷molec cm−2 and hence 25
ACPD
10, 29631–29682, 2010SO2 and BrO in Eyjafjallaj ¨okull’s
plume
K.-P. Heue et al.
Title Page
Abstract Introduction
Conclusions References
Tables Figures
◭ ◮
◭ ◮
Back Close
Full Screen / Esc
Printer-friendly Version
Interactive Discussion
Discussion
P
a
per
|
Dis
cussion
P
a
per
|
Discussion
P
a
per
|
Discussio
n
P
a
per
|
Hence the local variability of the SO2concentration or vertical column density must have been higher than expected from CARIBIC and the GOME-2 observations. In this estimate we assumed that outside the plume the vertical column vanishes, but even with this simple approximation we partly overestimated the GOME-2 signal.
To conclude, the plume we observed here with CARIBIC and GOME-2 was about 5
60 km wide, for the northern GOME-2 pixel (21 swath 27) the length inside the pixel was roughly 30 km or slightly more. For the southern pixel (21 swath 28) the estimated length is close to 80 km (covering the entire length of the pixel). Hence locally the plume did not extend parallel to the GOME-2 pixels but turns south. The shift according to the wind and time is insignificant, since 12 km to the west (20 min) is not enough to 10
transport the observed part of the plume to a different GOME-2 pixel (Fig. 17).
4.2.2 Bromine monoxide vertical column densities
In the CARIBIC DOAS observations SO2and BrO do coincide (Fig. 6), indicating that
the position of the maxima in the plume are the same. In contrast the BrO maxima in the GOME-2 data are shifted north compared to SO2(Fig. 12). Despite this spatial
15
shift in the GOME-2 BrO data, the BrO VCDs of CARIBIC and GOME-2 agree quite well (Fig. 18). Compared to SO2 (Fig. 16) both data sets are noisier, therefore a detailed study of the local distribution including forward and back scan as well as CARIBIC data cannot be accurate. Nevertheless one interesting case shall be mentioned: at the southern edge of the plume (10:08 and 10:24 UTC) the forward scan observes the 20
ACPD
10, 29631–29682, 2010SO2 and BrO in Eyjafjallaj ¨okull’s
plume
K.-P. Heue et al.
Title Page
Abstract Introduction
Conclusions References
Tables Figures
◭ ◮
◭ ◮
Back Close
Full Screen / Esc
Printer-friendly Version
Interactive Discussion
Discussion
P
a
per
|
Dis
cussion
P
a
per
|
Discussion
P
a
per
|
Discussio
n
P
a
per
|
5 Conclusions
The Eyjafjallaj ¨okull plume was observed by several instruments of the CARIBIC flying observatory during the special volcanic mission flight on 16 May 2010. While the re-mote sensing DOAS instrument observed the plume twice north of Ireland, many in situ instruments observed the plume only in the second case. This shows that the 5
aeroplane first flew over the plume, turned around to subsequently cross it. More-over, it highlights the importance of the remote sensing aspect of the DOAS instrument as a part of CARIBIC. A lot of additional information from the aerosol counters, the ozone and carbon oxide instruments as well as the air samplers is used to determine whether or not the plane was inside the plume, which is essential for the description of 10
the atmosphere during the AMF calculation. Unfortunately the optical particle counter failed during this flight, which might have given very useful additional information on the aerosol optical properties. Chemical evidence that the observed plume originated from the Eyjafjallaj ¨okull volcano was given by comparing elemental composition of collected aerosol samples with that of volcanic ash from Iceland. The video camera was for the 15
first time in the CARIBIC project used to give a rough approximation of the cloud top height, which is however limited by the coarse resolution of the video images.
Based on the O4column density, the aerosol extinction and single scattering albedo
were retrieved. Compared to MODIS satellite data, the retrieved total aerosol optical depth is higher by a factor of 2. The retrieved information was used to calculate the 20
local SO2and BrO mixing ratios inside the plume to 40 ppb (29–49) and 5 ppt (4.3–6.0),
respectively. The SO2 mixing ratio agrees well with in situ observation from the DLR Falcon further east. As additional instrument on CARIBIC a SO2in situ analyser might
be very useful, not only for special missions of volcanic plume hunting. For the small part of the plume sampled during this flight, the MetOffice dispersion model predicted 25
the plume further south and wider than it actually was.
ACPD
10, 29631–29682, 2010SO2 and BrO in Eyjafjallaj ¨okull’s
plume
K.-P. Heue et al.
Title Page
Abstract Introduction
Conclusions References
Tables Figures
◭ ◮
◭ ◮
Back Close
Full Screen / Esc
Printer-friendly Version
Interactive Discussion
Discussion
P
a
per
|
Dis
cussion
P
a
per
|
Discussion
P
a
per
|
Discussio
n
P
a
per
|
plume are considered in the AMF calculation. The GOME-2 BrO columns are close to the detection limit, however, a reasonable agreement could be observed here as well. A more detailed study on the column densities observed by the GOME-2 forward scan and the back scan showed that the local variability of SO2concentration is very high. By combining the CARIBIC and the GOME-2 vertical columns we estimated that the 5
observed part plume was 60 km wide and did not cover the entire length (80 km) of the GOME-2 pixels. While the length of the plume in the northern pixel was roughly 30 to 40 km, in the southern part the length almost reached the length of the whole pixel.
Acknowledgements. For providing the MODIS data at http://ladsweb.nascom.nasa.gov/ the MODIS team is acknowledged. We thank the OMI team for providing the figure at: http:
10
//www.temis.nl. The volcanic ash forecast groups especially at MetOffice are acknowledged for the forecasts used during flight preparation. Also Ulrich Schumann and the DLR Falcon scien-tific group are acknowledged for sharing some experiences and preliminary results. We thank Lufthansa Airlines for giving us the opportunity to measure under these unique conditions espe-cially Captain Martin Hoell, Andreas Waibel, Thomas Dauer, Sven Dankert and Detlev Hartwig
15
and of course the CARIBIC Team for their commitment and support. The DOAS system was built and operated by the Institut f ¨ur Umweltphysik of the Universit ¨at Heidelberg. Rinus Scheele (KNMI) is acknowledged for helping with the trajectory calculations. The development and oper-ation of the CARIBIC system has been financially supported by the German Bundesministerium f ¨ur Bildung und Forschung (BMBF – AFO 2000), by the European Commission’s DGXII
Envi-20
ronment RTD 4th, 5th and 6th framework programs, by the Max-Planck-Society, EON-Ruhrgas and Frankfurt Airport.
ACPD
10, 29631–29682, 2010SO2 and BrO in Eyjafjallaj ¨okull’s
plume
K.-P. Heue et al.
Title Page
Abstract Introduction
Conclusions References
Tables Figures
◭ ◮
◭ ◮
Back Close
Full Screen / Esc
Printer-friendly Version
Interactive Discussion
Discussion
P
a
per
|
Dis
cussion
P
a
per
|
Discussion
P
a
per
|
Discussio
n
P
a
per
|
References
Ansmann, A., Tesche, M., Groß, S., Freudenthaler, V., Seifert, P., Hiebsch, A., Schmidt, J., Wandinger, U., Mattis, I., M ¨uller, D., and Wiegner, M.: The 16 April 2010 major volcanic ash plume over Central Europe: EARLINET lidar and AERONET photometer observa-tions at Leipzig and Munich, Germany, Geophys. Res. Lett., 37, L13810, doi:10.1029/
5
2010GL043809, 2010. 29633, 29634
Baker, A. K., Schuck, T. J., Slemr, F., van Velthoven, P., Zahn, A., and Brenninkmeijer, C. A. M.: Characterization of non-methane hydrocarbons in Asian summer monsoon outflow observed by the CARIBIC aircraft, Atmos. Chem. Phys. Discuss., 10, 18101–18138, doi:10.5194/acpd-10-18101-2010, 2010a. 29636
10
Baker, A. K., Rauthe-Sch ¨och, A., Schuck, T. J., Brenninkmeijer, C. A. M., van Velthoven, P. F. J., and Oram D. E.: Chlorine radical chemistry in the Eyjafjallaj ¨okull volcanic plume, in preparation, 2010b. 29649
Bobrowski, N., H ¨onninger, G., Galle, B., and Platt, U.: Detection of bromine monoxide in a vol-canic plume, Nature, 423, 273–276, doi:10.1038/nature01625, 2003. 29634
15
Bobrowski, N., von Glasow, R., Aiuppa, A., Inguaggiato, S., Louban, I., Ibrahim, O. W., and Platt, U.: Reactive halogen chemistry in volcanic plumes, J. Geophys. Res., 112, D06311, doi:10.1029/2006JD007206, 2007. 29635, 29640, 29650
Bogumil, K., Orphal, J., Homann, T., Voigt, S., Spietz, P., Fleischmann, O. C., Vogel, A., Hart-mann, M., BovensHart-mann, H., Frerik, J., and Burrows, J. P.: Measurements of molecular
ab-20
sorption spectra with the SCIAMACHY pre-flight model: instrument characterization and reference data for atmospheric remote-sensing in the 230–2380 nm region, J. Photoch. Pho-tobio. A, 157, 167–184, doi:10.1016/s1010-6030(03)00062-5, 2003. 29639, 29641, 29642 Brenninkmeijer, C. A. M., Crutzen, P., Boumard, F., Dauer, T., Dix, B., Ebinghaus, R., Filippi, D.,
Fischer, H., Franke, H., Frieß, U., Heintzenberg, J., Helleis, F., Hermann, M., Kock, H. H.,
25
Koeppel, C., Lelieveld, J., Leuenberger, M., Martinsson, B. G., Miemczyk, S., Moret, H. P., Nguyen, H. N., Nyfeler, P., Oram, D., O’Sullivan, D., Penkett, S., Platt, U., Pupek, M., Ra-monet, M., Randa, B., Reichelt, M., Rhee, T. S., Rohwer, J., Rosenfeld, K., Scharffe, D., Schlager, H., Schumann, U., Slemr, F., Sprung, D., Stock, P., Thaler, R., Valentino, F., van Velthoven, P., Waibel, A., Wandel, A., Waschitschek, K., Wiedensohler, A., Xueref-Remy, I.,
30
ACPD
10, 29631–29682, 2010SO2 and BrO in Eyjafjallaj ¨okull’s
plume
K.-P. Heue et al.
Title Page
Abstract Introduction
Conclusions References
Tables Figures
◭ ◮
◭ ◮
Back Close
Full Screen / Esc
Printer-friendly Version
Interactive Discussion
Discussion
P
a
per
|
Dis
cussion
P
a
per
|
Discussion
P
a
per
|
Discussio
n
P
a
per
|
Phys., 7, 4953–4976, doi:10.5194/acp-7-4953-2007, 2007. 29634, 29647, 29648
Bussemer, M.: Der Ring-Effekt: Ursachen und Einfluß auf die Messung stratosph ¨arischer Spurenstoffe, diploma thesis, University of Heidelberg, Germany, 1993. 29640, 29641, 29642
Carn, S. A., Krueger, A. J., Krotkov, N. A., Yang, K., and Evans, K.: Tracking volcanic sulfur
diox-5
ide clouds for aviation hazard mitigation, Nat. Hazards, 51, 325–343, doi:10.1007/s11069-008-9228-4, 2009. 29634
Deutschmann, T.: Atmospheric Radiative Transfer Modelling with Monte Carlo Methods, diploma thesis, University of Heidelberg, Germany, 2009. 29638, 29643
Dix, B., Brenninkmeijer, C. A. M., Frieß, U., Wagner, T., and Platt, U.: Airborne multi-axis DOAS
10
measurements of atmospheric trace gases on CARIBIC long-distance flights, Atmos. Meas. Tech., 2, 639–652, doi:10.5194/amt-2-639-2009, 2009. 29637
Dyroff, C., F ¨utterer, D., and Zahn, A.: Compact diode-laser spectrometer ISOWAT for highly sensitive airborne measurements of water-isotope ratios, Appl. Phys. B-Lasers O., 98(2–3), 537–548, doi:10.1007/s00340-009-3775-6, 2010. 29636
15
Flentje, H., Claude, H., Elste, T., Gilge, S., K ¨ohler, U., Plass-D ¨ulmer, C., Steinbrecht, W., Thomas, W., Werner, A., and Fricke, W.: The Eyjafjallaj ¨okull eruption in April 2010 – de-tection of volcanic plume using in-situ measurements, ozone sondes and lidar-ceilometer profiles, Atmos. Chem. Phys., 10, 10085–10092, doi:10.5194/acp-10-10085-2010, 2010. 29634, 29647
20
Frieß, U., Monks, P. S., Remedios, J. J., Rozanov, A., Sinreich, R., Wagner, T., and Platt, U.: MAX-DOAS O4 measurements: a new technique to derive information on atmospheric aerosols: 2. Modelling studies, J. Geophys. Res., 111, D14203, doi:10.1029/2005JD006618, 2006. 29645
von Glasow, R.: Atmospheric chemistry in volcanic plumes, P. Natl. Acad. Sci. USA, 107, 15,
25
6594–6599, doi:10.1073/pnas.0913164107, 2010. 29647, 29650
von Glasow, R., Bobrowski, N., and Kern, C.: The effects of volcanic eruptions on atmospheric chemistry, Chem. Geol., 263, 131–142, doi:10.1016/j.chemgeo.2008.08.020, 2009. 29634 Grainger, J. and Ring, J.: Anomalous Fraunhofer line profiles, Nature, 193, 762, 1962. 29640 Greenblatt, G. D., Orlando, J. J., Burkholder, J. B., and Ravishankara, A. R.: Absorption
mea-30
surements of oxygen between 330 and 1140 nm, J. Geophys. Res., 95, 18577–18582, 1990. 29639, 29642