www.adv-geosci.net/32/85/2012/ doi:10.5194/adgeo-32-85-2012
© Author(s) 2012. CC Attribution 3.0 License.
Geosciences
A modeling framework to assess water and nitrate balances in the
Western Bug river basin, Ukraine
F. Tavares Wahren1, B. Helm2, F. Schumacher1, T. Pluntke3, K.-H. Feger1, and K. Schw¨arzel1
1Institute of Soil Science & Site Ecology, Dresden University of Technology, Germany 2Institute for Urban Water Management, Dresden University of Technology, Germany 3Institute of Hydrology and Meteorology, Dresden University of Technology, Germany
Correspondence to:F. Tavares Wahren ([email protected])
Received: 31 January 2012 – Revised: 13 July 2012 – Accepted: 17 October 2012 – Published: 20 December 2012
Abstract.The objective of this study was to assess the utility of the eco-hydrological SWAT model (Soil and Water As-sessment Tool, Arnold et al., 1998) for representing water balance and nitrate fluxes given limited input and calibra-tion data. The investigated catchment is located in Western Ukraine with an area of approximately 2616 km2. Land use is currently dominated by agriculture with significant areas of pasture, and has undergone a high degree of changes in land-use and agricultural practice since the end of the Soviet Union. Model application produced a fitted water balance (calibration: R2=0.52, NS = 0.46; validation: R2=0.47,
NS = 0.51) and plausible ranges and dynamics of nitrate in stream loadings. Groundwater parameters were found to be highly sensitive. The results indicate that SWAT is an appro-priate tool for water resource investigations in the Western Bug catchment, and can provide a useful tool for further eco-hydrologic research in the region (i.e. diffuse pollution im-pacts).
1 Introduction
The aim of the Water Framework Directive is to achieve clean water across the European Union. Under this direc-tive, water management is based on river basins (rather than administrative boundaries), and as a result some watersheds covered by the Directive are partially contained within non-EU countries. The Western Bug basin located between the north-western part of Ukraine, south-western Belarus and the central eastern part of Poland is an example of one of these cross-border watersheds. The Western Bug is the second largest tributary of the Vistula which empties into the Baltic
The overall aim of our working group was to assess how pollution from diffuse sources has impacted water quality in the Western Bug catchment by means of spatially distributed water and matter modeling. The objective of this study is to assess the applicability of the eco-hydrological model SWAT for representing water balance and nitrate fluxes given lim-ited input and calibration data.
2 Methods and material
2.1 Study site
The total area of the Western Bug river basin is 39 400 km2, which is 19.3 % of the Vistula basin. The total length of the river is 755 km, of which 184 km are located on Ukrainian territory and further 185 km mark the border be-tween Ukraine and Poland (TACIS, 2001). In our work we focus on the Ukrainian portion of the Bug river basin until the Dobrotvir Reservoir. Therefore, we denominated the wa-tershed in focus of Dobrotvir catchment area. The study area (Fig. 1), covering about 2616 km2, is predominantly a rolling plain with elevations between 200–250 m, which has a hilly topography and elevations of 300–400 m at its western and southern periphery (Schanze et al., 2012), a temperate con-tinental climate with an average precipitation of 800 mm per year and an average temperature of 7.1◦
C. Highly cracked and karsted limestone, marls and loess from the Upper Cre-taceous form the hydrogeological structure of the Dobrotvir catchment (Terekhanova, 2009).
Due to the presence of fertile soils, this area underwent large scale deforestation and replacement of forests with agricultural activities currently occupying approximately half of the catchment’s area (Tavares Wahren et al., 2012). There is one important tributary in the eastern section of the watershed, the Poltva, which flows through L’viv, the largest city in the Bug catchment with a population of approximately 750 000. Within the study area, nutrients enter the river sys-tems from agricultural activities and from obsolete or over-loaded waste water treatment plants (WWTPs) which im-pairs surface water quality. In contrast to the poor water qual-ity status, the river’s hydromorphology is primarily of good quality for large stretches (Zingstra, et al., 2009; Ertel et al., 2012; Scheifhacken et al., 2012).
2.2 Data availability and time period
Lack of data availability and poor data reliability are ma-jor issues confronting environmental research in the Ukraine (Blumensaat et al., 2012; Tavares Wahren et al., 2012). In our previous work (Tavares Wahren et al., 2012) we dealt with data limitations due to limited spatially distributed soil information by applying a fuzzy-logic mode to predict soil spatial attributes. In this research paper we continue to ad-dress data limitation issues by evaluating the data adequacy
Fig. 1.Dobrotvir catchment study area in Western Ukraine, meteo-rological stations location and watershed delineation.
for representation of diffuse pollution sources and to analyze the feasibility of future efforts.
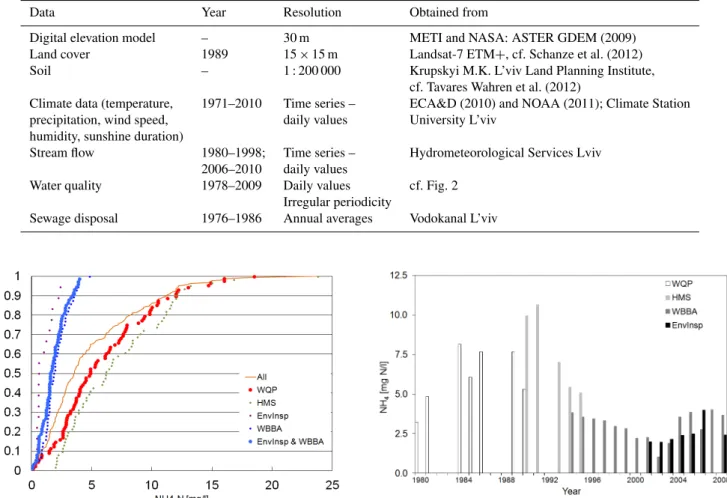
A common constraint to model development and veri-fication is that water quality and discharge data are often not simultaneously collected at a temporal/spatial resolution which is useful for analysis. This situation was the case for this study; with only the monitoring point Kamianka-Buzka having both daily discharge measurements and water qual-ity measurements available. A further limitation is that the water quality measurements were conducted from only once per month to once per quarter year. Further, there were four different institutions responsible for the monitoring of wa-ter quality throughout the period from 1978 to 2009. As an example for the recorded data, the empirical distribution function of ammonium based on different measurement cam-paigns during 1978 to 2009 is shown in Fig. 2. It is therefore unclear how much of the observed temporal dynamics in wa-ter quality is due to changes in land-use and system dynamics caused by the political turnover, and how much is due to the measurement technique of each institution. Table 1 presents the input data used by the model in the Dobrotvir catchment. Further constrains to the modeling process are due to that the presence of only one precipitation station within the study area, and by the lack of information available regarding to the karst aquifer underneath our catchment.
Table 1.Overview of input data for hydrological and nutrient modeling.
Data Year Resolution Obtained from
Digital elevation model – 30 m METI and NASA: ASTER GDEM (2009)
Land cover 1989 15×15 m Landsat-7 ETM+, cf. Schanze et al. (2012)
Soil – 1 : 200 000 Krupskyi M.K. L’viv Land Planning Institute,
cf. Tavares Wahren et al. (2012)
Climate data (temperature, 1971–2010 Time series – ECA&D (2010) and NOAA (2011); Climate Station precipitation, wind speed, daily values University L’viv
humidity, sunshine duration)
Stream flow 1980–1998; Time series – Hydrometeorological Services Lviv 2006–2010 daily values
Water quality 1978–2009 Daily values cf. Fig. 2 Irregular periodicity
Sewage disposal 1976–1986 Annual averages Vodokanal L’viv
Fig. 2. Empirical distribution function of ammonium daily measurements for the different monitoring campaigns. Legend: WQP = Water Quality Project (monitoring campaign: 1980–1990); HMS = Hydro- Meteorological Services (monitoring campaign: 1990–1995); WBBA = Western Bug Basin Authority (monitoring campaign: 1994–2008) and EnvInsp = Environmental Inspectorate (monitoring campaign: 2001–2008).
was almost entirely eliminated, and the extensive slaugh-tering of livestock reduced the amount of available manure (Stalnacke et al., 2003). These changes are representative of the agricultural dynamics observed in many other eastern Eu-ropean countries undergoing similar transitions during this time period (Mander et al., 2000; Pekarova and Pekar, 1996). Similar changes also occurred in the former German Demo-cratic Republic, as the reunification of Germany led to fun-damental structural changes in agriculture (Meissner et al., 1998). These studies show that the changes brought about by the political turnover inevitably affected the nutrient export to water bodies. Similar changes can be seen in the Ukraine, such as in the Dobrotvir catchment, where a rapid improve-ment in water quality can be observed after 1993 (Fig. 3). In more recent years the continued reorganization of agriculture
Fig. 3. Water quality improvement after the political turnover. The example of ammonium concentration year average at the Kamianka-Buzka outlet. Different monitoring campaigns. Leg-end: WQP = Water Quality Project; HMS = Hydro- Meteorolog-ical Services; WBBA = Western Bug Basin Authority and En-vInsp = Environmental Inspectorate.
has led to increased fertilizer usage and therefore to higher nutrient concentrations. Since significant changes in nutrient fluxes occur after 1991 with the collapse of organized agri-culture, we chose to perform model calibration and validation for the period until the dissolution of the Soviet Union, from 1980 to 1985 and from 1986 to 1990 respectively. Therefore, the modeling work here presented focuses on the period 1980 to 1990.
2.3 Eco-hydrological model setup and calibration
Fig. 4.Comparison of 3 model runs during the calibration pro-cess: default values for the parameters SLSOIL and DEP IMP; DEP IMP = 1500 (mm) and DEP IMP = 150 (mm) + SLSOIL = 20 (m). DEP IMP = Depth of impervious layer for perched water tables in mm; SLSOIL = Slope length for lateral subsurface flow in m.
of weather, hydrology, soil temperature, plant growth, nutri-ents, pesticides, land management, bacteria and pathogens (Arnold et al., 1998; Neitsch et al., 2005; Gassman et al., 2007). The majority of soil management practices can be simulated in SWAT through direct changes in parameter val-ues (Ulrich and Volk, 2009). Many studies have used SWAT to assess the effects of land use change and management practices (Shanti et al., 2001; Ulrich and Volk, 2009; Lam et al., 2010). SWAT monitors five different pools of nitro-gen in soils: two inorganic (ammonium, NH+4, and nitrate, NO−
3) and three organic; fresh organic nitrogen associated
with crop residue and microbial biomass, and active and stable organic nitrogen associated with soil humus (Ulrich and Volk, 2009). Nitrogen is added to the soil through fer-tilizer, manure or residue application, fixation by bacteria, and precipitation (Neitsch et al., 2002). Nitrogen losses oc-cur through plant uptake, transport with surface runoff, lat-eral flow, percolation and with eroded sediment (Neitsch et al., 2002; Ulrich and Volk, 2009). In this study, we applied ArcSWAT version 2009.93.7b in the ArcGIS (version 9.3) environment.
The Dobrotvir catchment was divided into 20 sub-basins, and calibration and validation of the water balance was con-ducted using data from the gauge at Kamianka-Buzka. For the period until 1991, we assumed a traditional agricul-tural management scheme; including corn silage, wheat, bar-ley, sugar beet and potato cultivation. Conventional plough tillage and disk bedder operations were applied. Both daily fresh and mineral fertilizers were applied to the agricul-tural field according to the approach of Pospelova (1997), Pospelova and Schinke (1997) and von Cramon-Taubadel and Striewe (1999).
Fig. 5. (a)Comparison of daily observed and simulated discharge during the calibration (1980–1985) in the Dobrotvir catchment area at the gauge Kamianka-Buzka (R2=0.52, NS = 0.46).(b) Compar-ison of daily observed and simulated discharge during the validation period (1986–1990) in the Dobrotvir catchment area at the gauge Kamianka-Buzka (R2=0.47, NS = 0.51).
As in other groundwater-influenced lowland regions, drainage systems are important landscape features, which have a major impact on hydrological flow pathways (Stone and Krishnappan, 2002). Kiesel et al. (2010) show the im-portance of taking such systems in hydrological modeling by comparing how flow components were affected through the incorporation of drainage in the model setup. Drainage system distributions in the study catchment were analyzed by Terekhanova (2009). Based on this spatial distribution, drainage systems were applied to all agricultural and pasture land-use classes.
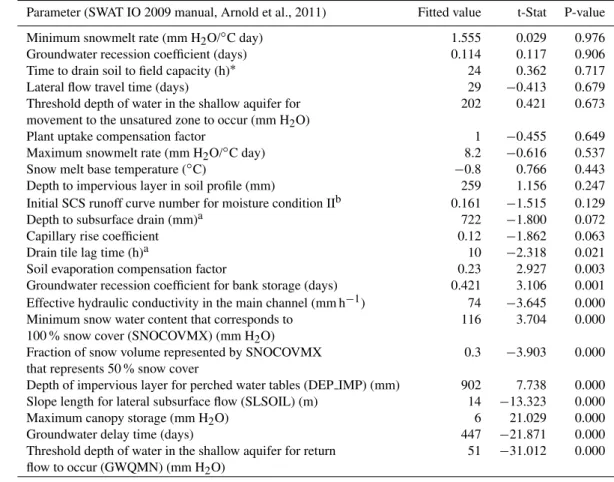
Table 2.SWAT parameters used for calibration, fitted values and sensitivity statistics (downward sensitivity increase).
Parameter (SWAT IO 2009 manual, Arnold et al., 2011) Fitted value t-Stat P-value
Minimum snowmelt rate (mm H2O/◦C day) 1.555 0.029 0.976
Groundwater recession coefficient (days) 0.114 0.117 0.906
Time to drain soil to field capacity (h)∗ 24 0.362 0.717
Lateral flow travel time (days) 29 −0.413 0.679
Threshold depth of water in the shallow aquifer for 202 0.421 0.673 movement to the unsatured zone to occur (mm H2O)
Plant uptake compensation factor 1 −0.455 0.649
Maximum snowmelt rate (mm H2O/◦C day) 8.2 −0.616 0.537
Snow melt base temperature (◦C) −0.8 0.766 0.443
Depth to impervious layer in soil profile (mm) 259 1.156 0.247 Initial SCS runoff curve number for moisture condition IIb 0.161 −1.515 0.129
Depth to subsurface drain (mm)a 722 −1.800 0.072
Capillary rise coefficient 0.12 −1.862 0.063
Drain tile lag time (h)a 10 −2.318 0.021
Soil evaporation compensation factor 0.23 2.927 0.003
Groundwater recession coefficient for bank storage (days) 0.421 3.106 0.001 Effective hydraulic conductivity in the main channel (mm h−1) 74 −3.645 0.000
Minimum snow water content that corresponds to 116 3.704 0.000 100 % snow cover (SNOCOVMX) (mm H2O)
Fraction of snow volume represented by SNOCOVMX 0.3 −3.903 0.000 that represents 50 % snow cover
Depth of impervious layer for perched water tables (DEP IMP) (mm) 902 7.738 0.000 Slope length for lateral subsurface flow (SLSOIL) (m) 14 −13.323 0.000
Maximum canopy storage (mm H2O) 6 21.029 0.000
Groundwater delay time (days) 447 −21.871 0.000
Threshold depth of water in the shallow aquifer for return 51 −31.012 0.000 flow to occur (GWQMN) (mm H2O)
aOnly applied to drained HRU’s.bInitial parameter value is multiplied by (1+a given value) (Abbaspour, 2007).
the catchment. However, introduction of only the existing WWTPs is not adequate to represent human pollution since a large part of the population is not connected to the WWTP network. Therefore, a virtual fertilizer application to urban areas which do not surround the WWTPs was carried out.
The Sequential Uncertainty Fitting, ver. 2 (SUFI-2) proce-dure of Abbaspour (2007) was used for calibration and sen-sitivity analysis, which has been shown by numerous stud-ies to be an efficient method for watershed model calibra-tion (Abbaspour et al., 2007; Schuol et al., 2008; Faramarzi et al., 2009). For the auto-calibration process the parame-ters listed in Table 2 were included based on the sensitivity analysis. The t-stat value provides a measure of sensitivity whereas the P-value determines the significance of the sen-sitivity (Abbaspour, 2007). Value ranges for the selected pa-rameters were based on field surveys (e.g. Tavares Wahren et al., 2012), local expert knowledge, and literature review (e.g. Spruill et al., 2000; Terekhanova, 2009; Ulrich and Volk, 2009).
3 Results
3.1 Parameterization and sensitivity analysis
Fig. 6.Autocorrelation Function (ACF) of daily observed and sim-ulated discharge values, during the calibration period 1980 to 1985, for the gauge Kamianka-Buzka, Dobrotvir catchment area, for a time lag of(a)30 days and(b)550 days. Dashed lines depict the 95 % confidence intervals.
for lateral subsurface flow in m” (SLSOIL). Inclusion of these parameters allows for representation of a perched wa-ter table which enables the regulation of wawa-ter percolating out of the soil profile. The default parameterization of SWAT assumes slope length for lateral subsurface flow to be equal to the average sub-basin slope length; however several stud-ies have shown the importance of adequately parameterizing slope length (e.g. Spruill et al., 2000; Lenhart et al., 2002). Therefore the SLSOIL parameter was further adjusted in this study, producing a more reliable base and interflow simula-tion, and resulting in a better estimation of vertical and lateral soil flow.
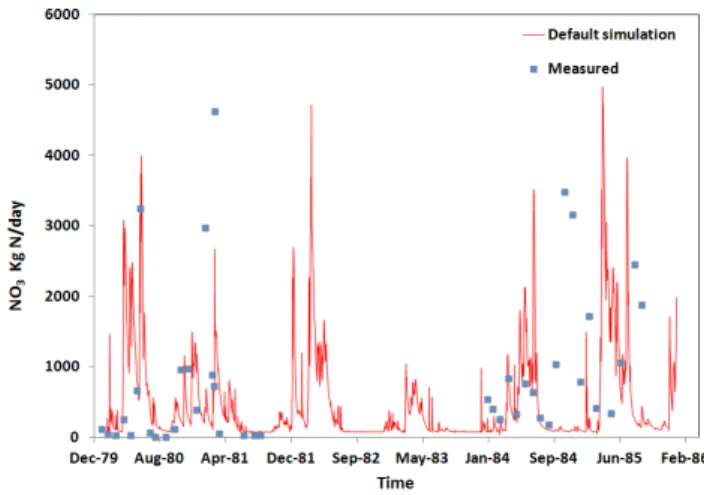
Fig. 7.Comparison of measured and modeled daily nitrate loads at the Dobrotvir catchment at the gauge Kamianka-Buzka during the calibration period 1980 to 1985.
3.2 Calibration and validation of water balance
In Table 2 the calibrated parameters and their optimized val-ues are listed. Ultimately 23 different water balance related parameters were subject to calibration. Figure 5a and b show the results of calibration and validation respectively. Both Nash-Sutcliffe Index (NS) and Coefficient of Determination (R2) for the calibration (NS = 0.46, R2=0.52) and
valida-tion (NS = 0.51,R2=0.47) periods indicate a reasonable fit
of the water balance. The relatively low NS andR2might be
behavior is the presence of a hydrologic system with a very large storage component, which is consistent with previous findings of high long-term ACF in a karst system by Fiorillo and Doglioni (2010). Nevertheless, further work is needed in order to investigate possible influencing factors.
3.3 Nutrient export simulation
Figure 7 shows the initial modeling results for in-stream ni-trate loading, which indicates reasonable model output both in terms of simulated load range and temporal dynamics. However, the limited amount of observed nutrient data makes application of an objective function to the simulation output infeasible. In order to further verify the simulation outputs, nitrate percolation and humus mineralization processes is the target of subsequent investigation. To bridge the gap brought by the data scarcity, nutrient exports will be studied by means of a simple mass balance approach.
4 Conclusions and outlook
In this study, the SWAT model was successfully fitted to simulate runoff in the Dobrotvir catchment area. The dom-inating hydrological processes were found to be mainly con-trolled by groundwater dynamics and lateral subsurface flow, and as a result, groundwater parameters were found to be highly sensitive. Two important modifications in SWAT setup for improving model performance were the implementation of an impervious layer within the soil profile to simulate perched water tables, and specification at the HRU level of a slope length for lateral subsurface flow. Model calibration was complicated in this study by the limited amount of avail-able precipitation data, and by the hydrogeological character-istics of the watershed (i.e. karst aquifer). To address the first point, an improved rainfall dataset will be tested in the fol-lowing study. The initial nitrate simulations presented in this study show plausible load ranges and dynamics. However, further investigations on matter balance will be needed in or-der to adequately evaluate nutrient entry pathways into sur-face waters from diffuse sources. Overall, the findings of this study indicate that SWAT has potential to provide a base for assessing how diffused pollution impacts the Western Bug catchment.
Acknowledgements. This work was supported by funding from the Federal Ministry for Education and Research (BMBF) in the framework of the project “IWAS – International Water Re-search Alliance Saxony” (grant 2WM1028). This work was co-funded by and POPH/FSE (Programa Operacional Potencial Hu-mano/Fundo Social Europeu, EC), and by FCT (Fundac¸˜ao para a Ciˆencia e a Tecnologia, Portugal) in the form of the fellow-ship SFRH/BD/61451/2009. We also would like to thank the the several institutions which provided data for our research: Hydro-Meteorological Services Lviv; Western Bug Basin Authority, Envi-ronmental Inspectorate Lviv and Lviv Ivan Franko National Univer-sity.
Edited by: K. Schneider and S. Achleitner Reviewed by: two anonymous referees
References
Abbaspour, K. C.: User Manual for SWAT-CUP SWAT Cal-ibration and Uncertainty Analysis Programs, Swiss Fed-eral Institute of Aquatic Science and Technology, Eawag, D¨ubendorf, Switzerland, available at: http://www.eawag.ch/ organisation/abteilungen/siam/software/swat/indexEN (last ac-cess: January 2010), 2007.
Abbaspour, K. C., Yang, J., Maximov, I., Siber, R., Bogner, K., Mieleitner, J., Zobrist, J., and Srinivasan, R.: Modelling hydrol-ogy and water quality in the prealpine/alpine Thur watershed us-ing SWAT, J. Hydrol., 333, 413–430, 2007.
Arnold, J. G., Srinivasan, R., Muttiah, R. S., and Williams, J. R.: Large area hydrologic modeling and assessment – Part 1. Model development, J. Am. Water Resour. As., 34, 73–89, 1998. Arnold, J. G., Kiniry, J. R., Srinivasan, R., Williams, J. R., Haney,
E. B., and Neitsch, S. L.: Soil and Water Assessment Tool In-put/Output Documentation Version 2009, Texas Water Resources Institute Technical Report No. 365, 2011.
Blumensaat, F., Wolfram, M., and Krebs, P.: Sewer model develop-ment under minimum data requiredevelop-ments, Environ. Earth Sci., 65, 1427–1437, doi:10.1007/s12665-011-1146-1, 2012.
ECA&D: available at: http://eca.knmi.nl/, last access: Novem-ber 2010.
Eckhardt, K., Haverkamp, S., Fohrer, N., and Frede, H.-G.: SWAT-G, a version of SWAT99.2 modified for application to low moun-tain range catchments, Phys. Chem. Earth, 27, 641–644, 2002. Ertel, A.-M., Lupo, A., Scheifhacken, N., Bodnarchuk, T.,
Mantur-ova, O., Berendonk, T. U., and Petzoldt, T,: Heavy load and high potential: anthropogenic pressures and their impacts on the wa-ter quality along a lowland river (Weswa-tern Bug, Ukraine), Envi-ron. Earth Sci., 65, 1459–1473, doi:10.1007/s12665-011-1289-0, 2012.
Faramarzi, M., Abbaspour, K. C., Schulin, R., and Yang, H.: Mod-elling blue and green water resources availability in Iran, Hydrol. Process., 23, 486–501, 2009.
Fiorillo, F. and Doglioni, A.: The relation between karst spring discharge and rainfall by cross-correlation analysis (Campania, southern Italy), Hydrogeol. J., 18, 1881–1895, 2010.
Gassman, P. W., Reyes, M. R., Green, C. H., and Arnold, J. G.: The soil and water assessment tool historical development, applica-tions, and future research direcapplica-tions, T. ASABE, 50, 1211–1250, 2007.
Holvoet, K., van Griensven, A., Seuntjens, P., and Vanrolleghem, P. A.: Sensitivity analysis for hydrology and pesticide supply to-wards the river in SWAT, Phys. Chem. Earth, 30, 518–526, 2005. Inamdar, S. and Naumov, A.: Assessment of Sediment Yields for a Mixed-landuse Great Lakes Watershed: Lessons from Field Measurements and Modeling, J. Great Lakes Res., 32, 471–488, 2006.
Kiesel, J., Fohrer, N., Schmalz, B., and White, M. J.: Incorporating landscape depressions and tile drainages of lowland catchments into spatially distributed hydrologic modelling, Hydrol. Process., 24, 1472–1486, 2010.
Kirsch, K., Kirsch, A., and Arnold, J. G.: Predicting Sediment and Phosphorus Loads in the Rock River Basin Using SWAT, T. ASAE, 45, 1757–1769, 2002.
Lam, Q. D., Schmalz, B., and Fohrer, N.: Modelling point and dif-fuse source pollution of nitrate in a rural lowland catchment using the SWAT model, Agr. Water Manage., 97, 317–325, 2010. Lenhart, T., Eckhardt, K., Fohrer, N., and Frede, H.-G.: Comparison
of two different approaches of sensitivity analysis, Phys. Chem. Earth, 27, 645–654, 2002.
Mander, U., Kull, A., Kuusemets, V., and Tamm, T.: Nutrient runoff dynamics in a rural catchment: influence of land-use changes, climatic fluctuations and ecotechnological measures, Ecol. Eng., 14, 405–417, 2000.
Meissner, R., Seeger, J., and Rupp, H.: Lysimeter studies in East Germany concerning the influence of set aside of intensively farmed land on the seepage water quality, Agr. Ecosyst. Envi-ron., 67, 161–173, 1998.
METI, NASA: ASTER Global DEM – Start distribution, 2009. Neitsch, S. L., Arnold, J. G., Kiniry, J. R., Srinivasan, R., and
Williams, J. R.: Soil and Water Assessment Tool. User’s Manual, Version 2005, GSWRL Report 02-02, BRC Report 2-06, Temple, Texas, USA, 2002.
Neitsch, S. L., Arnold, J. G., Kiniry, J. R., Williams, J. R., and King, K. W.: Soil and water assessment tool, in: Theoretical Documen-tation: Version 2005, TWRI TR-191, 2005.
NOAA: Climate data online: Daily observational data, available at: http://gis.ncdc.noaa.gov/map/cdo/, last access: November 2011. Pekarova, P. and Pekar, J.: The impact of land use on stream water
quality in Slovakia, J. Hydrol., 180, 333–350, 1996.
Pospelova, G.: Anbau und Z¨uchtung von Weizen in der Ukraine, Giessener Abhandlungen zur Agrar- und Wirtschaftsforschung des europ¨aischen Ostens, Band 218, Osteuropastudien der Hochschulen des Landes Hessen, Reihe I, Duncker & Humblot, Berlin, 1997.
Pospelova, G. and Schinke, E.: Anbau und Verarbeitung von Zuck-err¨uben in der Ukraine, Giessener Abhandlungen zur Agrar-und Wirtschaftsforschung des europ¨aischen Ostens Band 221, Osteuropatsuiden der Hochschule des Landes Hessen, Reihe I, Duncker & Humboldt, Berlin, 1997.
Schanze, J., Tr¨umper, J., Burmeister, C., Pavlik, D., and Kruglov, I.: A methodology for dealing with regional change in integrated water resource management, Environ. Earth Sci., 65, 1405–1414, doi:10.1007/s12665-011-1311-6, 2012.
Scheifhacken, N., Haase, U., Gram-Radu, L., Kozovyi, R., and Berendonk, T. U.: How to assess hydromorphology? A compar-ison of Ukrainian and German approaches, Environ. Earth Sci., 65, 1483–1499, doi:10.1007/s12665-011-1218-2, 2012. Schmalz, B. and Fohrer, N.: Comparing model sensitivities of
dif-ferent landscapes using the ecohydrological SWAT model, Adv. Geosci., 21, 91–98, doi:10.5194/adgeo-21-91-2009, 2009.
Schuol, J., Abbaspour, K. C., Srinivasan, R., and Yang, H.: Estima-tion of freshwater availability in the West African sub-continent using the SWAT hydrologic model, J. Hydrol., 352, 30–49, 2008. Shanti, C., Arnold, J., Williams, J., Hauck, L., and Dugas, W.: Ap-plication of a watershed model to evaluate management effects on point and non-point source pollution, T. ASAE, 44, 1559– 1570, 2001.
Spruill, C. A., Workman, S. R., and Taraba, J. L.: Simulation of daily and monthly stream discharge from small watersheds using the SWAT model, T. ASAE, 43, 1431–1439, 2000.
Stalnacke, P., Grimvall, A., Libiseller, C., Laznik, M., and Koko-rite, I.: Trends in nutrient concentrations in Latvian rivers and the response to the dramatic change in agriculture, J. Hydrol., 283, 184–205, 2003.
Stone, M. and Krishnappan, B. G.: The effect of irrigation on tile sediment transport in a headwater stream, Water Res., 36, 3439– 3448, 2002.
Strauch, M., Bernhofer, C., Koide, S., Volk, M., Lorz, C., and Makeschin, F.: Using precipitation data ensemble for uncertainty analysis in SWAT streamflow simulation, J. Hydrol., 414–415, 413–424, 2012.
Szolgayov´a, E., Bl¨oschl, G., and Bucher, C.: Factors influencing long range dependence in stream flow of European rivers, Geo-phys. Res. Abstr., EGU2012-10776, EGU General Assembly 2012, Vienna, Austria, 2012.
TACIS: Transboundary Water Quality Monitoring and Assessment: Bug and Latorica/Uzh Kyiv, TACIS, 2001.
Tavares Wahren, F., Tarasiuk, M., Mykhnovych, A., Kit, M., Feger, K. H., and Schw¨arzel, K.: Estimation of spatially distributed soil information, Dealing with data shortages in the West-ern Bug Basin, Ukraine, Environ. Earth Sci., 65, 1501–1510, doi:10.1007/s12665-011-1197-3, 2012.
Terekhanova, T.: Quantification of water and nutrient flows on a river catchment under scarce data conditions – A case study of Western Bug river basin, Ukraine, MSc Thesis, Intitute of Urban Water Management, TU Dresden, Germany, 2009.
Ulrich, A. and Volk, M.: Application of the Soil and Water Assess-ment Tool (SWAT) to predict the impact of alternative manage-ment practices on water quality and quantity, Agr. Water Man-age., 96, 1207–1217, 2009.
Venables, W. N. and Ripley, B. D.: Modern Applied Statistics with S. Fourth Edition, Springer-Verlag, 2002.
von Cramon-Taubadel, S. and Striewe, L.: Die Transformation der Landwirtschaft in der Ukraine – Ein weites Feld , Kiel, Wiss.-Verl. Vauk. Agrar¨okonomische Monographien und Sammelw-erke, 1999.