ACPD
12, 27555–27588, 2012The spatial scale of ozone depletion
events
A. E. Jones et al.
Title Page
Abstract Introduction
Conclusions References
Tables Figures
◭ ◮
◭ ◮
Back Close
Full Screen / Esc
Printer-friendly Version Interactive Discussion
Discussion
P
a
per
|
Dis
cussion
P
a
per
|
Discussion
P
a
per
|
Discussio
n
P
a
per
|
Atmos. Chem. Phys. Discuss., 12, 27555–27588, 2012 www.atmos-chem-phys-discuss.net/12/27555/2012/ doi:10.5194/acpd-12-27555-2012
© Author(s) 2012. CC Attribution 3.0 License.
Atmospheric Chemistry and Physics Discussions
This discussion paper is/has been under review for the journal Atmospheric Chemistry and Physics (ACP). Please refer to the corresponding final paper in ACP if available.
The spatial scale of ozone depletion
events derived from an autonomous
surface ozone network in coastal
Antarctica
A. E. Jones1, E. W. Wolff1, N. Brough1, S. J.-B. Bauguitte1,*, R. Weller2, M. Yela3, M. Navarro-Comas3, H. A. Ochoa4, and N. Theys5
1
British Antarctic Survey, Natural Environment Research Council, Cambridge, UK
2
Alfred Wegener Institute, Bremerhaven, Germany
3
INTA, ´Area de Investigaci ´on e Instrumentaci ´on Atmosf ´erica,Torrej ´on de Ardoz, Spain
4
Direcci ´on Nacional del Ant ´artico /Instituto Ant ´artico Argentino (DNA/IAA), Buenos Aires, Argentina
5
Belgian Institute of Spatial Aeronomy (IASB-BIRA), Bruxelles, Belgium
*
ACPD
12, 27555–27588, 2012The spatial scale of ozone depletion
events
A. E. Jones et al.
Title Page
Abstract Introduction
Conclusions References
Tables Figures
◭ ◮
◭ ◮
Back Close
Full Screen / Esc
Printer-friendly Version Interactive Discussion
Discussion
P
a
per
|
Dis
cussion
P
a
per
|
Discussion
P
a
per
|
Discussio
n
P
a
per
Received: 3 September 2012 – Accepted: 14 October 2012 – Published: 19 October 2012
Correspondence to: A. E. Jones (aejo@bas.ac.uk)
ACPD
12, 27555–27588, 2012The spatial scale of ozone depletion
events
A. E. Jones et al.
Title Page
Abstract Introduction
Conclusions References
Tables Figures
◭ ◮
◭ ◮
Back Close
Full Screen / Esc
Printer-friendly Version Interactive Discussion
Discussion
P
a
per
|
Dis
cussion
P
a
per
|
Discussion
P
a
per
|
Discussio
n
P
a
per
|
Abstract
To probe the spatial extent of tropospheric ozone depletion events during Antarctic spring, a network of 10 autonomous ozone monitors was established around the Dron-ning Maud Land sector of Antarctica for a full calendar year. Together with manned stations in the area, the network covered a∼1200 km stretch of coast, as well as a
5
transect∼300 km inland and to∼2000 m above sea level (a.s.l.). Here we present re-sults from the spring period (August to October 2008). While some ozone depletion events were evident at only a single site, implying localised ozone destruction, others were evident across the network. The fact that, on occasions, ozone depletion events were observed at all coastal sites simultaneously, suggests the depleted air mass had
10
a scale of at least 1200 km. As the ozone-poor air was advected from the Weddell Sea sea ice zone, the data imply that large areas over the Weddell Sea sea ice zone are significantly depleted in ozone on occasions during Antarctic spring.
1 Introduction
Ozone is a critical component of tropospheric chemistry. It is a highly reactive oxidant,
15
and the primary source of hydroxyl radicals to the troposphere. Through its capacity to absorb infra-red radiation, it influences the radiative balance of the atmosphere, a role that becomes progressively more important towards altitudes of the tropopause (Lacis et al., 1990).
In polar regions, surface ozone is observed from a number of manned stations
20
around the coastal perimeters as well as at a few inland stations. At all coastal sites, to a greater or lesser extent, the otherwise smoothly-varying seasonal cycle displays sporadic departures from background values during the spring months (Helmig et al., 2007). Referred to widely as tropospheric ozone depletion events (ODEs), these depar-tures are characterised by a reduction in ozone from background concentrations,
some-25
ACPD
12, 27555–27588, 2012The spatial scale of ozone depletion
events
A. E. Jones et al.
Title Page
Abstract Introduction
Conclusions References
Tables Figures
◭ ◮
◭ ◮
Back Close
Full Screen / Esc
Printer-friendly Version Interactive Discussion
Discussion
P
a
per
|
Dis
cussion
P
a
per
|
Discussion
P
a
per
|
Discussio
n
P
a
per
for on the order of h to a few days. The primary driver of ozone loss is destruction by bromine radicals via the reaction Br+O3→BrO+O2. Bromine monoxide (BrO) is thus a marker for ozone-depletion chemistry. While the source of bromine is known to be associated with the sea ice zone, emanating from the salinity available there, the pre-cise mechanism(s) of release are still under debate (e.g. McConnell et al., 1992; Vogt
5
et al., 1996; Frieß et al., 2004; Rankin et al., 2002; Kaleschke et al., 2004; Simpson et al., 2007a; Yang et al., 2008, 2010; Jones et al., 2009).
The spatial extent of ODEs, which ultimately determines their wider influence, is dif-ficult to pin down. Aircraft observations made during the Arctic Tropospheric Ozone Production about the Spring Equinox (TOPSE) programme revealed one depleted air
10
mass that stretched∼900 km along the flight track and another that was at least 600 km long (Ridley et al., 2003, 2007). These air masses were observed away from the sea ice zone, and were interpreted as having been transported from over the Arctic Ocean. The density and distribution of research stations measuring surface ozone, however, either in the Arctic or Antarctic, are insufficient to determine the size of depleted air
15
masses even in the coastal margins. Single-point observations from coastal stations can only address the time period over which air masses are depleted in ozone. They raise the question whether ODEs are relatively short-lived events that occur episodi-cally, or whether they are more sustained within the sea ice zone and are merely ob-served episodically when meteorological conditions bring ozone depleted air masses
20
to the observation point. Measurements from ice camps (Hopper et al., 1994, 1998), and from ships within the sea ice zone (Bottenheim et al., 2009; Jacobi et al., 2010) support the latter view. In particular, measurements made from the schooner “TARA” that drifted with the frozen Arctic Ocean, revealed sustained surface ozone depletion during spring that lasted on the order of weeks (Bottenheim et al., 2009). These
ob-25
servations suggest that vast areas over the Arctic Ocean are effectively void of ozone during the spring months.
ACPD
12, 27555–27588, 2012The spatial scale of ozone depletion
events
A. E. Jones et al.
Title Page
Abstract Introduction
Conclusions References
Tables Figures
◭ ◮
◭ ◮
Back Close
Full Screen / Esc
Printer-friendly Version Interactive Discussion
Discussion
P
a
per
|
Dis
cussion
P
a
per
|
Discussion
P
a
per
|
Discussio
n
P
a
per
|
enhancements in the vertical column density that extend over considerable areas (Richter et al., 1998; Simpson et al., 2007b). While a contribution to these “hotspots” of enhanced vertical column is likely to arise in the stratosphere, a significant compo-nent has been shown to exist in the troposphere (Wagner and Platt, 1998; Theys et al., 2009, 2011; Salawitch et al., 2010).
5
Such BrO enhancements are also evident over the Antarctic sea ice zone during the spring, suggesting that a similarly extensive depletion of tropospheric ozone most likely also occurs in the south. Manned aircraft flights over the springtime Antarctic sea ice zone are extremely rare due to the harsh environmental conditions and no instrumented flights have probed the extent of ozone depletion. While Unmanned Autonomous
Ve-10
hicles (UAVs) fitted with ozone sensors would be an option to probe air masses over the sea ice zone, such experiments remain to be done. Similarly, no equivalent to the TARA study has yet been conducted in Antarctica, and the recently-developed O-buoy system (Knepp et al., 2010) has thus far only been deployed in the Arctic.
As an alternative approach to assessing the spatial extent of Antarctic tropospheric
15
ozone depletion events, 10 autonomous ozone monitors were installed in 2008 around Dronning Maud Land (DML), Antarctica, that, together with data from nearby manned stations (Halley, Belgrano II (hereafter referred to as Belgrano) and Neumayer), would provide the potential to map the movement and size of ozone-depleted air masses over the region. The network extended along∼1200 km of the coastal perimeter, with
20
a transect running∼300 km up towards the polar plateau (to∼2000 m a.s.l.), and one site at sea level on an ice shelf but roughly 200 km inland. Data from the network thus allow us to address three questions: (i) What is the spatial extent of ODEs along the Weddell Sea coast? (ii) How far inland and to what altitudes do ODEs extend at the edge of the polar plateau? (iii) How far inland do ODEs extend across a flat ice shelf?
ACPD
12, 27555–27588, 2012The spatial scale of ozone depletion
events
A. E. Jones et al.
Title Page
Abstract Introduction
Conclusions References
Tables Figures
◭ ◮
◭ ◮
Back Close
Full Screen / Esc
Printer-friendly Version Interactive Discussion
Discussion
P
a
per
|
Dis
cussion
P
a
per
|
Discussion
P
a
per
|
Discussio
n
P
a
per
2 Experimental
A full description of the experimental approach (both site descriptions and instrumenta-tion) for the autonomous systems is given in an associated technical paper (Bauguitte et al., 2011), so only a brief summary is presented here.
2.1 Location and description of sites
5
Figure 1a shows a map of the experimental region, indicating the position of the au-tonomous sensors and the manned stations (Halley, Belgrano and Neumayer) that contributed data to the network. From Neumayer at the northernmost reaches to Site I in the south west there is a distance of roughly 1200 km as the crow flies. Site E is roughly 300 km from Site B on the coast and at an altitude of 2000 m, with Sites C
10
and D providing information on ozone at intermediate locations. The ozone monitor at Site F, at the head of the transect (2630 m a.s.l.) unfortunately did not return useful data during the spring. Sites I and J are both on the Filchner Ice Shelf, at roughly the same altitude, but with Site J 200 km further inland. Table 1 provides an overview of site details.
15
Figure 1b shows an AMSR-E (Spreen et al., 2008) map of sea ice for 7 October 2008, highlighting the extent and concentration of sea ice at this time of the year.
2.2 Technical/instrumentation
The autonomous sensor systems are based around a 2B Technologies Inc. Model 202 ozone monitor, which is a single channel UV photometric instrument that measures
20
ozone from its absorption band at 254 nm (Wilson and Birks, 2006). The instruments have a manufacturer specification of accuracy and precision for 1 min data of 1.5 parts per billion by volume (ppbv) or 2 % of reading once corrected for long-term drift, and a limit of detection of 3 ppbv. Power was provided for the monitors from AGM lead acid gel cell batteries which were charged from a vertical axis Forgen 500 wind turbine and
ACPD
12, 27555–27588, 2012The spatial scale of ozone depletion
events
A. E. Jones et al.
Title Page
Abstract Introduction
Conclusions References
Tables Figures
◭ ◮
◭ ◮
Back Close
Full Screen / Esc
Printer-friendly Version Interactive Discussion
Discussion
P
a
per
|
Dis
cussion
P
a
per
|
Discussion
P
a
per
|
Discussio
n
P
a
per
|
a 40 W Kyocera solar panel. The instrument duty cycle over the year was designed to give continuous sampling during spring, when fast changes in ozone concentrations were anticipated. While this was achieved for much of the spring at many sites, in-terruptions nonetheless occurred when charging was insufficient to maintain battery supply voltages above their threshold limit, and the systems temporarily switched offto
5
allow the batteries to recharge. Following such down times, the instruments required a short time for the signal to stabilise again.
Data were stored as 1 min averages of 10 s data, and in response to the required stabilisation, a first-pass filter that removed 3 data points was applied after every instru-ment down time. For the majority of the springtime data this was sufficient, but when
10
stabilisation took longer, additional points were removed (up to 10 on occasions). Both Halley and Belgrano station operated a Thermo Electron Model 49C dual-cell surface ozone analyser for which manufacturer-stated precision and limit of detection are both 1 ppbv. At Neumayer, surface ozone was measured using an Environnement s.a. O3 41 M, for which the accuracy is ±0.5 ppbv and the detection limit is better than
15
1 ppbv based on 1 min averages. At each station, regular zeros and span checks are performed.
All data presented here, for both the autonomous sites and manned stations, are 10 min averages.
3 Results and discussion
20
3.1 ODEs along the Weddell Sea/Dronning Maud Land coast
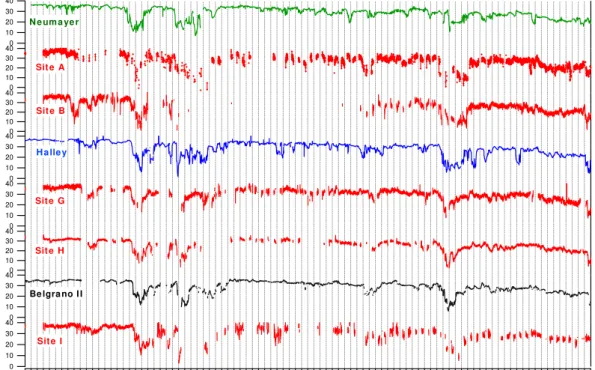
Figure 2 shows a time-series of surface ozone measurements from the autonomous sites and manned stations that operated along the coast of the Weddell Sea, during the austral spring period 1 August to 31 October 2008. While the data quality varies between locations, features in the data set are clearly discernible.
ACPD
12, 27555–27588, 2012The spatial scale of ozone depletion
events
A. E. Jones et al.
Title Page
Abstract Introduction
Conclusions References
Tables Figures
◭ ◮
◭ ◮
Back Close
Full Screen / Esc
Printer-friendly Version Interactive Discussion
Discussion
P
a
per
|
Dis
cussion
P
a
per
|
Discussion
P
a
per
|
Discussio
n
P
a
per
For example, superimposed on periods with relatively stable ozone concentrations are depletion events that are visible at single stations only. A clear example can be seen on 19 October, where ozone mixing ratios at Halley drop from their background of∼30 ppbv to a minimum of 13 ppbv, the depletion lasts for 21 h, but no equivalent signal is seen at any of the other observation sites. Such a location-specific signature,
5
that is not visible even 80 km away at Site G, suggests that the depletion is driven by local processes.
In contrast, remarkable similarities in features at different observation sites are also evident in the data series. For example, significant ozone depletion is observed at all locations during the period 16 to 22 August (shown in greater detail in Fig. 3a). This is
10
a remarkable period where even the structure in the depletion – with an initial drop in concentrations, a period with stable but lower ozone, followed by a drop to the minimum – is similar between certain sites (compare, for example, Site B, Halley, Belgrano, and Site I). A further period of depletion is evident from 24 to 30 August at all sites where data quality is good, and, where data coverage is more limited, evidence for depletion
15
is still visible. Later in the series, from 6 to 11 October, further large-scale depletion is evident at all sites, to a greater or lesser extent (Fig. 3b).
These large-scale depletion events, visible across the coastal network sites, are clearly regional phenomena, and driven by large-scale processes.
Some insight into the regional situation can be gained from observations of the BrO
20
column made by the satellite-borne GOME-2 instrument (Munro et al., 2006). Maps of tropospheric BrO vertical column density (VCD) were derived using the analysis of Theys et al. (2011). This is performed by subtracting from the measured total BrO col-umn a stratospheric colcol-umn derived from a climatology which makes use of dynamical and chemical indicators and is based on a chemical transport model (Theys et al.,
25
ACPD
12, 27555–27588, 2012The spatial scale of ozone depletion
events
A. E. Jones et al.
Title Page
Abstract Introduction
Conclusions References
Tables Figures
◭ ◮
◭ ◮
Back Close
Full Screen / Esc
Printer-friendly Version Interactive Discussion
Discussion
P
a
per
|
Dis
cussion
P
a
per
|
Discussion
P
a
per
|
Discussio
n
P
a
per
|
are being made close to the terminator and data analysis is restricted to solar zenith angles (SZA) below 90◦. However, where data exist, they show significant BrO
acti-vation in the northernmost (sunlit) region of the Weddell Sea. The fact that large BrO VCD are observed at the edge of the satellite swath implies that areas between the satellite swathes as well as further poleward, where no data are reported, also have
5
some enhanced BrO.
To examine the broader meteorological conditions, we use ECMWF-operational analyses of mean sea level pressure (mslp) and 10-m wind vectors which, for 2008, are available at a horizontal resolution of 25 km. Such analyses allow the origin of the air masses arriving at the coastal network sites (continental or sea ice zone) to be
10
estimated and also show the synoptic scale weather systems that are driving the air mass transport. The ODE 16 to 22 August occurred during a period of rapidly changing meteorological conditions.
It is known that, in the absence of synoptic scale forcing, the Weddell Sea coastal region is predominantly influenced by katabatic flow from the continental interior
dur-15
ing the winter and spring months (King, 1993). Prior to the onset of the August ODE, a low pressure system was situated over the northern Weddell Sea, but sufficiently far from the continent to have no influence on air mass transport at the coast, which remained under the influence of katabatic outflow. Over the next twelve h, however, the low pressure system tracked to the north and east, eventually reaching the coast
20
around Neumayer (see Fig. 5a) and directing sea ice-zone air to the station. Obser-vations at Neumayer and Site A showed partial ozone depletion at this time, while all observing sites further south retained background ozone amounts. By midnight at the start on 17 August, the low had moved further north and dissipated (Fig. 5b). Some recovery in ozone was evident at Neumayer and Site A around this time, with the other,
25
ACPD
12, 27555–27588, 2012The spatial scale of ozone depletion
events
A. E. Jones et al.
Title Page
Abstract Introduction
Conclusions References
Tables Figures
◭ ◮
◭ ◮
Back Close
Full Screen / Esc
Printer-friendly Version Interactive Discussion
Discussion
P
a
per
|
Dis
cussion
P
a
per
|
Discussion
P
a
per
|
Discussio
n
P
a
per
the Weddell Sea coastal region, corresponds to reductions in ozone measured across the network as sea ice zone-air was advected in to the region. The ODE was first apparent at Site B, Halley and Site G, around 06:00 UTC on 17 August, and progres-sively later at the more southerly sites, with an eventual onset at Site I around noon on 17 August. Its onset signature at Neumayer is complicated by the residual
influ-5
ence of the previous low from which the station had not fully recovered. By midnight at the start on 18 August, the low was directly over the Dronning Maud Land coast (Fig. 5c) such that all observing sites within the network were under its influence. The ECMWF-operational 10-m wind vectors for this time (Fig. 5d) show rapid air flow down the Weddell Sea coast, with wind speeds between 16 and 20 m s−1 between Sites A
10
and G. Over the next twelve h, the low pressure system dissipated. Figure 5e shows the mslp at midnight at the start on 19 August, the time of maximum ozone depletion across the network. Although wind speeds across the region had dropped, air was still channelling in a south-westerly direction down the coast (Fig. 5f), advecting sea ice zone-air to all the coastal network sites. By noon on 21 August only the southernmost
15
observation sites, Site I, Belgrano and Site H, were weakly influenced by a Weddell Sea low, while the rest of the network was once again influenced by katabatic flow. Accordingly, residual ozone depletion was evident at Site I, Belgrano and Site H, but at all other sites, ozone mixing ratios were close to background once again.
Around the time of the major October ozone depletion event, significant
enhance-20
ments in the tropospheric BrO VCD are clearly visible over the Weddell Sea sea ice zone and around the coast of Dronning Maud Land (Fig. 6). Given that BrO is evident over the northernmost O3 network sites on 6 October, and that the satellite measures at 09:30 local time it is somewhat surprising that no O3depletion is observed in the first
part of the day. However, no information is contained in the satellite data as to where in
25
ACPD
12, 27555–27588, 2012The spatial scale of ozone depletion
events
A. E. Jones et al.
Title Page
Abstract Introduction
Conclusions References
Tables Figures
◭ ◮
◭ ◮
Back Close
Full Screen / Esc
Printer-friendly Version Interactive Discussion
Discussion
P
a
per
|
Dis
cussion
P
a
per
|
Discussion
P
a
per
|
Discussio
n
P
a
per
|
enhancement is not influencing the lowermost air masses, but resides aloft in the tro-pospheric column.
The ECMWF-operational analyses in Fig. 7 show that the synoptic situation during this period was quite different in character to that of the August ODE discussed above. Rather than the series of rapidly moving low pressure systems, the October ODE was
5
associated with a quasi-stationary low situated off-shore of Halley. While present at the start of 6 October, the low was situated sufficiently far off-shore to have no influence on the prevailing katabatic outflow. By midnight at the start of 7 October, however, the low had moved further inland (Fig. 7a) such that sea ice zone air was advected to the Wed-dell Sea coast. The 10-m wind vectors (Fig. 7b) show sea ice-zone air being directed
10
particularly to the northern and central network sites, with wind speeds of the order 8 to 12 m s−1. Ozone depletion at this time was particularly evident at Site B and Halley, with
reductions in ozone of∼17 and∼18 ppbv, respectively, with more moderate depletion evident at Neumayer (roughly 12 ppbv). Site I, in the south, however, with little influence from sea ice zone air, showed little ozone depletion at this time. By noon on 8 October,
15
a small secondary low had formed over the northern Weddell Sea (Fig. 7c). The effect on air flow is evident in the 10-m wind vectors (Fig. 7d), which show wind speeds of be-tween 8 and 12 m s−1around Neumayer, with air flow to the east, and much lower wind
speeds (mostly<4 m s−1), and air flow to the south east (although still with a sea ice zone origin) around the other network sites. The lows dissipated over the subsequent
20
24 h. By noon on 10 October, while most of the network sites were once again under continental air mass influence, a slow moving low was approaching the Halley/Site B region. This caused some additional sea ice zone air flow to these sites, as reflected by the variation in the surface ozone signals.
Taken together, these results imply that, given wide spread bromine activation and
25
ACPD
12, 27555–27588, 2012The spatial scale of ozone depletion
events
A. E. Jones et al.
Title Page
Abstract Introduction
Conclusions References
Tables Figures
◭ ◮
◭ ◮
Back Close
Full Screen / Esc
Printer-friendly Version Interactive Discussion
Discussion
P
a
per
|
Dis
cussion
P
a
per
|
Discussion
P
a
per
|
Discussio
n
P
a
per
3.2 The spatial extent of ODEs along the Weddell Sea/Dronning Maud Land coast
To explore the spatial scale of such regional ozone depletion events, we focus on the event 16 to 22 August, because data quality is generally good at all observation sites. We calculated, at 12 hourly intervals, the surface ozone anomaly at each site relative to
5
the sites’ 12 h average O3amount before depletion began. The data were plotted as a function of distance from Site I in order to generate transects showing ozone depletion along the coast. The results for the time slices are shown in Fig. 8, and the evolution of the ozone depletion “event” along the coast now becomes apparent. Ozone loss is first apparent at Site A at noon on 16 August. By midnight on 17 August, no data
10
are available from Site A, but depletion of just over 10 ppbv is evident at Neumayer station. By noon on 17 August, depletion at Neumayer is severe (more than 20 ppbv O3 loss), with moderate depletion (∼10 ppbv) evident at Sites H, G, Halley and B. Twelve h later, at midnight on 18 August, depletion from Site I to Site B is of the order 10.5 to 20 ppbv and greater than 20 ppbv at the northernmost Site A and Neumayer.
15
By midnight on 19 August, the largest surface ozone anomaly is evident, with surface ozone depleted by over 20 ppbv from Site I to Site B, and by∼13 ppbv at Neumayer. This time slice marks the maximum in ozone depletion measured along the DML coast, and demonstrates that the ozone-depleted air mass on this occasion extended for over 1200 km along the coast. Indeed, as depletion at Site I, at the southernmost edge of
20
the measurement transect, was of the order 20 ppbv, the results suggest that Site I was still well within the depleted air mass, and that the edge of the depletion was still some distance away.
Over the subsequent 2 ½ days, surface ozone mixing ratios along the coast returned to their background amounts, and became, once again, more uniform in space.
ACPD
12, 27555–27588, 2012The spatial scale of ozone depletion
events
A. E. Jones et al.
Title Page
Abstract Introduction
Conclusions References
Tables Figures
◭ ◮
◭ ◮
Back Close
Full Screen / Esc
Printer-friendly Version Interactive Discussion
Discussion
P
a
per
|
Dis
cussion
P
a
per
|
Discussion
P
a
per
|
Discussio
n
P
a
per
|
3.3 The propagation of ozone depletion inland
While the results above were able to demonstrate the size of a depleted air mass along the coast, the surface ozone network was also able to probe how far inland depleted air masses might regularly extend. Surface ozone depletion arising from coastal pro-cesses has been observed at South Pole (Buys et al., 2012), but such events are
ex-5
ceptions rather than the rule. At the South African station, Sanae, located some 160 km from the ice shelf edge, but at an altitude of 856 m a.s.l., depleted air masses are not routinely observed (Helmig et al., 2007). Here we explore whether inland propagation is limited by distance from the coast or by increasing altitude.
3.3.1 Influence of increasing terrain altitude on ozone propagation inland
10
Figure 9 shows a time series of surface ozone observations from 4 autonomous sites that form a transect between sea level and ∼2000 m on the edge of the Antarctic plateau. Originally the network was designed with a fifth site, Site F, at 2630 m a.s.l., but the system failed to measure during the winter period as a result of the extreme conditions (Bauguitte et al., 2011) so no data are available to include in the transect
15
results.
While considerable variability in surface ozone mixing ratios is evident in the record from the lowermost Site B, this variability becomes more muted as site altitude in-creases. The major regional ozone depletion events that were visible at all coastal stations, and discussed above, can also be seen in Fig. 9. The August event is clearly
20
evident in Site C as well as in the coastal Site B, and although the data quality is very poor, there is a hint of the depletion also evident at Site D. The major ODE from 6 to 11 October is much better represented in the transect data, with a step-wise reduc-tion in ozone loss with altitude. We note that the BrO VCD is also enhanced over the transect area during the October ODE (Fig. 6)
25
ACPD
12, 27555–27588, 2012The spatial scale of ozone depletion
events
A. E. Jones et al.
Title Page
Abstract Introduction
Conclusions References
Tables Figures
◭ ◮
◭ ◮
Back Close
Full Screen / Esc
Printer-friendly Version Interactive Discussion
Discussion
P
a
per
|
Dis
cussion
P
a
per
|
Discussion
P
a
per
|
Discussio
n
P
a
per
and Site C (∼25 ppbv) during the August event, data quality did not allow an equivalent calculation for Sites D or E. For the October event, however, data coverage is better. On this occasion,∼23 ppbv ozone depletion was calculated at both Sites B and C, with 14 ppbv at Site D and 8 ppbv at Site E.
3.3.2 Propagation of ozone depletion inland with no increase in terrain height
5
In order to explore how far inland ozone depleted air masses can be transported when there is no increase in altitude, we examine data from Sites I and J, both located on the Filchner Ice Shelf but with Site J 200 km inland. As data quality at Site I is somewhat patchy, we also include data from the nearby Belgrano station.
Figure 10 shows time series of surface ozone during the major ozone depletion
10
events of August and October, and Table 3 shows the amount of ozone depletion at each site during each event. For both ozone depletion events, the amount of ozone de-pletion is roughly equivalent at all sites. This suggests that ozone-depleted air masses remain intact over the distance of 200 km when there is no increase in altitude.
Given that the ice shelf has near zero salinity, the depletion events inland are likely
15
a result of transport rather than in-situ chemistry.
3.4 The regional extent of ozone depletion
To put results from the network into context, and to assess the wider implications of the observed ozone loss, we need to know how large the ozone depleted air masses were, both in terms of square kilometres, and also in terms of volume. As we only have
20
measurements for the land mass, we restrict our analysis to the ice shelf/sheet area. We emphasise that this is likely to be a vast underestimate of the total area depleted in ozone, given that the ozone-depleted air masses observed by the network emanated from the sea ice zone, large areas of which are likely also depleted in ozone.
The results presented in this paper show that, at 00:00 on 19 August, all of the
net-25
ACPD
12, 27555–27588, 2012The spatial scale of ozone depletion
events
A. E. Jones et al.
Title Page
Abstract Introduction
Conclusions References
Tables Figures
◭ ◮
◭ ◮
Back Close
Full Screen / Esc
Printer-friendly Version Interactive Discussion
Discussion
P
a
per
|
Dis
cussion
P
a
per
|
Discussion
P
a
per
|
Discussio
n
P
a
per
|
background amount of∼35 ppbv ozone, then ozone loss was of the order 60 %. Re-sults from the measurement transect (Fig. 9) show that, at the same time, ozone was depleted to at least 500 m, and possibly as high as 1000 m, by a similar amount. The area of land mass covered by the network, from the coast to an altitude of 500 m, is ∼180 000 km2. We can therefore assert that the ozone-depleted air mass on 19
Au-5
gust was at least this size, and most likely considerably more. The likely greater size is both because it extended further to the south west than Site I (which, given the amount of ozone depletion, was clearly not on the edge of the air mass) and also because we have taken no account here of the area of the sea ice zone affected. In terms of volume, merely over the land, at least 90 000 km3of boundary layer air were depleted in ozone
10
by∼60 %. Depletion of a similar order of magnitude was also observed in October.
4 Conclusions
The results presented in this paper demonstrate, for the first time, the spatial extent of ozone depletion during Antarctic spring. They are entirely in line with results from the northern hemisphere TOPSE experiment, which measured a depleted air mass of the
15
order 900 km along a flight track (Ridley et al., 2003). They are also consistent with the results from the “TARA” experiment, and the large areas of the Arctic Ocean that were effectively void of ozone (Bottenheim et al., 2009). The fact that ozone-poor air is advected roughly simultaneously to a∼1200 km stretch of the DML coast implies the presence of a large pool of O3-depleted air over the Weddell Sea sea ice zone at that
20
time.
The wider implications of ozone depletion events and their associated chemistry have been introduced in previous publications (e.g. Simpson et al., 2007b and ref-erences therein). Enhanced concentrations of bromine radicals, evident from satellite measurements of BrO, and widespread destruction of tropospheric ozone, indicate a
25
ACPD
12, 27555–27588, 2012The spatial scale of ozone depletion
events
A. E. Jones et al.
Title Page
Abstract Introduction
Conclusions References
Tables Figures
◭ ◮
◭ ◮
Back Close
Full Screen / Esc
Printer-friendly Version Interactive Discussion
Discussion
P
a
per
|
Dis
cussion
P
a
per
|
Discussion
P
a
per
|
Discussio
n
P
a
per
it appears from the results presented here to also hold true for Antarctica. On a re-gional basis, a key impact from an increase in the BrO : OH ratio is on DMS. A critical product from DMS oxidation by OH is SO2which is a precursor of radiatively-important
sulphate aerosols. A reduction in OH relative to BrO suggests that, relatively speaking, more DMS will be oxidised by the reaction BrO+DMS→Br+DMSO. This latter
path-5
way does not yield SO2, and would thus result in fewer sulphate aerosols. Results from
year-round measurements of DMS and BrO at Halley station (Read et al., 2008) show a reduction in DMS during the spring, when ambient BrO is at its annual maximum, relative to the previous and subsequent weeks.
As well as this potential indirect impact on the radiative balance, ozone itself is a
10
greenhouse gas, such that a reduction in concentration will also have a direct influence on radiative forcing. Assuming complete removal of 40 ppbv of ozone in a 300 m bound-ary layer, Jacobi et al. (2010) calculate a resultant radiative forcing of −0.04 W m−2. Roscoe et al. (2001) refer to a number of studies to derive a surface cooling of 0.02 K for 15 ppbv of ozone loss between 1 and 3 km, which becomes up to 0.05 K if the
de-15
pleted air masses mix to higher altitudes.
The results presented in this paper, of widespread ozone depletion, allows these implications to be viewed in a wider context. The radiative forcing, although a rela-tively small amount, is likely to affect a large area over the coastal margin and sea ice zone. Further, given that chemical production of ozone during polar spring is extremely
20
slow, this volume of depleted air is likely to ultimately be mixed to higher altitudes. The consequent dilution of free tropospheric ozone would result in a larger radiative re-sponse. The enhanced bromine chemistry is evident from satellite measurements, but the amount of ozone depletion suggested by our results supports the idea of a major shift in oxidant control over a broad region.
25
ACPD
12, 27555–27588, 2012The spatial scale of ozone depletion
events
A. E. Jones et al.
Title Page
Abstract Introduction
Conclusions References
Tables Figures
◭ ◮
◭ ◮
Back Close
Full Screen / Esc
Printer-friendly Version Interactive Discussion
Discussion
P
a
per
|
Dis
cussion
P
a
per
|
Discussion
P
a
per
|
Discussio
n
P
a
per
|
question remains whether boundary layer air over the Antarctic sea ice zone is depleted in ozone for extensive periods of time. A next step would be to probe springtime air masses directly over the sea ice zone, either with a buoy system, or with fast response ozone sensors on UAVs.
Acknowledgements. AEJ is grateful to John Turner and Gareth Marshall (BAS) for
discus-5
sions around the meteorology presented in Sec. 3, and to Tony Philips for generating some publication quality figures. The autonomous network, the Halley observations, and the overall data analysis were part of the British Antarctic Survey’s Polar Science for Planet Earth pro-gramme funded by the Natural Environment Research Council. The Belgrano data is obtained by collaboration agreements between Direcci ´on Nacional del Ant ´artico/Instituto Ant ´artico
Ar-10
gentino and the Instituto Nacional de T ´ecnica Aeroespacial of Spain. Work on the Belgrano data was partially funded by Spanish Polar Program (POL2006-00382 and CGL2004-05419-C02-01 projects). The research in Belgium was funded by the Belgian Prodex Atmospheric Composition, Chemistry and Climate (A3C).
References
15
Bauguitte, S. J.-B., Brough, N., Frey, M. M., Jones, A. E., Maxfield, D. J., Roscoe, H. K., Rose, M. C., and Wolff, E. W.: A network of autonomous surface ozone monitors in Antarctica: technical description and first results, Atmos. Meas. Tech., 4, 645–658, doi:10.5194/amt-4-645-2011, 2011.
Bottenheim, J. W., Netcheva, S., Morin, S., and Nghiem, S. V.: Ozone in the boundary layer air
20
over the Arctic Ocean: measurements during the TARA transpolar drift 2006–2008, Atmos. Chem. Phys., 9, 4545–4557, doi:10.5194/acp-9-4545-2009, 2009.
Buys, Z., Brough, N., Huey, G., Tanner, D., von Glasow, R., and Jones, A. E.: Br2, BrCl, BrO and surface ozone in coastal Antarctica: a meteorological and chemical analysis, Atmos. Chem. Phys. Discuss., 12, 11035–11077, doi:10.5194/acpd-12-11035-2012, 2012.
25
air-ACPD
12, 27555–27588, 2012The spatial scale of ozone depletion
events
A. E. Jones et al.
Title Page
Abstract Introduction
Conclusions References
Tables Figures
◭ ◮
◭ ◮
Back Close
Full Screen / Esc
Printer-friendly Version Interactive Discussion
Discussion
P
a
per
|
Dis
cussion
P
a
per
|
Discussion
P
a
per
|
Discussio
n
P
a
per
craft measurements during ARCTAS and ARCPAC, Atmos. Chem. Phys., 12, 1255–1285, doi:10.5194/acp-12-1255-2012, 2012.
Frieß, U., Hollwedel, J., Konig-Langlo, G., Wagner, T., and Platt, U.: Dynamics and chemistry of tropospheric bromine explosion events in the Antarctic coastal region, J. Geophys. Res., 109, D06305, doi:10.1029/2003JD004133, 2004.
5
Helmig, D., Oltmans, S., Carlson, D., Lamarque, J.-F., Jones, A. E., Labuschagne, C., Anlauf, K., and Hayden, K.: A review of surface ozone in the polar regions, Atmos. Environ., 41, 5138–5161, doi:10.1016/j.atmosenv.2006.09.053, 2007.
Hopper, J. F., Peters, B., Yokouchi, Y., Niki, H., Jobson, B. T., Shelson, P. B., and Muthuramu, K.: Chemical and meteorological observations at ice camp SWAN during Polar Sunrise
Ex-10
periment 1992, J. Geophys. Res., 99, 25489–25498, 1994.
Hopper, J. F., Barrie, L. A., Silis, A., Hart, W., Gallant, A. J., and Dryfhout, H.: Ozone and meteorology during the 1994 Polar Sunrise Experiment, J. Geophys. Res., 103, 1481–1492, 1998.
Jacobi, H.-W., Morin, S., and Bottenheim, J. W.: Observation of widespread depletion of ozone
15
in the springtime boundary layer of the central Arctic linked to mesoscale synoptic conditions, J. Geophys. Res., 115, D17302, doi:10.1029/2010JD013940, 2010.
Jones, A. E., Anderson, P. S., Begoin, M., Brough, N., Hutterli, M. A., Marshall, G. J., Richter, A., Roscoe, H. K., and Wolff, E. W.: BrO, blizzards, and drivers of polar tropospheric ozone depletion events, Atmos. Chem. Phys., 9, 4639–4652, doi:10.5194/acp-9-4639-2009, 2009.
20
Kaleschke, L., Richter, A., Burrows, J. P., Afe, O., Heygster, G., Notholt, J., Rankin, A. M., Roscoe, H. K., Hollwedel, J., Wagner, T., and Jacobi, H.-W.: Frost flowers on sea ice as a source of sea salt and their influence on tropospheric halogen chemistry, Geophys. Res. Lett., 31, L16114, doi:10.1029/2004GL020655, 2004.
King, J. C.: Control of near-surface winds over an Antarctic ice shelf, J. Geophys. Res., 98,
25
12949–12953, 1993.
Knepp, T. N., Bottenheim, J., Carlsen, M., Carlson, D., Donohoue, D., Friederich, G., Matrai, P. A., Netcheva, S., Perovich, D. K., Santini, R., Shepson, P. B., Simpson, W., Valentic, T., Williams, C., and Wyss, P. J.: Development of an autonomous sea ice tethered buoy for the study of ocean-atmosphere-sea ice-snow pack interactions: the O-buoy, Atmos. Meas. Tech.,
30
3, 249–261, doi:10.5194/amt-3-249-2010, 2010.
ACPD
12, 27555–27588, 2012The spatial scale of ozone depletion
events
A. E. Jones et al.
Title Page
Abstract Introduction
Conclusions References
Tables Figures
◭ ◮
◭ ◮
Back Close
Full Screen / Esc
Printer-friendly Version Interactive Discussion
Discussion
P
a
per
|
Dis
cussion
P
a
per
|
Discussion
P
a
per
|
Discussio
n
P
a
per
|
McConnell, J. C., Henderson, G. S., Barrie, L., Bottenheim, J., Niki, H., Langford, C. H., and Templeton, E. M. J.: Photochemical bromine production implicated in Arctic boundary-layer ozone depletion, Nature, 355, 150–152, 1992.
Munro, R., Eisinger, M., Anderson, C., Callies, J., Corpaccioli, E., Lang, R., Lefebvre, A., Livs-chitz, Y., and P ´erez Albi ˜nana, A.: GOME-2 on Metop: From in-orbit verification to routine
op-5
erations, in: The 2006 EUMETSAT Meteorological Satellite Conference, 12–16 June 2006, Helsinki, Finland, 48 pp., 2006.
Rankin, A. M., Wolff, E. W., and Martin, S.: Frost flowers – implications for tropospheric chem-istry and ice core interpretation, J. Geophys. Res., 107, 4683, doi:10.1029/2002JD002492, 2002.
10
Read, K. A., Lewis, A. C., Bauguitte, S., Rankin, A. M., Salmon, R. A., Wolff, E. W., Saiz-Lopez, A., Bloss, W. J., Heard, D. E., Lee, J. D., and Plane, J. M. C.: DMS and MSA measurements in the Antarctic Boundary Layer: impact of BrO on MSA production, Atmos. Chem. Phys., 8, 2985–2997, doi:10.5194/acp-8-2985-2008, 2008.
Richter, A., Wittrock, F., Eisinger, M., and Burrows, J. P.: GOME observations of tropospheric
15
BrO in Northern Hemispheric spring and summer 1997, Geophys. Res. Lett., 25, 2683–2686, 1998.
Ridley, B. A., Atlas, E. L., Montzka, D. D., Browell, E. V.,. Cantrell, C. A, Blake, D. R., Blake, N. J., Cinquini, L., Coffey, M. T., Emmons, L. K., Cohen, R. C., DeYoung, R. J., Dibb, J. E., Eisele, F. L., Flocke, F. M.,Fried, A. , Grahek, F. E., Grant, W. B., Hair, J. W., Hannigan, J.
20
W., Heikes, B. J., Lefer, B. L., Mauldin, R. L., Moody, J. L., Shetter, R. E., Snow, J. A., Talbot, R. W., Thornton, J. A., Walega, J. G., Weinheimer, A. J., Wert, B. P., and Wimmers, A. J.: Ozone depletion events observed in the high latitude surface layer during the TOPSE aircraft program, J. Geophys. Res., 108, 8356, doi:10.1029/2001JD001507, 2003.
Ridley, B. A., Zeng, T., Wang, Y, Atlas, E. L., Browell, E. V., Hess, P. G., Orlando, J. J., Chance,
25
K., and Richter, A.: An ozone depletion event in the sub-arctic surface layer over Hudson Bay, Canada, J. Atmos. Chem., 57, 255–280, doi:10.1007/s10874-007-9072-z, 2007. Roscoe, H. K., Kreher, K., and Friess, U.: Ozone loss episodes in the free Antarctic troposphere,
suggesting a possible climate feedback, Geophys. Res. Lett., 28, 2911–2914, 2001.
Roscoe, H. K., Brough, N., Jones, A. E., Wittrock, F., Richter, A., Van Roozendael, M., and
30
ACPD
12, 27555–27588, 2012The spatial scale of ozone depletion
events
A. E. Jones et al.
Title Page
Abstract Introduction
Conclusions References
Tables Figures
◭ ◮
◭ ◮
Back Close
Full Screen / Esc
Printer-friendly Version Interactive Discussion
Discussion
P
a
per
|
Dis
cussion
P
a
per
|
Discussion
P
a
per
|
Discussio
n
P
a
per
Salawitch, R. J., Canty, T., Kurosu, T., Chance, K., Liang, Q., da Silva, A., Pawson, S., Nielsen, J. E., Rodriguez, J. M., Bhartia, P. K., Liu, X., Huey, L. G., Liao, J., Stickel, R. E., Tanner, D. J., Dibb, J. E., Simpson, W. R., Donohoue, D., Weinheimer, A., Flocke, F., Knapp, D., Montzka, D., Neuman, J. A., Nowak, J. B., Ryerson, T. B., Oltmans, S., Blake, D. R., Atlas, E. L., Kinnison, D. E., Tilmes, S., Pan, L. L., Hendrick, F., Van Roozendael, M., Kreher, K.,
5
Johnston, P. V., Gao, R. S., Johnson, B., Bui, T. P., Chen, G., Pierce, R. B., Crawford, J. H., and Jacob, D. J.: A new interpretation of total column BrO during Arctic spring, Geophys. Res. Lett., 37, L21805, doi:10.1029/2010GL043798, 2010.
Simpson, W. R., Carlson, D., H ¨onninger, G., Douglas, T. A., Sturm, M., Perovich, D., and Platt, U.: First-year sea-ice contact predicts bromine monoxide (BrO) levels at Barrow, Alaska
bet-10
ter than potential frost flower contact, Atmos. Chem. Phys., 7, 621–627, doi:10.5194/acp-7-621-2007, 2007a.
Simpson, W. R., von Glasow, R., Riedel, K., Anderson, P., Ariya, P., Bottenheim, J., Burrows, J., Carpenter, L. J., Frieß, U., Goodsite, M. E., Heard, D., Hutterli, M., Jacobi, H.-W., Kaleschke, L., Neff, B., Plane, J., Platt, U., Richter, A., Roscoe, H., Sander, R., Shepson, P., Sodeau, J.,
15
Steffen, A., Wagner, T., and Wolff, E.: Halogens and their role in polar boundary-layer ozone depletion, Atmos. Chem. Phys., 7, 4375–4418, doi:10.5194/acp-7-4375-2007, 2007b. Spreen, G., Kaleschke, L., and Heygster, G.: Sea ice remote sensing using AMSR-E 89 GHz
channels, J. Geophys. Res., 113, C02S03, doi:10.1029/2005JC003384, 2008.
Theys, N., Van Roozendael, M., Errera, Q., Hendrick, F., Daerden, F., Chabrillat, S., Dorf, M.,
20
Pfeilsticker, K., Rozanov, A., Lotz, W., Burrows, J. P., Lambert, J.-C., Goutail, F., Roscoe, H. K., and De Mazi `ere, M.: A global stratospheric bromine monoxide climatology based on the BASCOE chemical transport model, Atmos. Chem. Phys., 9, 831–848, doi:10.5194/acp-9-831-2009, 2009.
Theys, N., Van Roozendael, M., Hendrick, F., Yang, X., De Smedt, I., Richter, A., Begoin, M.,
25
Errera, Q., Johnston, P. V., Kreher, K., and De Mazi `ere, M.: Global observations of tropo-spheric BrO columns using GOME-2 satellite data, Atmos. Chem. Phys., 11, 1791–1811, doi:10.5194/acp-11-1791-2011, 2011.
Vogt, R., Crutzen, P. J., and Sander, R.: A mechanism for halogen release from sea-salt aerosol in the remote marine boundary layer, Nature, 383, 327–330, 1996.
30
ACPD
12, 27555–27588, 2012The spatial scale of ozone depletion
events
A. E. Jones et al.
Title Page
Abstract Introduction
Conclusions References
Tables Figures
◭ ◮
◭ ◮
Back Close
Full Screen / Esc
Printer-friendly Version Interactive Discussion
Discussion
P
a
per
|
Dis
cussion
P
a
per
|
Discussion
P
a
per
|
Discussio
n
P
a
per
|
Wilson, K. L. and Birks, J. W.: Mechanism and elimination of a water vapor interference in the measurements of ozone by UV absorbance, Environ. Sci. Technol., 40, 6361–6367, doi:10.1021/es052590c, 2006.
Yang, X., Pyle, J. A., and Cox, R. A.: Sea salt aerosol production and bromine release: Role of snow on sea ice, Geophys. Res. Lett., 35, L16815, doi:10.1029/2008GL034536, 2008.
5
ACPD
12, 27555–27588, 2012The spatial scale of ozone depletion
events
A. E. Jones et al.
Title Page
Abstract Introduction
Conclusions References
Tables Figures
◭ ◮
◭ ◮
Back Close
Full Screen / Esc
Printer-friendly Version Interactive Discussion
Discussion
P
a
per
|
Dis
cussion
P
a
per
|
Discussion
P
a
per
|
Discussio
n
P
a
per
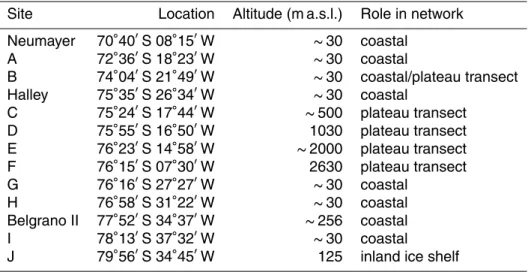
Table 1.Details of all ozone monitoring sites discussed in this paper.
Site Location Altitude (m a.s.l.) Role in network
Neumayer 70◦40′S 08◦15′W
∼30 coastal
A 72◦36′S 18◦23′W
∼30 coastal
B 74◦04′S 21◦49′W
∼30 coastal/plateau transect
Halley 75◦35′S 26◦34′W
∼30 coastal
C 75◦24′S 17◦44′W
∼500 plateau transect
D 75◦55′S 16◦50′W 1030 plateau transect
E 76◦23′S 14◦58′W
∼2000 plateau transect
F 76◦15′S 07◦30′W 2630 plateau transect
G 76◦16′S 27◦27′W
∼30 coastal
H 76◦58′S 31◦22′W
∼30 coastal
Belgrano II 77◦52′S 34◦37′W
∼256 coastal
I 78◦13′S 37◦32′W
∼30 coastal
ACPD
12, 27555–27588, 2012The spatial scale of ozone depletion
events
A. E. Jones et al.
Title Page
Abstract Introduction
Conclusions References
Tables Figures
◭ ◮
◭ ◮
Back Close
Full Screen / Esc
Printer-friendly Version Interactive Discussion
Discussion
P
a
per
|
Dis
cussion
P
a
per
|
Discussion
P
a
per
|
Discussio
n
P
a
per
|
Table 2.Ozone loss during two major ozone depletion events observed at sites on a transect
up onto the Antarctic plateau. For the event of 18 August, data quality did not allow calculation of ozone loss for sites E or D.
Distance inland Altitude O3loss (ppbv) O3loss (ppbv) (km) (m a.s.l.) 18 August event 8 October event
E 320 2000 – 8
D 250 1030 – 14
C 190 500 25 23
ACPD
12, 27555–27588, 2012The spatial scale of ozone depletion
events
A. E. Jones et al.
Title Page
Abstract Introduction
Conclusions References
Tables Figures
◭ ◮
◭ ◮
Back Close
Full Screen / Esc
Printer-friendly Version Interactive Discussion
Discussion
P
a
per
|
Dis
cussion
P
a
per
|
Discussion
P
a
per
|
Discussio
n
P
a
per
Table 3.Amount of ozone loss during two major ozone depletion events observed at a coastal
and an inland site on the Filchner Ice Shelf (Site I and J, respectively), as well as at a nearby coastal site (Belgrano II).
Distance inland Altitude O3loss (ppbv) loss (ppbv) (km) (m a.s.l.) 19 August event 9 October event
Belgrano II coastal 256 23 26
I coastal 30 26 25∗
J 200 125 24 22
∗For the event of 9 October, we note the reduced data quality at Site I, hence the calculated value of
ACPD
12, 27555–27588, 2012The spatial scale of ozone depletion
events
A. E. Jones et al.
Title Page
Abstract Introduction
Conclusions References
Tables Figures
◭ ◮
◭ ◮
Back Close
Full Screen / Esc
Printer-friendly Version Interactive Discussion
Discussion
P
a
per
|
Dis
cussion
P
a
per
|
Discussion
P
a
per
|
Discussio
n
P
a
per
|
a)
b)
Fig. 1. (a)Map of study area showing both the autonomous sites (Sites A to J) and the manned
ACPD
12, 27555–27588, 2012The spatial scale of ozone depletion
events
A. E. Jones et al.
Title Page
Abstract Introduction
Conclusions References
Tables Figures
◭ ◮
◭ ◮
Back Close
Full Screen / Esc
Printer-friendly Version Interactive Discussion
Discussion
P
a
per
|
Dis
cussion
P
a
per
|
Discussion
P
a
per
|
Discussio
n
P
a
per
40 30 20 10 0
01/08/2008 08/08/2008 15/08/2008 22/08/2008 29/08/2008 05/09/2008 12/09/2008 19/09/2008 26/09/2008 03/10/2008 10/10/2008 17/10/2008 24/10/2008 31/10/2008
date
40 30 20 10 0
40 30 20 10 0 40 30 20 10 0 40 30 20 10 0
40 30 20 10 0 40 30 20 10 0 40 30 20 10 0
surface ozone (ppbv)
N e um a ye r
Sit e A
Sit e B
Sit e G
Sit e H
Sit e I
H a lle y
Be lgra no I I
Fig. 2.Time-series of surface ozone measurements from the autonomous sites and manned
ACPD
12, 27555–27588, 2012The spatial scale of ozone depletion
events
A. E. Jones et al.
Title Page
Abstract Introduction
Conclusions References
Tables Figures
◭ ◮
◭ ◮
Back Close
Full Screen / Esc
Printer-friendly Version Interactive Discussion
Discussion
P
a
per
|
Dis
cussion
P
a
per
|
Discussion
P
a
per
|
Discussio
n
P
a
per
|
a) b)
Fig. 3.Major ozone depletion events that were evident at all coastal stations,(a)from 16 to
ACPD
12, 27555–27588, 2012The spatial scale of ozone depletion
events
A. E. Jones et al.
Title Page
Abstract Introduction
Conclusions References
Tables Figures
◭ ◮
◭ ◮
Back Close
Full Screen / Esc
Printer-friendly Version Interactive Discussion
Discussion
P
a
per
|
Dis
cussion
P
a
per
|
Discussion
P
a
per
|
Discussio
n
P
a
per
Fig. 4.Tropospheric vertical column density BrO derived from the GOME-2 instrument during
ACPD
12, 27555–27588, 2012The spatial scale of ozone depletion
events
A. E. Jones et al.
Title Page
Abstract Introduction
Conclusions References
Tables Figures
◭ ◮
◭ ◮
Back Close
Full Screen / Esc
Printer-friendly Version Interactive Discussion
Discussion
P
a
per
|
Dis
cussion
P
a
per
|
Discussion
P
a
per
|
Discussio
n
P
a
per
|
a) b)
d) c)
e) f)
Fig. 5.ERA-Operational meteorological maps around the Weddell Sea region at various times
during the major August ozone depletion event.(a)Mean sea level pressure (mslp) at noon on 16 August;(b)mslp at midnight at start of 17 August;(c)mslp at midnight at start of 18 August;
(d)10 m wind vectors at midnight at start of 18 August;(e)mslp at midnight at start of 19 August;
ACPD
12, 27555–27588, 2012The spatial scale of ozone depletion
events
A. E. Jones et al.
Title Page
Abstract Introduction
Conclusions References
Tables Figures
◭ ◮
◭ ◮
Back Close
Full Screen / Esc
Printer-friendly Version Interactive Discussion
Discussion
P
a
per
|
Dis
cussion
P
a
per
|
Discussion
P
a
per
|
Discussio
n
P
a
per
Fig. 6.Tropospheric vertical column density BrO derived from the GOME-2 instrument during
ACPD
12, 27555–27588, 2012The spatial scale of ozone depletion
events
A. E. Jones et al.
Title Page
Abstract Introduction
Conclusions References
Tables Figures
◭ ◮
◭ ◮
Back Close
Full Screen / Esc
Printer-friendly Version Interactive Discussion
Discussion
P
a
per
|
Dis
cussion
P
a
per
|
Discussion
P
a
per
|
Discussio
n
P
a
per
|
a)
b)
c)
d)
Fig. 7.ERA-Operational meteorological maps around the Weddell Sea region at various times
ACPD
12, 27555–27588, 2012The spatial scale of ozone depletion
events
A. E. Jones et al.
Title Page Abstract Introduction Conclusions References Tables Figures ◭ ◮ ◭ ◮ Back Close
Full Screen / Esc
Printer-friendly Version Interactive Discussion Discussion P a per | Dis cussion P a per | Discussion P a per | Discussio n P a per
16 Aug 00:00
I Bs H GHs B A NMs
0
16 Aug 12:00
-30 -20 -10 0
17 Aug 00:00
-30 -20 -10 0
17 Aug 12:00
-30 -20 -10 0
18 Aug 00:00
-30 -20 -10 0
18 Aug 12:00
surf
ace O3 an
om aly (ppbv ) -30 -20 -10 0
19 Aug 00:00
-30 -20 -10 0
19 Aug 12:00
-30 -20 -10 0
20 Aug 00:00
-30 -20 -10 0
20 Aug 12:00
-30 -20 -10 0
21 Aug 00:00
-30 -20 -10 0
21 Aug 12:00
distance along coast from site I (km)
0 200 400 600 800 1000 1200
-30 -20 -10 0
Fig. 8.Surface ozone anomaly (i.e. difference in mixing ratio) at each site relative to the 12 h
ACPD
12, 27555–27588, 2012The spatial scale of ozone depletion
events
A. E. Jones et al.
Title Page
Abstract Introduction
Conclusions References
Tables Figures
◭ ◮
◭ ◮
Back Close
Full Screen / Esc
Printer-friendly Version Interactive Discussion
Discussion
P
a
per
|
Dis
cussion
P
a
per
|
Discussion
P
a
per
|
Discussio
n
P
a
per
|
40 30 20 10 0
surface ozone (ppbv)
1/8/08 8/8/08
15/8/08 22/8/08 29/8/08 5/9/08 12/9/08 19/9/08 26/9/08 3/10/08
10/10/08 17/10/08 24/10/08 31/10/08
date
40 30 20 10 0
40 30 20 10 0 40 30 20 10 0
Sit e B Sit e C
Sit e D Sit e E
Fig. 9.Surface ozone (10 min averages) from 1 August 2008 to 31 October 2008 at 4 sites from
ACPD
12, 27555–27588, 2012The spatial scale of ozone depletion
events
A. E. Jones et al.
Title Page
Abstract Introduction
Conclusions References
Tables Figures
◭ ◮
◭ ◮
Back Close
Full Screen / Esc
Printer-friendly Version Interactive Discussion
Discussion
P
a
per
|
Dis
cussion
P
a
per
|
Discussion
P
a
per
|
Discussio
n
P
a
per
Belgrano coastal
Belgrano coastal
Belgrano
‐
coastal
Belgrano
‐
coastal
b
v)
Site
I
‐
coastal
Site
I
‐
coastal
ce
O
3(pp
b
Surf
a
c
Site
J
‐
inland
Site
J
‐
inland
a)
b)
Fig. 10.Surface ozone time series (10 min averages) from three low altitude sites; I and J, both