www.atmos-chem-phys.net/10/8219/2010/ doi:10.5194/acp-10-8219-2010
© Author(s) 2010. CC Attribution 3.0 License.
Chemistry
and Physics
Glyoxal processing by aerosol multiphase chemistry: towards a
kinetic modeling framework of secondary organic aerosol formation
in aqueous particles
B. Ervens1,2and R. Volkamer1,3
1Cooperative Institute for Research in Environmental Sciences, University of Colorado, Boulder, Colorado, USA 2Chemical Sciences Division, Earth System Research Laboratory, NOAA, Boulder, Colorado, USA
3Department of Biochemistry and Chemistry, University of Colorado, Boulder, CO, USA Received: 22 April 2010 – Published in Atmos. Chem. Phys. Discuss.: 11 May 2010 Revised: 2 August 2010 – Accepted: 19 August 2010 – Published: 2 September 2010
Abstract. This study presents a modeling framework based
on laboratory data to describe the kinetics of glyoxal reac-tions that form secondary organic aerosol (SOA) in aqueous aerosol particles. Recent laboratory results on glyoxal reac-tions are reviewed and a consistent set of empirical reaction rate constants is derived that captures the kinetics of glyoxal hydration and subsequent reversible and irreversible reac-tions in aqueous inorganic and water-soluble organic aerosol seeds. Products of these processes include (a) oligomers, (b) nitrogen-containing products, (c) photochemical oxidation products with high molecular weight. These additional aque-ous phase processes enhance the SOA formation rate in par-ticles and yield two to three orders of magnitude more SOA than predicted based on reaction schemes for dilute aqueous phase (cloud) chemistry for the same conditions (liquid water content, particle size).
The application of the new module including detailed chemical processes in a box model demonstrates that both the time scale to reach aqueous phase equilibria and the choice of rate constants of irreversible reactions have a pronounced effect on the predicted atmospheric relevance of SOA for-mation from glyoxal. During day time, a photochemical (most likely radical-initiated) process is the major SOA for-mation pathway forming∼5 µg m−3SOA over 12 h (assum-ing a constant glyoxal mix(assum-ing ratio of 300 ppt). Dur(assum-ing night time, reactions of nitrogen-containing compounds (ammo-nium, amines, amino acids) contribute most to the predicted SOA mass; however, the absolute predicted SOA masses are
Correspondence to: B. Ervens
(barbara.ervens@noaa.gov) R. Volkamer
(rainer.volkamer@colorado.edu)
reduced by an order of magnitude as compared to day time production. The contribution of the ammonium reaction sig-nificantly increases in moderately acidic or neutral particles (5<pH<7).
Glyoxal uptake into ammonium sulfate seed under dark conditions can be represented with a single reaction param-eterkeffuptthat does not depend on aerosol loading or water content, which indicates a possibly catalytic role of aerosol water in SOA formation. However, the reversible nature of uptake under dark conditions is not captured bykeffupt, and can be parameterized by an effective Henry’s law constant in-cluding an equilibrium constantKolig= 1000 (in ammonium sulfate solution). Such reversible glyoxal oligomerization contributes<1% to total predicted SOA masses at any time. Sensitivity tests reveal five parameters that strongly affect the predicted SOA mass from glyoxal: (1) time scales to reach equilibrium states (as opposed to assuming instanta-neous equilibrium), (2) particle pH, (3) chemical composi-tion of the bulk aerosol, (4) particle surface composicomposi-tion, and (5) particle liquid water content that is mostly determined by the amount and hygroscopicity of aerosol mass and to a lesser extent by the ambient relative humidity.
1 Introduction
The prediction of the growth of atmospheric organic aerosols (OA) represents a major challenge in current modeling ef-forts due to the high uncertainties in sources, properties, reac-tion pathways and product volatility distribureac-tion of organics. In particular, the formation of OA from reaction products of volatile precursors (“secondary organic aerosol”, SOA) is in-sufficiently described in models and their amount is underes-timated by factors of 2–100 (DeGouw et al., 2005; Volkamer et al., 2006; Bahreini et al., 2009; Kleinman et al., 2009). The reasons for this discrepancy could both be due to the incom-plete knowledge of precursors or insufficient understanding of the processes that convert organic gas phase precursors into low-volatility products that contribute to SOA.
Traditional OA models describe SOA formation by con-densation of low-volatility and/or absorption of semi-volatile oxidation products from anthropogenic and biogenic pre-cursors into the organic condensed phase. In this frame-work, only the saturation vapor pressure of the product and the amount of the preexisting organic portion of the aerosol mass determine the partitioning of gas-phase products be-tween the gas and particle phase (Pankow, 1994; Odum et al., 1996; Griffin et al., 1999; Seinfeld and Pankow, 2003). Re-cent studies suggest a larger pool of OA precursors follows this conceptual framework of SOA formation and previously “missing” precursors can account for a significant portion of the missing SOA source in polluted air OA and their precur-sor gases evolve by becoming more oxidized, less volatile and more hygroscopic (Jimenez et al., 2009; Ervens et al., 2010). However, the chemical pathways by which this ag-ing occurs in the atmosphere has mostly been considered in terms of gas-phase reactions of radicals (OH, NO3)and ozone with vapors that contain five or more carbon atoms (Claeys et al., 2004; Martin-Reviejo and Wirtz, 2005; Ng et al., 2007). Such gas-phase oxidation reactions do not ex-plain SOA contributions from very volatile compounds like acetylene (C2) (e.g., Volkamer et al., 2007, 2009) and/or the formation of large organic molecules such as oligomers, organosulfates, and organonitrogen species that have been identified in ambient particles and rain water (Altieri et al., 2006; Denkenberger et al., 2007; Gomez-Gonzalez et al., 2008).
In several studies, it has been shown that SOA formed from glyoxal exhibits significant light absorption at 300 nm< λ <400 nm and to a smaller extent also at higher wavelengths (Debus, 1858; Shapiro et al., 2009). In Mexico City, where glyoxal contributes significantly to SOA forma-tion (Volkamer et al., 2007), light absorpforma-tion from “brown carbon” (Gelencser, 2004) at UV wavelengths accounts for up to 40% of the heating rate of black carbon (Barnard et al., 2008). This heating is currently not accounted for in es-timates of the aerosol direct effect by the Intergovernmen-tal Panel of Climate Change (IPCC) (Solomon et al., 2007). Brown carbon also slows down photochemistry by reducing
photon actinic fluxes near ground level at those wavelengths that are responsible for most radical production (Volkamer et al., 2010b). Finally, the lower single scattering albedo is a sensitive parameter for the quantitative interpretation of solar straylight satellite retrievals (Dix et al., 2008).
In the aqueous phase, unique chemical reactions occur due to the presence of ions and hydrated species (e.g., diols) that have different properties and reactivity than their counter-parts in the gas phase. For example, chemical processes in cloud droplets are the main contributor to sulfate formation (Seinfeld and Pandis, 1998) and have also been shown to contribute to organic mass (e.g., oxalate) formation (Ervens et al., 2003a; Warneck, 2003; Ervens et al., 2004a, b; Carlton et al., 2007). Analyses of cloud water samples have shown that 10–100% of highly soluble organic compounds (Henry’s law constant >104M atm−1) such as glyoxal, glycolalde-hyde and methylglyoxal are partitioned to the water phase (Limbeck and Puxbaum, 2000; van Pinxteren et al., 2005). Notably, the partitioning of these species can be described reasonably well based on thermodynamic equilibrium, i.e., within a factor of 0.6–3 (van Pinxteren et al., 2005) by appli-cation of Henry’s law.
In contrast, measurements of the partitioning of the same compounds (glyoxal, glycolaldehyde, methylglyoxal) be-tween aqueous particles (relative humidity (RH)<100%) and the gas phase reveal unusually large shifts in the parti-tioning towards particles. At RH∼80% (liquid water con-tent (LWC) ∼10 µg m−3), ∼30–90% of these semivolatile species were associated with the particle phase (Matsunaga et al., 2004, 2005; Bao et al., 2009). These deviations from predicted thermodynamic equilibrium are too large to be ex-plained by OA activity coefficients, which are thought to modify effective vapor pressures by less than one order of magnitude (Bowman and Melton, 2004). It seems rather likely that the enhanced partitioning to the particle phase is caused by the formation of high molecular weight prod-ucts (e.g., oligomers) which remain difficult to identify at the molecular level. A few models predict SOA formation due to partitioning of soluble organics (Griffin et al., 2005; Chen et al., 2007; Pun and Seigneur, 2007). However, the further chemical processing of organics that might explain the enhanced partitioning into the aqueous particles has not been systematically explored due to the lack of suitable re-action rate constants that describe chemical and/or physical processes in the concentrated aerosol aqueous phase as com-pared to cloud droplets.
sources; Stavrakou et al., 2009). Recent direct measurements of glyoxal over the oceans (Sinreich et al., 2010; Volkamer et al., 2010a) lend credibility to an additional ocean source (∼20–40 Tg/yr, Myriokefalitakis et al., 2008; M. Kanakidou, personal communication, 2010). Glyoxal is rapidly lost in the gas phase by OH-reactions, photolysis, and to a minor extent through dry and wet deposition; these processes cap the atmospheric lifetime of glyoxal at a few hours during the day (Volkamer et al., 2005; Sander et al., 2006).
In clouds and fog, SOA production from glyoxal pro-cessing is well established from both experimental studies (Karpel vel Leitner and Dor´e, 1997; Schweitzer et al., 1998; Altieri et al., 2006; Loeffler et al., 2006; Carlton et al., 2007) and modeling studies (Ervens et al., 2003a; Warneck, 2003; Ervens et al., 2004a; Lim et al., 2005; Sorooshian et al., 2006; Ervens et al., 2008), and forms between 5.5 Tg/yr (Fu et al., 2008) and 10 Tg/yr (Stavrakou et al., 2009) SOA on global scales. In contrast, SOA formation from glyoxal in aerosol particles is only recently becoming an increasingly active field of experimental research. Several recent labo-ratory studies have shown that glyoxal uptake into aqueous solutions of inorganic (e.g., ammonium (bi)sulfate) and or-ganic solutes (e.g., fulvic acid, dicarboxylic acids, amines, amino acids) is much more efficient than into pure water (Kroll et al., 2005; Liggio et al., 2005a, b; Corrigan et al., 2008; De Haan et al., 2009a, b, c; Galloway et al., 2009; Ip et al., 2009; Noziere et al., 2009a; Shapiro et al., 2009; Volka-mer et al., 2009). Product studies have shown the formation of oligomers and nitrogen-containing compounds. In very acidic particles (pH∼0), sulfate esters from glyoxal have been identified (Surratt et al., 2007). It has been suggested that these species are formed by oxidation reaction of the SO−4 radical and alkyl radicals (Noziere et al., 2010; Perri et al., 2010). Further, the formation of the glycolic acid sulfate has been observed under irradiated conditions on moderately acidic seeds (Galloway et al., 2009). Notably, the SOA for-mation rate is strongly accelerated in the presence of an OH radical source (Volkamer et al., 2009). Furthermore, experi-ments with increasing glyoxal aqueous phase concentrations (from µM to mM) have demonstrated that there is indeed a transition from ‘dilute aqueous phase chemistry’ with rela-tively simple oxidation products to more complex chemical processes at higher reactant concentrations that form oxi-dized, high molecular weight products (Altieri et al., 2006; Carlton et al., 2007; Tan et al., 2009). Glyoxal oligomer formation might even contribute to particle nucleation or ef-ficient growth of freshly nucleated particles (Wang et al., 2010).
Field evidence suggests that particle phase reactions could be responsible for 10–15% of the SOA formation in Mexico City (Volkamer et al., 2007). Early laboratory evidence for surface-controlled uptake of glyoxal to aerosols (Liggio et al., 2005a, b) resulted in global model estimates of the poten-tial role of SOA formation in aqueous particles that varied by more than an order of magnitude (0.95–10.4 Tg/yr) (Fu et al.,
Fig. 1. Reaction scheme of glyoxal reactions in the aqueous phase based on literature and data derived in the present study. The termi-nology of the processes refers to the processes as included in Table 2 and in the text; all rate constantskand equilibrium constantsKare defined in the Appendix. (I)keffuptrefers to lumped
parameteriza-tion of multiple dark processes (Sect. 3.1.); (II) shows all individual photochemical and dark processes discussed in Sects. 3.2 and 3.3.
2008, 2009; Stavrakou et al., 2009). However, other models did not quantify this glyoxal sink, recognizing the significant uncertainty in the physical and chemical understanding of the underlying processes (Myriokefalitakis et al., 2008).
While detailed chemical mechanisms for glyoxal forma-tion and loss in the gas phase (Bloss et al., 2005) and in cloud droplets (Ervens et al., 2003a, 2004a) are available, SOA formation in aqueous particles has not been explored in detail with models due to the lack of suitable reaction param-eters and mechanisms. The present study aims to close this gap by presenting (i) a theoretical description of chemical reactions in aqueous particles (Sect. 2); (ii) a comprehensive review of laboratory results, the discussion of their uncertain-ties and the derivation of a consistent set of reaction param-eters (Sect. 3), (iii) the implementation of this newly devel-oped aerosol module into an aerosol chemistry box model in order to explore the efficiency and sensitivities of glyoxal re-actions in aerosol water for SOA formation under atmospher-ically relevant conditions (Sect. 4), and (iv) a discussion of gaps in the current framework and needs of future studies (Sect. 5).
2 Framework of aqueous phase processes
2.1 Overview of processes
simplified process (I) is shown that represents a lumped ap-proach of glyoxal uptake under dark conditions and its sub-sequent particles phase reactions. The more detailed rep-resentation (II) includes individual chemical and physical processes that can be grouped into (1) reversible processes that lead to an equilibrium (uptake: KH, hydration: Khydr1, Khydr2, di-/oligomerisation Kdimer, Kolig), (2) irreversible processes that include (photochemical) oxidation, and oth-ers that form stable products (kOH,kphotochem,kNH4,kamine,
kaminoacid), (3) heterogeneous processes that occur on the sur-face of particles (γphotochem). These processes, together with their representation in models, are discussed in the following sections. All rate constantsk and equilibrium constantsK with their corresponding indices are defined in the Appendix.
2.2 Reversible processes: Henry’s law and aqueous phase equilibria
Reversible hydration reactions of aldehydes increase the sol-ubility beyond the physical solsol-ubilityKH[M atm−1] of pure aldehydes. In case of dialdehydes (e.g., glyoxal) the effective Henry’s law constant due to hydration is expressed as KHeff,hydr=KH(1+Khydr1·Khydr2) (1) withKHeff,hydr= effective Henry’s law constant (hydration) [M atm−1] and dimensionless hydration equilibrium con-stantsKhydr1 andKhydr2. These constants represent the ratio of hydration and dehydration rate constantskhydr [s−1] and k′hydr[s−1] according to
RCHO
(+H2O) khydr
−−−−−−−⇀ ↽−−−−−−−
k′
hydr
RH(OH)2 Khydr=khydr/ k′hydr (2)
Here it is proposed that a similar approach can be applied to additional processes that shift the partitioning of glyoxal towards the aqueous phase due to the self reaction (dimer formation).
KHdimer=KH(1+Kdimer) (3)
withKdimer= dimerization constant (dimensionless) describ-ing the ratio ofkdimerandkdimer′ .
RCH(OH)2+RCH(OH)2 kdimer
−−−⇀ ↽−−−
k′
dimer
(4) R-CH(OH)-O-CH(OH)-R+H2O
Dimerization of hydrated aldehydes (gem-diols) occurs by elimination of a water molecule resulting in a dimension-lessKdimerwith second-order rate constantskdimerandkdimer′ [M−1s−1] (Fig. 1). Further reaction steps similar to the dimerisation in Eq. (4) lead to oligomers, and the product of the additional equilibria can be lumped into a dimensionless oligomerization constantKolig. Similar to Eq. (3), an overall effective Henry’s law constantKH∗[mol kgH2O
−1atm−1] is
defined here that incorporates the uptake (KH)and all further oligomerization equilibria:
KH∗=KH(1+Kolig) (5)
Note that this terminology does not strictly follow the orig-inal definition of Henry’s law that describes the partitioning between gas and solute phase in dilute ideal solutions: (i) in-cluding oligomeric products implies that the stoichiometry of the forward reaction of organic formation processes is more complex than a linear relationship between gas and aque-ous phase concentrations as assumed by Henry’s law. (ii) In the context of glyoxal uptake, many experiments have been performed in seed particles with highly concentrated inor-ganic (e.g., ammonium sulfate, ammonium bisulfate) and/or organic (e.g., fulvic acid) aqueous solutions. These solutions are not ideal and thus, deviate strongly from the conditions for which Henry’s law is defined. (iii) While in many experi-mental studies, the partitioning of organic material is related to molar volumes (i.e. solute mass + water), in this study the approach by Volkamer et al. (2009) is adapted, and allKH∗ are reported on a molal basis [mol kgH2O−1atm−1], i.e. re-lated to water volume, not the total seed volume. While in di-lute solutions, it is not necessary to distinguish between mo-lal and molar concentrations as their difference is marginal, this is no longer true in concentrated aqueous aerosol parti-cles. Despite these deviations from the original definition of Henry’s law constants, throughout the present studyKH∗is used in analogy to past studies but refers to molality.
2.3 Multiphase processes: bulk reactions are rate-limiting
The production and loss rates of soluble species in the aque-ous phase are a combination of their phase transfer to/from the gas phase and their chemical production and loss (Paq andLaq[M s−1], respectively).
dCaq dt =kt ·
Cg−
Caq KH(eff)R T
+Paq−Laq (6)
with concentrations in the aqueousCaq[M] and gas phaseCg [atm], respectively and the mass transfer coefficientkt[s−1] that is a function of the drop radiusr[cm], gas phase diffu-sion coefficientDg [cm2s−1], mass accommodation coeffi-cientα(dimensionless) and mean molecular velocity< v > [cm s−1] (Schwartz, 1986).
kt= r2 3Dg
+ 4r
3 < v > α !−1
(7)
The phase transfer rate [atm s−1] of gas phase species with the partial pressurep [atm] to/from the aqueous phase de-pends on the amount of liquid waterwL[volaq/ volg] and can be expressed as
dp
dt = −wL·kt ·
p− Caq KH(eff)
Table 1. Summary of parameters that characterize the aqueous phase of cloud droplets and aqueous particles (RH<100%).
Parameter Cloud droplets Aqueous particles
Liquid water content LWC [g m−3] ∼0.1−1 ∼10−6−10−5
Diameter D [µm] ∼1−50 ∼0.01−1
Surface area of a particle (droplet) ∼10−6 ∼10−10
A =πD2[cm2]
Number concentration N [cm−3] ∼10−100 100–10 000 Surface/Volume of a particle (droplet) ∼104 ∼109 A /(π/6 D3)[cm−1]
Surface/Volume of an aerosol particle ∼105−106 ∼1011−1013 population A /(π/6 D3)·N [cm−1cm−3]
Lifetime ∼min ∼days
wherePgandLgare the chemical production and loss in the gas phase (Seinfeld and Pandis, 1998).
2.4 Reactive uptake: surface processes are rate-limiting
Heterogeneous processes that occur at the surface of droplets are often parameterized using a dimensionless reactive up-take coefficient γ that describes the probability that a gas phase molecule reacts with a dissolved species at the gas/aqueous interface. The first-order loss [s−1] of gas phase species with the concentrationCg [cm−3] can be described by
dCg dt =
1
4 ·γ ·A < v >·Cg (9)
withA= total surface area [cm2]. The production of aque-ous phase products can be directly equated to the loss of gas phase species. The parameterγ is usually smaller than the mass accommodation coefficientα (Eq. 7) since the latter only accounts for the “sticking probability” on the surface but not the subsequent reaction probability.
2.5 Differences of the aqueous phase of deliquesced particles and cloud droplets
While the processes as described in the previous section can occur in or on any aqueous phase in the atmosphere, differences in the abolsute rates can be expected for dilute cloud droplets and aqueous particles. The aqueous phase of cloud droplets and deliquesced particles differ significantly in terms of parameters that impact reaction rates of multi-phase and/or heterogeneous processes (Table 1): deliquesced particles usually exhibit mean diameters of up to a few hun-dreds of nm while cloud droplets can grow into sizes of sev-eral tens of µm with total LWCs [g m−3] that differ by about
five orders of magnitude as compared to deliquesced par-ticles. The interplay of bulk and surface processes in and on aqueous phases depends on the surface/volume ratio of the aerosol population [cm2cm−3] that is larger by ∼106– 107 for particles. The concentrations of dissolved particle constituents (e.g., sulfate or water-soluble organics) scale in-versely with the volume of the particles and droplets, result-ing in typical concentrations of∼M and∼µM in particles and clouds, respectively.
At subsaturated conditions (RH<100%) particles usually reach their equilibrium sizes and LWC is mostly determined by the amount of hygroscopic material and ambient RH. The formation and growth of cloud droplets depends on the su-persaturation that, in turn, is a function of the cooling rate and water vapor condensation onto particles. These dy-namic feedbacks determine the lifetime (∼several minutes) and sizes of cloud droplets.
3 Assessment of literature data
3.1 Surface vs. bulk limitation in the kinetics of glyoxal uptake
The approach shown in Eq. (9) has been used to interpret the uptake of glyoxal onto aqueous particles under dark con-ditions. With all other parameters known, the reactive up-take parameterγ had been fit to measured glyoxal losses in two experimental studies (Hastings et al., 2005; Liggio et al., 2005a, b) and is in agreement with uptake studies of other carbonyl compounds on various surfaces. The two values forγ derived from these studies differ by several orders of magnitude (γ∼10−7, Hastings et al. (2005);γ= 2.9×10⁻³, Liggio et al., 2005a). It has been speculated that the lower γ might have been caused by kinetic limitations due to very high glyoxal concentrations and accumulation of glyoxal at the particle surface (Hastings et al., 2005).
As an alternative approach to the surface-controlled up-take, in the following the results of the aforementioned stud-ies are interpreted as a direct uptake of glyoxal into the par-ticle phase. Comparing the increase in SOA mass (volume) in these experiments one can express the SOA formation rate as
d[SOA]
dt =keffupt[SOA] (10a)
The overall rate constantkeffuptrepresents a parameter that combines uptake processes and subsequent particle phase process(es). Since it can be assumed that the glyoxal loss is proportional to the increase of SOA mass, Eq. (10a) can be rewritten as
d[Gly]gas
Table 2. Summary of reaction parameters of glyoxal reactions in the aqueous phase that are reported in the literature or have been derived in the present study based on laboratory studies. All rate constantskand equilibrium constantsKare defined in the Appendix.
Reaction Equilibrium Rate constants Comment
constant forward/back reactionk,k′
uptake Glyoxal(g)↔Glyoxal(aq) KH,Hydr= 3×10⁵M atm−1 Betterton and Hoffmann, 1988
KH,Hydr= 4.19×10⁵M atm−1 Ip et al., 2009
KH,Hydr= 3.6×10⁵M atm−1 Zhou and Mopper, 1990
α= 0.023;Dg= 1.15 cm2s−1 Ervens et al., 2003a
(R1a) (CHO)2+ H2O↔ Khydr1= 350 khydr1= 7 s−1;khydr1′ = 0.02 s
−1 k′
hydr1:Wasa and Musha, 1970
CHOCH(OH)2
khydr1= 11 s−1;h′
hydr1= 0.03 s−1 khydr1=khydr1(methylglyoxal) Creighton et al., 1988 (R1b) CHOCH(OH)2+ H2O↔ Khydr2= 207 khydr2= 4 s−1;khydr2′ = 0.02 s
−1 assuming lifetime of hydrates to be
(CH(OH)2)2 the same for both hydrates
khydr2= 6.5 s−1;k′hydr2= 0.03 s
−1 assuming lifetime of hydrates to be the same for both hydrates
(R2) Gly + Gly(a) K
dimer= 0.56 M−1 kdimer∼10−4M−1s−1; Fratzke and Reilly, 1986
k′
dimer∼1.8×10⁻⁴s−1(pH = 2)(b)
kdimer∼10−3M−1s−1;
kdimer′ ∼1.8×10⁻³(pH = 5)(b)
kdimer∼10−2M−1s−1;
kdimer′ ∼1.8×10⁻²s−1(pH = 7)(b) (R3) Gly + CHOCH(OH)2↔ Kolig= 1000 kolig= 100 M−1s−1;k′olig= 0.1 M
−1s−1 this work, based on experiments
oligomers + H2O by Volkamer et al. (2009)
(R4a) Glyoxal (gas)→SOA – keffupt= 5×10⁻⁴s−1 this work, based on experiments
by Volkamer et al. (2009)
(R4b) – keffupt= 1.3×10⁻⁴s−1 this work, based on experiments
by Hastings et al. (2005)
(R4c) – keffupt= 3.7×10⁻⁴s−1 this work, based on experiments
by Liggio et al. (2005a, b)
(R5) Gly + OH – kOH= 109M−1s−1 Ervens et al., 2003b
(R6) Gly +hν/OH→ – 1.5 s−1< kphotochem<18 s−1(non-hygrosc SOA) this work,
oxidized oligomers 0.8 s−1< k
photochem<7 s−1(hygrosc SOA) depending on seed composition (Fig. 3), based on experiments by
Volkamer et al., 2009 (R7) Gly→SOA 0.01< γphotochem<0.03 (non-hygrosc. SOA) This work; upper limit
0.005< γphotochem<0.012 (hygrosc. SOA) for surface processes derived on ammonium sulfate/fulvic acid particles (R8) Gly + NH4+→Products – kNH4= 1.3×10⁻⁷M−1s−1(pH = 2)(c) Noziere et al., 2009a
kNH4= 2.4×10⁻⁴M−1s−1(pH = 5)(c)
kNH4= 0.43 M−1s−1(pH = 7)(c)
(R9) CHOCH(OH)2+ glycine→ – kaminoacid= 0.12 M−1s−1 De Haan et al., 2009a
Products(d) kaminoacid= 0.09 M−1s−1
CHOCH(OH)2+ serine→ kaminoacid= 4.5×10⁻⁴M−1s−1
Products(d)
CHOCH(OH)2+ arginine→
Products
(R10) CHOCH(OH)2+ CH3NH2 – kamine= (0.3±0.1) M−1s−1 D. De Haan,
personal communication, 2009
(a)Gly denotes the sum of unhydrated glyoxal, monohydrate and dihydrate; (b)the data fork
dimerare those reported in the original literature;kdimer′ are calculated based onKdimer(Eqs. 11–13). Note that in the expression as applied in the current study according to (R3), allkdimershould be multiplied with 207 (Khydr2), cf. text;
(c)assuming an ammonium activitya NH4= 1 M;
(d)these reactions only occur with the unprotonated form of the amino acids, (pK
a1(glycine) = 2.35;pKa2(glycine) = 9.78;pKa1(serine) = 2.19;pKa2(serine) = 9.21 (Lide, 2009)).
mechanism (II) as discussed in the following sections. Notably, fitting the observed glyoxal loss rates or ob-served SOA mass formation rates (Hastings et al., 2005; Liggio et al., 2005a; Volkamer et al., 2009) leads to a narrow range of 1.3×10⁻⁴s−1< keffupt<5×10⁻⁴s−1 (Table 2) despite very different glyoxal concentrations (∼1 ppb<(CHO)2(g)<∼100 ppm), and aerosol size dis-tributions and loading (∼0.7 µm3cm−3− ∼20 µm3cm−3). This suggests that the surface area of the aerosol
constants of individual processes or reactive uptake coeffi-cients. It gives neither any information on the nature of the kinetically-limiting step for organic mass formation (phase transfer or subsequent particle phase reactions) nor on the underlying chemical mechanisms, reactants and products. In addition, keffupt only numerically describes glyoxal uptake and oligomer formation and thus implies an irreversible pro-cess. As it will be shown in Sect. 3.2, this assumption might lead to an overestimate of the net SOA production from dark oligomerization reactions, since it has been experimentally observed that these processes are reversible.
However, this approach is a very compact and simpli-fied representation of glyoxal uptake and subsequent SOA formation in aqueous particles whose applicability needs to be evaluated for a wider range of experimental conditions (aerosol loading, composition, water content, importance of reversible character (“back reaction”) etc).
The apparent absence of a surface process suggests that the application of Eq. (9) in model studies to evaluate SOA for-mation in aqueous solution as it has been done recently (Fu et al., 2008, 2009; Stavrakou et al., 2009) might be misleading. However, it will be shown in Sect. 3.3.1 that – depending on the solutes present in the aqueous particles – the description of glyoxal uptake as a pure bulk process might not be cor-rect either under all conditions and a more complex interplay between bulk and surface processes can occur.
3.2 Reversible glyoxal uptake
3.2.1 Henry’s law constants and hydration
Three measurements of the effective solubility (KHeff,hydr) of glyoxal are available in the literature (Betterton and Hoff-mann, 1988; Zhou and Mopper, 1990; Ip et al., 2009) (Ta-ble 2). The lower limitKHeff,hydr= 3×10⁵M atm−1 (Better-ton and Hoffmann, 1988) is in good agreement with the more recent study that reportsKH= 4.19×10⁵·exp[(62.2×10³/R)· (1/T – 1/298)] M atm−1in pure water (Ip et al., 2009). The value in sea waterKHeff,hydr= 3.6·105M atm−1is very sim-ilar to the values in pure water, in agreement with trends for other small aldehydes that show only minor differences in KHeff,hydr in fresh and sea water (Zhou and Mopper, 1990). The hydration constants that are included inKHeff,hydr (Eq. 1) areKhydr1= 207 andKhydr2= 350 (Ruiz-Montoya and Rodriguez-Mellado, 1994, 1995). These values, together with the constant given by Betterton and Hoffmann (1988), have been used to determine the physical solubility of gly-oxalKH= 5 M atm−1(Eq. 1) (Schweitzer et al., 1998). How-ever, theKHeff,hydrvalue measured by Ip et al. (2009) might be more appropriate for pure water systems and results in a higher value,KH= 5.8 M atm−1that is used in the current study.
In several recent studies, it has been shown that the unhy-drated aldehyde group is more reactive towards various re-actants (e.g., amino compounds) than an alcohol group in the gem-diol (Barsanti and Pankow, 2005; De Haan et al., 2009a, c). In order to correctly describe such processes in a multiphase system, the monohydrate fraction of glyoxal has to be known at any given time. To date, there is no direct measurement of the hydration kinetics of glyoxal available. However, there appears to be enough information to estimate the rate constants for hydration and dehydration of glyoxal (Eq. 2): Based on polarographic studies, the decay of the monohydrate under neutral conditions has been determined as k′hydr1 = 0.02 s−1 (Wasa and Musha, 1970). This yields a formation constant of khydr1 (= Khydr1·khydr1′ )= 7 s−1, in good agreement with the hydration constant for methylgly-oxal (khydr= 11 s−1, (Creighton et al., 1988)). Assuming that the resulting lifetime for the monohydrate is the same for the dihydrate, values forkhydr2= 4 s−1 andk′hydr2= 0.02 s−1can be determined (Table 2).
3.2.2 Dimer formation of glyoxal
Glyoxal concentrations in the atmospheric dilute aqueous phase (cloud/fog droplets) are in the range of µM (Igawa et al., 1989). If aqueous glyoxal concentrations exceed∼1 M dimerization becomes likely (Fratzke and Reilly, 1986) (Kdimer, Fig. 1). In a computational study, it has been shown that the dioxolane ring (dimer monohydrate) is the thermo-dynamically and kinetically most favored structure (Kua et al., 2008). Thermodynamical calculations suggest that with increasing glyoxal amounts at a given water mass (= high glyoxal/water mass ratios) not only dimers but also trimers (and their hydrates) will be abundant and contribute to or-ganic mass (Barsanti and Pankow, 2005). Whereas the equi-librium constant of the dimerizationKdimeris not pH depen-dent, the rate constant of the dimer decay (kdimer′ )shows a strong pH dependence (Reaction R2, Table 2) (Fratzke and Reilly, 1986). In this latter study, the dimerization rates Rdimer have been derived assuming that any two forms of glyoxal [Glytotal], i.e., unhydrated and hydrated (mono-, di-hydrate), can react to form a dimer:
Rdimer= [Glytotal]2·kdimer,total (11) with rate constants 1.7×10⁻⁵M−1s−1
<kdimer,total<5.6×10⁻³M−1s−1
(3<pH<7). However, recognizing that theoretical studies suggest that the monohydrate is the most reactive species (Barsanti and Pankow, 2005; Kua et al., 2008), the rate con-stants by Fratzke and Reilly are expressed in the present study as a combination of the monohydrate concentration [(CHOC(OH)2)], and [Glytotal]
Table 3. Effective Henry’s law constants derived in experimental studies. Note that all constants are converted to a molal basis [mol kgH2O
−1atm−1] and, thus, differ from the constants in the original literature. The dimensionless oligomerization constantK olig
has been derived based on Eq. (5) (Sect. 2.2).
Solute KH∗[mol kgH2O
−1atm−1] Solute molarity [M] Reference K
H∗ Kolig
(NH4)2SO4 (1.5±0.4)×108 1.8–2.1 Galloway et al., 2009 1500
(NH4)2SO4 (1.0±0.2)×108 2.4–7.6 Kroll et al., 2005 1000
(NH4)2SO4/H2SO4 (7.7±4.2)×107 1.2–3.2 Kroll et al., 2005 770
NaCl 1.9×10⁶ 0.05 Ip et al., 2009 4.5
1.1×10⁶ 4 2.6
Na2SO4 2.4×10⁷ 0.01 Ip et al., 2009 57
Na2SO4 >3×10⁸ 5 Corrigan et al., 2008 720
Since the monohydrate concentration contributes only ∼0.5% (Khydr1−1= 1/207) to the total glyoxal in aqueous solution, the rate constants in Eq. (11) and Eq. (12) are con-nected by
kdimer,total·207=kdimer (13)
resulting in 0.0035 M−1s−1< kdimer<1.2 M−1s−1(3<pH <7). Using the equilibrium constant (Kdimer= 0.56 M−1, Fratzke and Reilly, 1986), the decay rate constant of the dimer is in a range of 0.006 s−1< kdimer′ <2 s−1over this pH range.
3.2.3 Effective glyoxal partitioning into (NH4)2SO4
seed: formation of oligomers and other high molecular weight products
Dark reactions of glyoxal in (NH4)2SO4solutions form gly-oxal trimers or larger oligomers and other high molecular weight products. Aerosol mass spectrometer (AMS) and UV/vis absorption spectra of the resulting SOA mass show that the main fraction of products are exclusively composed of carbon, hydrogen and oxygen, i.e., they do not contain any heteroatoms (Galloway et al., 2009; Shapiro et al., 2009). Reaction times of several days revealed additional products with even more glyoxal monomer units. The glyoxal uptake calculated from these experiments was higher by some or-ders of magnitude than uptake into pure water (Kroll et al., 2005; Galloway et al., 2009; Ip et al., 2009; Volkamer et al., 2009). Experiments conducted in the dark (Kroll et al., 2005, Galloway et al., 2009) reached an equilibrium state, i.e., no further increase in organic aerosol mass was observed after several hours. Upon dilution of the reaction chamber, the organic-to-sulfate mass ratio decreased which implies a re-versible mass formation mechanism (Galloway et al., 2009). The same oligomeric structures have been observed in ex-periments in ammonium solutions (Noziere et al., 2009a, b); the reaction mechanism suggested in that study implies a cat-alytic role of ammonium by acting as a Bronsted acid. Small contributions of C-N containing compounds cannot be
ex-cluded based on these experiments and have been identified as direct reaction products of the ammonium ion and glyoxal (Sect. 3.3.2).
In Table 3, effective Henry’s law constantsKH∗ from var-ious studies in seed particles are summarized. The values do not show any trends for different experimental conditions (RH, solute concentration etc.). The comparison ofKH∗ and KHeff,hydrshows that the former is about 1000 times larger which yieldsKolig= 1000 (Eq. 5). This value suggests that 1000 times more oligomers are present than monomer oxal and is considerably higher than the estimate of 10% gly-oxal oligomers (corresponding toKolig∼0.1) assumed in a recent modeling study that explored particle phase processes (Pun and Seigneur, 2007) which was based on laboratory ex-periments for chemical systems different than glyoxal (Gao et al., 2004).
3.2.4 Kinetic treatment of oligomerization in (NH4)2SO4seed
mass formation in the experiments is kolig= 100 M−1s−1. Together with the equilibrium constantKolig= 1000, the ef-fective rate constant for the decay of oligomers is determined as k′2ndolig=kolig/Kolig= 0.1 M−1s−1 which translates into a first-order rate constant ofk′olig∼5.5 s−1([H2O] = 55 M). The order of magnitude of this value agrees withk′dimerbased on (Fratzke and Reilly, 1986) (kdimer (pH ∼5.5) ∼2 s−1, Sect. 3.2.2). While Fratzke and Reilly (1986) only de-scribe the decay of the dimer, the parametersKolig,kolig, and k′oligrepresent lumped values that include possibly multiple oligomerization steps. The fact that the rate constantskdimer′ andkolig′ agree reasonably well suggests that the decay rate constant of higher oligomers (trimer, tetramer, etc) is on the same order of magnitude as that for the dimer.
In Fig. 2, the formation rate of oligomers is shown us-ing these parameters (kolig,kolig′ )and including the hydration constants (khydr1,khydr1′ ,khydr2,k′hydr2). The equilibrium for both the (di)hydrate and oligomer formation is reached af-ter∼3–4 h. This is in excellent agreement with even longer experiment times that showed an increase in mass formation for about three hours and a constant mass concentration af-terwards (Kroll et al., 2005; Galloway et al., 2009).
3.2.5 Effective partitioning of glyoxal into aqueous NaCl seed particles
Corrigan et al., (2008) and Ip et al. (2009) have investigated the partitioning of glyoxal into aqueous NaCl seed particles at different salt concentrations. In these studies, no kinetic information was reported so only the equilibrium constant Kolig can be determined. The experiments show a less pro-nounced increase in glyoxal uptake as compared to aqueous (NH4)2SO4particles. The reported KH∗ values (converted into molar units) are higher by factors of 4–6 compared to up-take on pure water (Ip et al., 2009) resulting in 3< Kolig<5 on NaCl seed (Table 3). Notably, the conversion of the origi-nal data by Ip et al. (2009) from molar into molal units gives twoKH∗values that do not show any dependence on the so-lute concentration, in agreement with data for ammonium sulfate seeds. Experiments on nearly dry, solid NaCl par-ticles (RH∼16%, water content∼2%) have been interpreted as glyoxal uptake onto an aqueous layer rather than processes in a bulk solution (Corrigan et al., 2008) and thus noKoligare reported in Table 3.
3.2.6 Effective partitioning of glyoxal into aqueous Na2SO4seed particles
Similar experiments have been performed on Na2SO4 particles (Corrigan et al., 2008; Ip et al., 2009). At a concentration of [Na2SO4] = 0.01 M (∼dilute droplets), KH∗= 2.4×10⁷mol kgH2O
−1atm−1 has been determined. At higher solute concentrations (0.15 M; RH>95%), KH∗ values exceeded 109mol kgH2O
−1atm−1 (Ip et al., 2009). The very efficient glyoxal uptake on
Fig. 2. Predicted concentration profiles glyoxal monohydrate CHOC(OH)2, dihydrate (CH(OH)2)2and oligomers as a function
time. The time scale to reach equilibrium is due to the kinetics of the hydration processes (khydr1,khydr1′ ,khydr2,khydr2′ )and the
oligomerization (Kolig=kolig/kolig′ ; cf Sects. 2.2 and 3.2.3).
Na2SO4 particles has been confirmed by experiments at nearly dry conditions (RH = 15%) with a lower limit of KH∗>3×10⁸mol kgH2O
−1atm−1 (Corrigan et al., 2008) and translate into Kolig>700. For completeness, these lower limits ofKH∗andKoligon Na2SO4particles are listed in Table 3. Even though glyoxal interactions with Na2SO4 might not be of great atmospheric relevance, the comparison of data in Table 3 shows that the nature of the seed aerosol impacts glyoxal uptake in a complex way. However, the paucity of data on different seeds means that this effect cannot be systematically evaluated yet.
3.3 Irreversible glyoxal uptake
3.3.1 Photochemical processes
Experimental evidence
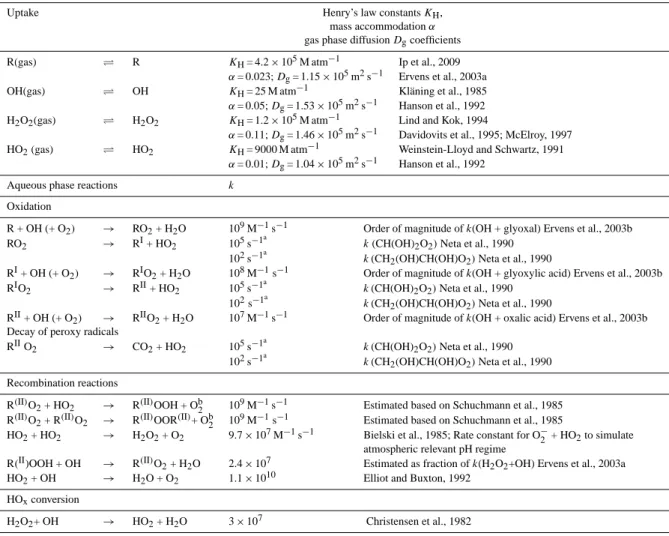
Table 4. Reaction scheme used to assess the fate of organic peroxy radicals (RO2)in the aqueous phase of cloud droplets and aerosol particles
(Fig. 6); R(I I )O2, R(I I )OOR(I I ), R(I I )OOH denote the sum of all organic peroxy radicals, organic peroxides and organic hydroperoxides,
respectively.
Uptake Henry’s law constantsKH,
mass accommodationα gas phase diffusionDgcoefficients R(gas) ⇋ R KH= 4.2×10⁵M atm−1 Ip et al., 2009
α= 0.023;Dg= 1.15×10⁵m2s−1 Ervens et al., 2003a OH(gas) ⇋ OH KH= 25 M atm−1 Kl¨aning et al., 1985 α= 0.05;Dg= 1.53×10⁵m2s−1 Hanson et al., 1992 H2O2(gas) ⇋ H2O2 KH= 1.2×10⁵M atm−1 Lind and Kok, 1994
α= 0.11;Dg= 1.46×10⁵m2s−1 Davidovits et al., 1995; McElroy, 1997 HO2(gas) ⇋ HO2 KH= 9000 M atm−1 Weinstein-Lloyd and Schwartz, 1991
α= 0.01;Dg= 1.04×10⁵m2s−1 Hanson et al., 1992 Aqueous phase reactions k
Oxidation
R + OH (+ O2) → RO2+ H2O 109M−1s−1 Order of magnitude ofk(OH + glyoxal) Ervens et al., 2003b RO2 → RI+ HO2 105s−1
a
k(CH(OH)2O2)Neta et al., 1990 102s−1a
k(CH2(OH)CH(OH)O2)Neta et al., 1990
RI+ OH (+ O2) → RIO2+ H2O 108M−1s−1 Order of magnitude ofk(OH + glyoxylic acid) Ervens et al., 2003b RIO2 → RII+ HO2 105s−1
a
k(CH(OH)2O2)Neta et al., 1990 102s−1a k(CH2(OH)CH(OH)O2)Neta et al., 1990
RII+ OH (+ O2) → RIIO2+ H2O 107M−1s−1 Order of magnitude ofk(OH + oxalic acid) Ervens et al., 2003b Decay of peroxy radicals
RIIO
2 → CO2+ HO2 105s−1
a
k(CH(OH)2O2)Neta et al., 1990 102s−1a k(CH
2(OH)CH(OH)O2)Neta et al., 1990 Recombination reactions
R(II)O2+ HO2 → R(II)OOH + Ob2 109M−1s−1 Estimated based on Schuchmann et al., 1985 R(II)O2+ R(II)O2 → R(II)OOR(II)+ Ob2 109M−1s−1 Estimated based on Schuchmann et al., 1985
HO2+ HO2 → H2O2+ O2 9.7×10⁷M−1s−1 Bielski et al., 1985; Rate constant for O−2 + HO2to simulate atmospheric relevant pH regime
R(II)OOH + OH → R(II)O
2+ H2O 2.4×10⁷ Estimated as fraction ofk(H2O2+OH) Ervens et al., 2003a HO2+ OH → H2O + O2 1.1×10¹⁰ Elliot and Buxton, 1992
HOxconversion
H2O2+ OH → HO2+ H2O 3×10⁷ Christensen et al., 1982
aSee Fig. 3a–c and Fig. 3d–f for sensitivity study for this rate constant;bno other products of the recombination reactions are considered due to the lack of appropriate data.
identified under dark conditions and in the absence of OH. It is suggested that they are formed through a radical-initiated mechanism since they are composed of oxidation products of glyoxal, e.g. glyoxylic acid and oxalic acid.
First evidence that photochemistry of glyoxal enhances the rate of SOA formation in aqueous aerosols was presented by Volkamer et al. (2009). They observed that in the pres-ence of OH radicals and UV light, the rate of volume growth from glyoxal was 2–3 orders of magnitude faster as com-pared to the volume growth due to organic mass formation under dark conditions. They further found a seed effect on SOA yields, and demonstrated that under variable RH con-ditions and for aqueous seeds (ammonium sulfate, ammo-nium bisulfate, fulvic acid and mixtures of ammoammo-nium sul-fate/fulvic acid) the yields scaled with the LWC of the par-ticles. The much slower SOA formation rate in absence of an OH radical source (Galloway et al., 2009) and the find-ings by Volkamer et al. (2009) and Tan et al. (2009) suggest
that indeed a radical-initiated process (or several processes) are likely to accelerate SOA formation by glyoxal multiphase photochemistry in particles. It can be concluded that the re-action mechanism in atmospheric aqueous particles proceeds via different reactions than in (dilute) cloud droplets, and forms product patterns that are much more complex. In par-ticular, it is not expected that simple scaling of dilute cloud chemistry by the difference in LWC can describe the chem-istry in concentrated aerosol aqueous phase.
Differences in peroxy radical chemistry in dilute and concentrated solutions
Henry’s law constants), further chemical processing in the aqueous phase might lead to different products if nonvolatile species are formed. Thermodynamic equilibrium might be only reached upon the kinetic time scale of the uptake and if aqueous phase loss rates are slow enough to compensate con-tinuous transport from the gas phase. These species accumu-late in the aqueous phase and build up higher concentrations more quickly in the small particle volumes. Each oxidation step includes the formation of an intermediate peroxy radi-cal (RO2, RIO2, RIIO2). These radicals either decay to the oxidation product and HO2(von Sonntag and Schuchmann, 1991) or recombine with HO2or RO2. While the decay leads to oxidation products (RI, RII), the accumulation of peroxy radicals in a smaller water volume favors the recombination in aqueous particles. The recombination of any organic per-oxy radical leads to an increase in carbon atoms in the prod-ucts with oligomer-like structures.
For model simulations using the mechanism in Table 4, constant gas phase precursor concentration [R]gas= 300 ppt; [OH]gas= 5×106cm−3are assumed that are typical for urban environments. In Fig. 3, concentration profiles are shown for oxidation products and RO2recombination products for typ-ical conditions in cloud droplets and aqueous particles based on the simplified scheme in Table 4. These results suggest that the physical differences listed in Table 1 favor the for-mation of organic peroxides R(II)OOR(II) in particles. The literature values for the decay rate constant for organic hy-droxy peroxy radicals differ by several orders of magnitude (Neta et al., 1990) (Table 4). In order to explore this param-eter, Fig. 3a–c and d–f compare resulting concentration pro-files for decay rates of 105s−1and 102s−1, respectively. The concentration levels of R(II)OOR(II) and R(II)OOH are sig-nificantly impacted which demonstrates that the lifetime of the peroxy radicals in aerosol water is a sensitive parameter that is currently poorly constrained by experiments. The con-centration levels of the peroxides R(II)OOR(II)and R(II)OOH should be regarded as upper limits since it is assumed that they are exclusively formed by the recombination reactions, and pathways that do not lead to the termination of the radical chain are not considered due to the poor knowledge on per-oxy radical chemistry in the aqueous phase. Another result from Fig. 4 is that the OH radical concentration in aqueous aerosols, in contrast to clouds, does not experience any sig-nificant kinetic barrier towards uptake of OH radicals from the gas phase. This results in aqueous phase OH radical con-centrations that are about two orders of magnitude higher than in cloud water, leading to accordingly greater rates of RO2radical production, and much greater formation rates of stable products in aerosol water.
3.3.2 Numerical simulation of photochemical chamber
experiments
In order to empirically derive the total SOA formation effi-ciency of all reactions that lead to products other than the
OH-oxidation products, box model simulations have been performed to derive kinetic parameters for the organic mass formation rates as observed in photochemical experiments (Volkamer et al., 2009). The model has been initialized with the experimental conditions (glyoxal, OH concentrations, RH, mass loading). The water content of the seed aerosol has been calculated by the aerosol inorganic model (AIM) (Clegg and Brimblecombe, 1998). Two different assumptions have been made for simulations A and B (see below) regarding the hygroscopicity of the newly formed organic mass: (i) the mass is not hygroscopic and the observed volume increase is only due to organic mass formation, (ii) the newly formed or-ganic mass has a hygroscopicity parameterκ= 0.24 (Petters and Kreidenweis, 2007). This value corresponds to a com-pound with molecular weight M= 150 g mol−1 (e.g., mix-ture of glyoxal dimers and trimers) and a density of 2 g cm−3 (Volkamer et al., 2009), which are roughly in agreement with other highly oxygenated SOA constituents. In these model assumptions, the observed volume increase is due to organic mass formation and additional water uptake by this mass. The density of glyoxal trimer dihydrate is about 15% lower (1.67–1.71 g cm−3)(De Haan et al., 2009b; Galloway et al., 2009), and use of this smaller density results in a slightly larger volume prediction by the model. While the density of SOA from glyoxal is currently not well known, it is not re-garded a major uncertainty in the model. In the simulations, effects of highly concentrated solutions are simulated in de-tail and activity coefficients of unity are assumed. It should be noted that the current approach does not claim to fully ac-count for the underlying physical and chemical processes but it is rather an empirical representation of such processes in models based on the current knowledge in glyoxal reactivity. Refinements on the proposed parameters should be made as more systematic laboratory data becomes available.
In order to relate experimentally observed SOA mass to the known oxidation chemistry in the aqueous phase, the sim-ulations using the reaction scheme in Table 4 have been re-peated for experimental conditions ([Glyoxal]gas= 160 ppb; [OH] = 2.2×107cm−3). Figure 3g–i shows the predicted concentration profiles of radicals, oxidation products and re-combination products of simulations using OH and glyoxal concentrations similar to those in the experiments. Due to the high glyoxal concentration, OH is rapidly consumed in the aqueous phase resulting in a concentration that is about an order of magnitude lower than its equilibrium concentra-tion. Even if the OH transport into the aqueous phase was not limited, i.e. thermodynamic equilibrium was reached at any given time, the products could not explain the SOA vol-umes of∼10 µm3cm−3as observed in the∼5 min-long ex-periments (additional scale in Fig. 3h and i) (Volkamer et al., 2009).
Radicals Stable oxidation products Recombination
I. [Gly] = 300 ppt [OH] = 5·106 cm-3
RO2 CO2 + HO2 k = 105 s-1
II. [Gly] = 300 ppt [OH] = 5·106 cm-3
RO2 CO2 + HO2 k = 102 s-1
III. [Gly] = 160 ppb [OH] = 2.2·107 cm-3 Reactions as in I. Size distributions as in experiments by Volkamer et al., 2009
S
O
A
vo
lu
m
e
[
µ
m
3 cm -3]
S
O
A
vo
lu
m
e
[
µ
m
3 cm -3 ]
S
O
A
vo
lu
m
e
[
µ
m
3 cm -3]
Fig. 3. Predicted concentration profiles of aqueous phase concentrations reactive intermediates (radicals) (a, d, g), stable oxidation products (b, e, h) and recombination products (c, f, i) simulated with the reaction scheme in Table 4. “Cloud” refers to dilute aqueous phase conditions with drop diametersD= 20 µm, LWC = 0.4 g m−3,Ndroplets= 100 cm−3; “particle” to a more concentrated aqueous phase with aqueous
particles with diametersD= 100 nm, LWC = 20 µg m−3,Nparticles= 5000 cm−3. Top panel (a–c): the decay rate of peroxy radicals has been assumed as 105s−1(Table 4) (Neta et al., 1990). Middle panel (d–f): the decay rate of peroxy radicals has been assumed as 102s−1(Table 4) (Neta et al., 1990). Bottom panel (g–i): same mechanism and rate constants as for top panel but initial gas phase concentrations as used in experiments by Volkamer et al. (2009) ([Glyoxal]gas= 160 ppb; [OH]gas= 2.2×107cm−3). [OH]aq=f (t )includes the kinetic description
of OH transfer into the aqueus phase (as used for all other simulations); [OH]aq= const. assumes a constant OH concentration that implies
thermodynamic equilibrium with the gas phase at all times [OH]aq=KH(OH)·[OH]gas(Sect. 3.3.1).
water. Second, the observed SOA is not mainly composed of the products suggested by the reaction scheme in Table 4 but other products predominate. Such additional products likely include high molecular weight species (oligomers) such as those that have been identified in recent studies (Tan et al., 2009; Lim et al., 2010) and their formation is not included in the scheme in Table 4. It is evident that the concentration of SOA products (RI, RII, R(II)OOR(II)) increases with a higher OH concentration. However, the Henry’s law constant for OH in aqueous particles is not well
Table 5. Parameters of linear correlations of predicted vs. observed (Volkamer et al., 2009) SOA volumes (Fig. 4) for pure ammonium sulfate and ammonium sulfate/fulvic acid seed and different assumptions about SOA hygroscopicity. The model to predict SOA mass only includes OH(aq) + Gly(aq) reactions as applied to dilute aqueous conditions (cf Simualtion A in Sect. 3.3.1). VSOA (observed)a=a+b·[VSOA
model(OH reaction)]; correlation coefficientsR2and number of experimentsn.
Seed aerosol a b R2
Ammonium sulfate Non-hygroscopic SOA n=4 1.6 720 0.60 Hygroscopic SOA 1 290 0.82
Ammonium sulfate/Fulvic acid Non-hygroscopic SOA n=6 5.1 2250 0.72 Hygroscopic SOA 0.95 870 0.86
aV
SOAfrom experiments by Volkamer et al. (2009)
Fig. 4. Comparison of observed volume increase in photochemical experiments (Volkamer et al., 2009) and predicted volume increase due to the aqueous phase reaction of glyoxal and OH (Reaction R5, Table 2, Sect. 3.3.1 “Simulation A”) as previously applied to di-lute aqueous phase conditions (“cloud droplets”). Open symbols (non-hygroscopic SOA) imply that the observed volume increase was only due to SOA formation; filled symbols (hygroscopic SOA) refer to the assumption that observed volume increase is caused by formation of hygroscopic SOA and additional water uptake by this mass.
3.3.3 Numerical description of additional photochemical process(es)
Simulation A. In order to numerically describe chamber
ex-periments of glyoxal uptake into particles, in a first step, a box model has been applied that only included “cloud chem-istry”, i.e., glyoxal dissolution, and its reaction with OH(aq) (Reaction R5). It has been assumed that the total glyoxal concentration (which is >99% composed of glyoxal dihy-drate) reacts with OH. For simplicity, it was assumed that glyoxal oxidation yields 100% non-volatile products. This is compatible with laboratory experiments, where most of the initial total organic carbon was conserved in the bulk
wa-ter phase (Tan et al., 2009). In Fig. 4, the predicted organic aerosol volume is compared to the observed volumes in the experiments. Results are shown for both hygroscopicity as-sumptions (κorg= 0;κorg= 0.24) of the newly formed organic mass.
In order to quantify the discrepancy between SOA pre-dicted by the OH reaction and observed SOA, parameters of linear correlations for ammonium sulfate and ammonium sulfate/fulvic acid seeds are summarized in Table 5. (For the other seeds only two or three experiments were available and a linear correlation might not be meaningful). The enhance-ment in the mixed ammonium sulfate/ fulvic acid particles is about a factor of three higher than in pure ammonium sul-fate particles which points to an additional effect on SOA formation by fulvic acid. It is obvious that the direct reac-tion of OH radicals with glyoxal can only explain a small fraction (<1%) of the observed SOA mass (slopes of linear correlations in Fig. 4). The predicted aqueous phase SOA is found to scale linearly with the observed SOA (Table 5). As-suming hygroscopic SOA mass, the small intercepts of the linear correlations (0.95<a<5.1), and good correlation co-efficients (R2>0.8) suggest that SOA formation in aerosol water is indeed linked to OH chemistry. Notably, the calcula-tions assuming hygroscopic SOA consistently show a smaller intercept, and a higherR2value, indicating that this scenario is more plausible.
It seems unlikely that the presence of high solute concen-trations alters the kinetics of the glyoxal oxidation by OH (ionic strength effects) by the more than two orders of mag-nitude required to explain this discrepancy between the pre-diction of the “dilute aqueous phase chemistry” model and observed mass formation rates. Kinetic studies of similar systems (OH reaction with acetone, propanol or butanol) have shown that ionic strength effects can only account for an increase of a factor∼2 of the bimolecular rate constant kOH (Herrmann, 2003). Instead of such effects, it is rather suggested that additional chemical processes occur that con-tribute to organic mass formation.
Simulation B. The model has been extended by an
Table 6. Rate constantskphotochemand reactive uptake coefficientsγphotochemfor the additional photochemical process that has been added
to the box model to match observed and predicted SOA volume increase (Fig. 4a and c). “Exp” refers to the experiment numbers in the study by Volkamer et al. (2009). Simulation B and C are explained in Sect. 3.3.1. kaveragephotochemandγphotochemaverage denote average values±standard deviation for each seed aerosol composition and hygroscopicity assumption of the newly formed SOA. Note that the parameterskphotochem
andγphotochemhave been derived from photochemical experiments with high OH concentrations (≥107cm−3). It is likely that the reaction parameters are smaller at lower OH (hν)concentrations.
Non-hygroscopic SOA Hygroscopic SOA Non-hygroscopic SOA Hygroscopic SOA
Bulk process: Simulation B Surface process: Simulation C
Exp. kphotochem k average
photochem kphotochem k average
photochem γphotochem γ average
photochem γphotochem γ average photochem [s−1] [s−1] [s−1] [s−1]
Fulvic acid 19 1.2 1.5±0.4 0.7 0.8±0.1
14 1.7 0.8
Ammonium 13 2 4±3 1.1 2±1
sulfate 9 3 1.5
18 4.5 2.2
7 8 2.8
Ammonium 17 7.7 18±7 3.2 7±3 0.01 0.016±0.007 0.005 0.008±0.003
sulfate/fulvic 11 13 6 0.013 0.006
acid 27 23 9.4 0.012 0.012
26 13.5 5 0.013 0.0065
12 25 9.5 0.017 0.008
20 23 11.5 0.03 0.012
Ammonium 23 2.9 9±5 1.6 4±2 Bisulfate 8 12.4 5
21 12 6.3
Amm Bisulfate/ 24 1 5±5 0.5 2±2 Fulvic acid 22 8.5 4
“excess SOA” observed in the photochemical experiments by Volkamer et al. (2009) that cannot be explained by the model application as outlined in Simulation A. This rate constant is an empirical description of an additional process (or multiple processes) in the presence of OH andhν. It can as yet not unequivocally be decided if this process is actually driven by photons or OH, or other radicals whose formation path-ways might not be fully captured by the scheme in Table 4. However, the linear correlations of predicted and observed SOA mass from OH chemistry (Fig. 4; Table 5) are consis-tent with a radical initiated process. For each experiment, the rate constantkphotochem [s−1] was chosen to match the observed organic mass and thus to account for the discrep-ancy between the observed and predicted (assuming dilute aqueous phase chemical processes) SOA masses in Fig. 4 (Table 6). The resultingkphotochem from the model simula-tions for hygroscopic SOA are about a factor of two smaller than those for non-hygroscopic SOA since (i) the observed volume growth is due to both organic mass formation and additional water and (ii) the additional water on the particles provides more volume where glyoxal can be taken up and react. The hygroscopicity of photochemical glyoxal-SOA is currently not known, and these model studies set bounds on the actual value ofkphotochem. Since it seems likely that glyoxal-SOA is indeed hygroscopic because of its highly ox-idized state (O/C≥1),kphotochemvalues that account for
wa-ter uptake (κ >0) seem more appropriate for atmospheric applications. The dependence ofkphotochem on the different seeds cannot be fully explained; however, some trends can be identified. While the comparison ofkphotochem((NH4)2SO4) and kphotochem(NH4HSO4) suggests that the particle phase reaction is faster in more acidic conditions, this relation-ship breaks down for mixed particles composed of ammo-nium sulfate/fulvic acid and ammoammo-nium bisulfate/fulvic acid that exhibit the opposite trend inkphotochem. The enhanced kphotochemfor mixed fulvic acid particles as compared to pure fulvic acid particles suggests that fulvic acid can react with glyoxal but pure fulvic acid particles contain too little water to fully dissolve. More laboratory work will be required to understand the trends of the reactivities in seed of different chemical composition.
mass increase does not correlate with the total amount of seed (solute mass + water) (Fig. 5b). In Fig. 5c, the possibility that photochemical uptake is controlled by a surface-limited pro-cess is explored. For most seed types, there is no correlation with aerosol surface area. The exception is mixed ammo-nium sulfate/fulvic acid seed particles, for which a positive correlation is observed (R2= 0.82). A similar trend is ob-served for the pure fulvic acid seeds, but there are too few data points to draw firm conclusions. The fact that this cor-relation is significantly tighter than that found for the bulk process on ammonium sulfate/fulvic acid particles suggests that the description of SOA formation on these seed particles might be dominated by a surface process.
Simulation C. This evidence for reactive uptake onto
am-monium sulfate/fulvic acid surfaces exposed to UV light and OH radicals has been further explored using the frame-work in (Eq. 9). Reactive uptake coefficients that repro-duce the experimental results are in the range of 0.01< γphotochem<0.03, with an averageγphotochem= 0.016±0.007 if SOA is assumed non-hygroscopic. These values are re-duced by a factor of 2 for hygroscopic SOA with a range of 0.005< γphotochem<0.012 and averageγphotochem= 0.008± 0.003 (Table 6). This is 2–3 times higher than the effec-tiveγ values reported for urban aerosol (e.g., Volkamer et al., 2007), and about 5–15 times higher than for ammonium sulfate particles in laboratory studies. The apparent agree-ment in previous studies ofγ= 3.7×10⁻³ (Volkamer et al., 2007),γ >2.3×10⁻³ (Liggio et al., 2005a) and γ >10−3 (Schweitzer et al., 1998) might have been fortuitous (Volka-mer et al., 2007). Previous experimentally derived reactive uptake coefficients have been determined under dark condi-tions (Schweitzer et al., 1998; Liggio et al., 2005b) and, thus, the higherγphotochem as derived here might be due to pho-toinduced effects. In addition, the observed mass increase in the photochemical experiments is likely a combination of both bulk and surface processes and the values derived as kphotochem andγphotochem should be considered upper limit estimates. However, based on the current data set, it is not possible to isolate the contributions of the individual surface-and bulk controlled processes.
The experiments of Volkamer et al. (2009) were performed with gas phase OH concentrations on the order of 107– 108cm−3; no apparent dependence on the OH concentration was observed over this range. This suggests that at the per end of atmospheric OH concentrations, the glyoxal up-take does not appear to be limited by OH radicals. However, it seems unlikely that photochemical SOA formation would not depend on light intensity/radical concentration at all. In lack of more detailed data, it is suggested thatkphotochemand γphotochem be scaled for atmospheric model applications in a way thatkphotochem= 0 and γphotochem= 0 at no (or weak) photochemical activity; and the constants in Table 6 should be only used at the highest photochemical activity ([OH] ∼107cm−3).
Fig. 5. Observed SOA volumes in the experiments by Volkamer et al. (2009) as a function of (a) water mass associated with seed aerosol; (b) total seed mass (water + seed); (c) total seed surface. The lines depict linear correlations for ammonium sulfate and am-monium sulfate/fulvic acid particles.
3.3.4 Glyoxal reaction with the ammonium ion
to SOA formation compared to oligomerization. An empir-ical expression of an overall second-order rate constant for the reaction of glyoxal with ammonium as a function of pH and ammonium activity (aNH4)reveals strong pH and
con-centration dependence (Reaction R8, Table 2) (Noziere et al., 2009a).
3.3.5 Glyoxal reactions with amines and aminoacids
In solutions of methylamine (De Haan et al., 2009c) and amino acids (glycine, serine and arginine, De Haan et al., 2009a), SOA formation from glyoxal has been observed to yield imidazoles and oligomers in agreement with ammo-nium salt experiments but also light-absorbing melanoidins. Glycine and serine only react in their anion form, and thus glyoxal conversion is most efficient at high pH in agree-ment with the trends observed in the ammonium catalyzed oligomer formation. The rate constant is similar to that of small amino acids (glycine, serine) (Table 2). The reac-tion between glyoxal and arginine occurs over the whole pH range. All amino acids and methylamine only react with the monohydrate of glyoxal.
Both amines and amino acids can comprise a few mass percent of the organic fraction of ambient aerosol (Russell, 2003). Amino acids have not been measured in the gas phase; concentrations for amines are reported in the range of 0.3– 6 ng m−3(Gibb et al., 1999). Thus, the amounts of gas phase amino compounds that are converted into SOA upon uptake into the particle phase will be negligible. The reactions with particulate nitrogen compounds should increase SOA mass by “trapping” glyoxal in the particle.
4 Sensitivity studies of SOA formation under atmospheric conditions
4.1 Model description
The box model that has been used to simulate laboratory ex-periments (Sect. 3) only included a very limited chemical mechanism and the reaction parameters (k, γ ) of an “un-known” newly formulated process that was constrained by laboratory results. In this section, all the reaction parameters shown in Fig. 1 (II) and Table 2 are included in a more ex-tended chemistry box model which is applied to evaluate the efficiency and sensitivities of the chemical processes for a set of atmospherically-relevant initial conditions.
The model represents a simplified version of a parcel model that has been used previously to simulate chemical and microphysical processes in clouds (Feingold and Kreiden-weis, 2000; Ervens et al., 2004a). It describes the water up-take of aerosol particles (∼10 nm< Ddry<∼2 µm) at a given RH according to K¨ohler theory. However, unlike these prior modeling studies, in the current study, particles reach their equilibrium sizes and no dynamical processes accounting for competition for water vapor are considered which might be a
suitable approximation for particles exposed to RH<100%. For gas phase species other than water vapor (OH, glyoxal), thermodynamic equilibrium is not necessarily reached, de-pending on their uptake time scales and their loss rates in the aqueous phase. All particles are assumed to be liquid, i.e., in their metastable state above their efflorescence RH. The mass and water content of the particles is assumed to remain constant during the whole simulation, i.e., the contribution of the newly formed SOA mass to water uptake is neglected (cf. Sect. 3.3.1). This assumption is made in order to be able to clearly separate the contributions of the individual processes over the simulation time and to avoid any feedbacks on reac-tion rates due to varying water content: e.g., the reacreac-tion rates described bykNH4,kamine,kaminoacidare dependent on solute
concentrations and thus might become less important if the particles grow and become more dilute. This simplification might not hold in the atmosphere; however, the motivation of the current section is to identify key parameters that impact glyoxal-SOA formation in an idealized system.
The rate constant kphotochem is scaled with the OH con-centration following the discussion in Sect. 3.3.1. The pho-tolysis rate of glyoxal and the OH concentration are time-dependent as a function of the zenith angle. The OH con-centration varies between∼104cm−3and 6×106cm−3over the course of the day ([OH] = 0 at night).The uptake of gases (glyoxal, OH) into the aqueous particles is described by the same kinetic approach as used for cloud droplets (Eq. 6 and Eq. 7, Table 2) (Ervens et al., 2004a, 2008) using mass ac-commodation coefficientsα, Henry’s law constantsKH and gas phase diffusion coefficientsDg. Due to the lack of ap-propriate data for uptake into highly concentrated solutions, the same uptake parameters as on pure water surfaces are applied (Table 2). This assumption might lead to an underes-timate of the uptake rate into particles as it has been shown that the reactive uptake parametersγ usually increase with ionic strength (Schweitzer et al., 1998; Davidovits, 2006). However sinceαonly encompasses the physical process of trace gas accommodation on the surface andγ also includes the chemical loss of the respective trace gas in the particle phase, the contribution of an increasedαto the enhanced re-active uptake parameterγcannot be evaluated.
4.2 Model simulations
4.2.1 Initial conditions
Table 7. Input parameters for the box model used to evaluate SOA formation from glyoxal under atmospheric conditions. These model simulations include all reaction parameters in Table 2; results are shown in Fig. 6.
Simulation Mass Aerosol composition RH loading
I 5 µg m−3 Ammonium sulfate 75% base case (photochemistry) IIa 1 µg m−3 Ammonium sulfate 75%
IIb 10 µg m−3 Ammonium sulfate 75% IIIa 5 µg m−3 Fulvic Acid 75% IIIb 5 µg m−3 Ammonium bisulfate 75% IIIc 5 µg m−3 Ammonium sulfate/Fulvic acid 75%
IV 5 µg m−3 Ammonium sulfate 75% Photochemical processes parameterized byγphotochem
Va 5 µg m−3 Ammonium sulfate 30% Vb 5 µg m−3 Ammonium sulfate 50% Vc 5 µg m−3 Ammonium sulfate 90%
Only dark processes (kphotochem= 0;γphotochem= 0)
VI 5 µg m−3 Ammonium sulfate 75% base case (dark) VIIa 5 µg m−3 Ammonium sulfate 75% pH = 2
VIIb 5 µg m−3 Ammonium sulfate 75% pH = 4 VIIc 5 µg m−3 Ammonium sulfate 75% pH = 7
VIIIa 5 µg m−3 Ammonium sulfate 75% khydr1=k(R1b),k′hydr1=k′(R1b) khydr2=k(R1b) ,khydr1′ =k′(R1b) VIIIb 5 µg m−3 Ammonium sulfate 75% Instantaneous equilbrium
of photochemistry vs. night time chemistry, (vi) particle pH, (vii) time scales of hydration kinetics are explored. The con-ditions for these model runs are summarized in Table 7.
The simulations are performed over twelve hours, start-ing at 06:00 a.m. or 06:00 p.m., to simulate day or night time chemistry, respectively. In a first set of simulations, a con-stant glyoxal concentration is assumed (300 ppt) in order to explore sensitivities of SOA formation to a variety of param-eters. This concentration is at the lower end of urban con-ditions, as observed in Mexico City (Volkamer et al., 2006). In a second set of simulations, the impact of particle phase chemistry on glyoxal life time is explored by assuming a closed system that includes gas phase losses by photolysis and OH reactionkOH(gas), in addition to particle chemistry (Sect. 4.2.3).
4.2.2 SOA formation with constant glyoxal concentration
In Fig. 6, predicted SOA masses are shown as a function of various parameters (Table 7). The reaction volume changes with increasing amount of hygroscopic aerosol mass, and thus the amount of SOA that can be formed in the particles increases proportionally with the amount of aerosol water (Fig. 6a). The fact that the increase in SOA is indeed lin-ear with increase in seed and water mass confirms that there is no limitation in the glyoxal uptake kinetics which is in
agreement with the findings in Fig. 3 for low glyoxal concen-trations as atmospherically-relevant. Additional model simu-lations were performed with the same total mass, distributed over different size distributions (not shown). The predicted SOA mass did not significantly vary as compared to the re-sults in all panels in Fig. 6.


![Table 3. Effective Henry’s law constants derived in experimental studies. Note that all constants are converted to a molal basis [mol kg H 2 O −1 atm −1 ] and, thus, differ from the constants in the original literature](https://thumb-eu.123doks.com/thumbv2/123dok_br/16419471.195117/8.892.140.748.166.324/effective-constants-experimental-constants-converted-constants-original-literature.webp)