e-Polymers 2008, no. 012 http://www.e-polymers.orgISSN 1618-7229
Surface Characterization of Absorbing Polymer Films
Deposited on Transparent Glasses
Débora Gonçalves,1* Silmar A. Travain,2 José A. Giacometti,3 Eugene A. Irene4
1* Instituto de Física de São Carlos, Universidade de São Paulo, CP 369, 13560-970,
São Carlos - SP (Brazil); e-mail: [email protected].
2
Departamento de Física, Universidade Federal de Ouro Preto, 35400-000, Ouro Preto-MG (Brazil); e-mail: [email protected].
3
Faculdade de Ciências e Tecnologia, Universidade Estadual Paulista, CP 467, 19060-900, Presidente Prudente - SP (Brazil); e-mail: [email protected].
4
University of North Carolina at Chapel Hill, Department of Chemistry, CB#3290, 27599-3290 Chapel Hill - NC (USA); e-mail: [email protected].
(Received: 20 June, 2007; published: 9 January, 2008)
Abstract: PANI films were deposited on glass substrates by in-situ polymerization and characterized by UV-VIS spectroscopy and atomic force microscopy. A method is developed to accurately analyze ellipsometric data obtained for transparent glass substrates before and after modification with absorbing polymer films. Surface modification was made with an overlayer such as polyaniline (PANI), which exhibits different optical properties by varying its oxidation state. First, the issue of using transparent substrates for ellipsometry studies was examined and then, spectroscopic ellipsometry was used to characterizeabsorbing overlayers on transparent glasses. The same methodologies of data analysis can be also applied to other absorbing films on transparent substrates, and deposited by different techniques.
Introduction
Thin films analyzed by spectroscopic ellipsometry (SE) are usually deposited on opaque substrates in order to remove complications associated with multiple reflections and depolarization of light that occur for transparent substrates. However, the use of transparent substrates in unavoidable, since important applications, such as electrochromic and light emitting devices, and spectroelectrochemical studies of conducting polymers require transparent substrates.
Recent reports [1-6] about how thin films of a conjugated, conducting polymer, polyaniline (PANI), are adherent and conductive when deposited on inorganic particles, textiles and a variety of solid substrates, such as transparent glass and flexible poly(ethylene terephthalate), broadens its applicability on sensors and electronic devices. A common method of preparation of these PANI films is by immersing a solid substrate in the reaction medium containing both monomer and oxidant. The polymerization initiates by adsorption of oligomers on the substrate surface, followed by nucleation, and growth of a polymer film [3]. This process is called in situ adsorption polymerization since the film thickness (or reaction yield) increases with the reaction time [4-6].
[6]. However, accurate interferometry requires film optical properties; profilometry is dubious for most polymer films because they are usually soft, and AFM works well for ultra-thin polymer films that have appropriate steps [7]. Spectroscopic ellipsometry (SE) emerges as an alternative technique that can be used to obtain thickness (L), refractive index (n) and extinction coefficient (k) of overlayers on substrates including transparent glasses [8-12].
The advantage of SE over other techniques for analysis of surfaces and interfaces is that SE is a nondestructive and noninvasive technique, no special requirements on the sample preparation is necessary, and measurements can be made in minutes [8, 9]. However, data analysis requires the establishment of an optical model. In addition, conducting polymer films on transparent substrates present analysis problems, because these films are absorbing over a wide spectral range, and there are few data analysis methods applicable for determining the optical properties of polymer/transparent substrate systems. In this study, the interpretation of ellipsometric data is first performed on transparent substrates, borosilicate crown glass (BK7) plates, and then, on absorbing films on the transparent substrates.
Results and discussion
Transparent glasses
Ellipsometry measures the changes in phase (Δ) and amplitude (Ψ) between the p and s components of polarized light, thus expressed as the complex reflection coefficient,ρ=tan(Ψ)e(iΔ) [8-12].
0 20 40 60 80 100
θB
θB
a)
Rp Rs
Reflec
tan
c
e (
R
)
(%
)
0 10 20 30 40 50 60 70 80 90
0 90 180 270 360
Angle of incidence (θo) / degrees
b) δrp
δ
rs
Ph
as
e s
h
if
t
(
δr
)/
de
gr
ees
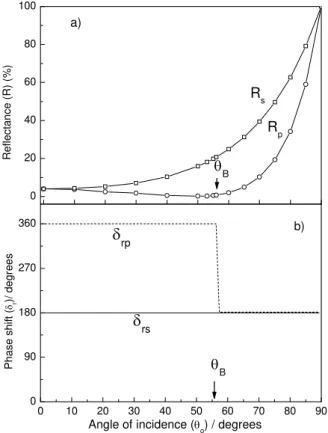
The reflectance (Rp and Rs) and phase difference (δrs and δrp) for the s- and
p-components of light as a function of θ0 (angle of incidence) can be calculated for a
glass substrate with a defined index of refraction.
Figure 1 shows how the reflectance (a) and phase shift (b) vary with the angle of incidence for a glass with n = 1.50 at an air/glass interface, and calculated by using the Fresnel coefficients for the p and s components of the reflected light for a single interface between medium 0 (ambient) and medium 1 (substrate) [8-12].
250 300 350 400 450 500 550 600 650
6 8 10 20 22
4.5 4.0 3.5 3.0 2.5 2.0
s
a a s
θo = 62o θ
o = 70 o
Ψ
(
degr
ees)
Wavelength (nm)
a)
Energy (eV)
50 55 60 65 70
0 30 60 90 120 150 180
4.0 eV (310 nm) 3.6 eV (344.4 nm) 3.0 eV (413.3 nm) 2.5 eV (496 nm)
Δ
/
deg
rees
φ / degrees
c) 0
5 10 15 20 25
Ψ
/ d
egr
e
es
b)
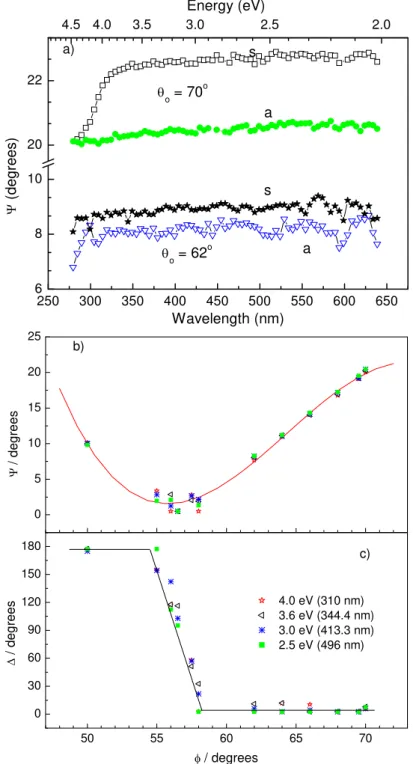
Fig. 2. Experimental values of: a) Ψ at θ0 = 70o and 62o for a BK7 glass substrate: (s)
In Figure 1a, it can be noticed that Rs increases monotonically with θ0, and Rp is close to zero at θB, that is in this case 56.3 . The phase difference, B δ
o
rs, is constant at
180 , independent of o θ0, and δrp is constant at 360 for o θ0 < θBB, the Brewster angle,
and 180o for θ0 < θB (Figure 1b). Therefore, when a glass substrate is analyzed by
ellipsometry, the phase shift, obtained as Δ = δ
B
rp - δrs, varies from 0 to 180 , and at
values of θ
o o
0 very close to θBB, Δ is very close or equal to 90
o. This allows one to obtain θB for any type of glass substrate through varying B θ0 as will be described here for a
BK7 glass slide.
As the incident light transverses a transparent substrate, reflection occurs at both top and backside interfaces. After multiple reflections, the reflected light beams are retarded with respect to one another. As such, if the s- component is totally reflected, the p- component travels further. If a substrate is transparent, the light reflected from its backside is in general not in phase with the light reflected from its topside, and light depolarization may occur. Abrading and blackening the backside of the glass slide is useful to suppress (or reduce) effects of internal reflections [13].
We obtained the values of phase (Δ) and amplitude (Ψ) of polarized light reflected by a BK7 glass at different angles of incidence, 55o, 56o, 57o, 62o, 64o, 66o, 68o, and 70o. All these data were obtained for smooth (s) and abraded (a) backside surfaces. For clarity in Figure 2a, we only show the Ψ vs energy spectra for a BK7 sample at two angles of incidence, θo,62o and 70o.
From Figure 2a, two effects are noteworthy. First, there is a difference for the values of Ψ above a wavelength of 325 nm for the smooth (s) and abraded (a) glasses, but as θo is nearer to θB, the B Ψ values are closer (we obtained θBB = 56.5
o for BK7 glass).
The substantial decrease in Ψ below 325 nm at θo = 70o indicates that the glass
absorbs in this optical energy region. In other words, the intensity of the reflected beams from the glass backside decreases at shorter wavelengths where the glass is opaque, and the values of Ψ are close for both smooth and abraded glass (see that Ψ = 20o at 275 nm, θo = 70o). As θ0 is chosen (here, 62o) near θB, the differences in
the Ψ data for both smooth and abraded glasses are smaller because the effect of light depolarization is very small or zero at θ
B
0 < θBB [14].
Figures 2b and 2c show how the values of Ψ and Δ vary with the angle of incidence, θo, at fixed values of energy (or wavelengths). For clarity, we show only four values of
energy, 4.0, 3.6, 3.0, and 2.5 eV. The first information taken from these figures is the value of the Brewster angle, θB, that is 56.5 at Ψ = 0 and Δ = 90 . As discussed
above, the values of Δ vary abruptly from 0 to 180 within a narrow range of angles near θ
B
o o
o o
BB. The values of Ψ are close to zero at θ0≅θB allowing one to obtain B θBB for any
optical glass.
The results of Ψ and Δ allowed us to obtain a database for a BK7 substrate, after including a thin overlayer (a Cauchy layer) of about 18 nm in the model in order to obtain good fits of the data. This database was used for modeling the optical properties of PANI films on glass. Additionally, other parameters can be also obtained by SE for a transparent substrate such as index of refraction, n, and, Abbe number (vd) that is the reciprocal of the dispersive power (ratio of the dispersion to
Absorbing films on a transparent glass
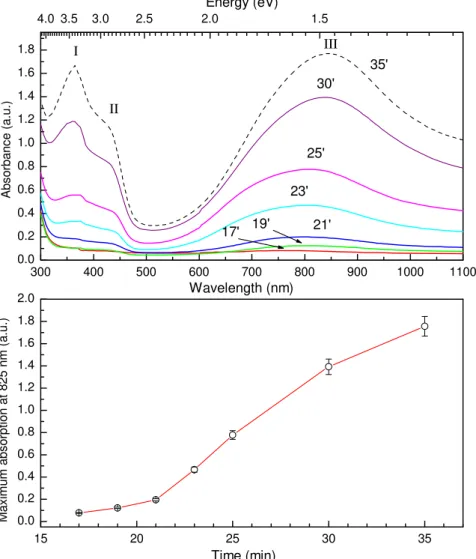
Polyaniline (PANI) films deposited on glass substrates were analyzed by UV-VIS spectroscopy as shown in Figure 3a.
300 400 500 600 700 800 900 1000 1100
0.0 0.2 0.4 0.6 0.8 1.0 1.2 1.4 1.6 1.8
15 20 25 30 35
0.0 0.2 0.4 0.6 0.8 1.0 1.2 1.4 1.6 1.8 2.0
4.0 3.5 3.0 2.5 2.0 1.5
25'
23'
21' 19'
17'
A
bs
or
b
anc
e (
a
.u.
)
Wavelength (nm) 30'
35' I
II
III
Time (min)
M
a
x
im
um
ab
s
or
p
ti
o
n at
82
5 n
m
(
a.
u.
)
Energy (eV)
Fig. 3. a) UV-VIS spectra of PANI films prepared at different reaction times; b) maximum absorption at 825 nm for PANI films taken out the reaction medium at different time intervals.
The absorption spectra of the PANI samples showed three bands at about 362 nm (I), 420 nm (II) and 830 nm (III), which are typical of protonated, salt PANIs, according to results previously reported in the literature [17]. The absorption at band
III shifts to longer wavelengths (ca 10-20 nm) with the reaction time because of an
For time intervals higher than 30-35 min, the absorbance may exhibit oscillatory values, and depends strongly on the aniline concentration used in the in situ film deposition. Previous results [3, 4] indicated that two processes dominate in the in situ
polymerization of aniline, adsorption (surface) polymerization and precipitation, the latter that occurs in the bulk phase; adsorption by a film growing on a solid substrate is a fast process taking place after a period of induction, which varies according to solutions, substrates, and temperatures used during the synthesis [3]. In our case, we expect that ultra thin PANI films are formed on the substrate surfaces 20 and 25 min after starting the polymerization reaction. After about 30 min, it is expected that the film thickness does not vary considerably with the reaction time.
The morphological analysis of PANI films taken from the reaction medium at different time intervals indicates a partial recovery of the substrate surface with nuclei 15 min after starting the polymerization reaction.
For clarity, we show in Figure 4a-d only four AFM images of PANI films prepared at different reaction times. After about 20 min, the substrate is almost totally covered by a dense pack layer, which is better seen in images c) and d) of Figure 4.
a) b)
c) d)
Fig. 4. AFM images of BK7 glass substrates recovered with PANI films prepared at different reaction times: a) 17 min, b) 19 min, c) 23 min, and d) 27 min.
600 500 400 300
2.0 2.5 3.0 3.5 4.0
60 70 80 90 100 110 Δ (degr ees) E (eV) 55o 55o 57o 57 55o o 10 15 20 Ψ (degre e s ) 55o 56o 57o 55o PANI-30 Wavelength (nm)
600 500 400 300
2.0 2.5 3.0 3.5 4.0
60 70 80 90 100 57 57 Δ ( deg re es ) E (eV) 55o 56o 57o 55o o o 12 15 18 21 Ψ (d eg re e s ) 55o 56o 57o PANI-35 Wavelength (nm)
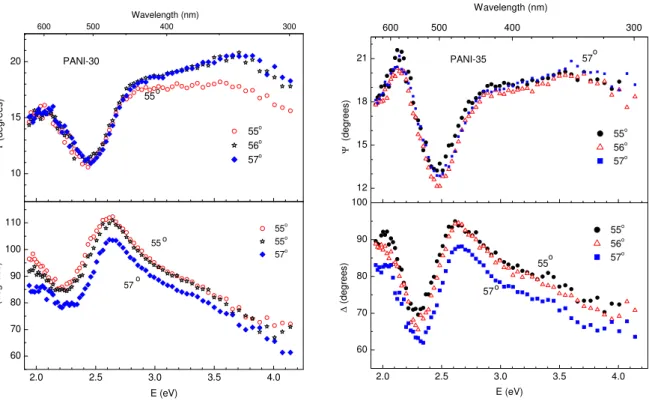
Fig. 5. Experimental values of amplitude (Ψ) and phase (Δ) as a function of energy/wavelength for PANI-30 and PANI-35 films at different angles of incidence.
2 3 4 5 6 7
0 20 40 60 80 100 120 140 160 180 Δ ( degr ees ) Ψ (degrees) 55o 56.5o 57.5o a) PANI-20
4 6 8 10 12 14 16
0 20 40 60 80 100 120 140 160 180 55o 56.5o 57.5o Δ (deg re es) Ψ (degrees) b) PANI-25
10 12 14 16 18 20 22
60 70 80 90 100 110 120 55o 57.5o Δ (de g re es) Ψ (degrees) c) PANI-30
12 14 16 18 20 22
40 50 60 70 80 90 100 110 120 Δ ( degrees)
Ψ (degrees)
55o
57.5o d)
PANI-35
The shape features for curves a) and b) from Figure 5 are very close to that one obtained for bare glass substrates, thus indicating that the PANI-20 and PANI-25 films exhibit low values of thickness, that makes it more difficult to accurately model these data by SE. For thicker films (PANI-30 and PANI-35), the Ψ-E and Δ-E trajectories show a characteristic profile, that is typical of PANI films deposited on opaque substrates, such as Pt [18] and specular stainless-steel electrodes [19]. In Figure 6, we show the Δ-Ψ trajectories for these films at different angles of incidence. For films obtained at longer reaction times, such as PANI-30 and PANI-35, the parameters Ψ and Δ exhibit more defined values and elliptical form curves.
For PANI films on transparent substrates, the SE analysis is not straightforward because these films are absorbing over all measured spectral range. Besides, there is no database available and similar to that one of a film such as PANI. In this case, it is a difficult task to create a database for relatively thick PANI films, such as those obtained by AFM from 100 to 200 nm, once these films are highly absorbing. Another option is to use both SE and transmittance data as we have done here.
We proposed the use of an isotropic model, the Lorentz oscillator model, for analyzing SE data for PANI films on BK7 plates, similarly to previously reported for PANI films on Pt [18] specular stainless-steel substrates [19], and poly-o -methoxyaniline films on p-type Si wafers [20]. The mean square error (MSE) was below 19 and considerable acceptable.
3.8 3.6 3.4 3.2 3.0 2.8 2.6 2.4 2.2 2.0 1.0
1.1 1.2 1.3 1.4 1.5
0.40 0.45 0.50 0.55 0.60 0.65 0.70
350 400 450 500 550 600
Index of refracti
on (n)
Energy (eV)
E
x
ti
nct
ion
coeffi
ci
ent (K
)
Wavelength (nm)
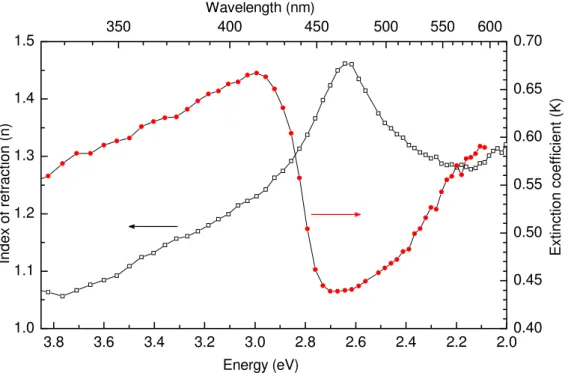
Fig. 7. Index of refraction (n) and extinction coefficient (k) as a function of energy/wavelength for a PANI-30 film deposited on a BK7 glass substrate (abraded backside). The model was fitted from results obtained at the angles of incidence of 70o, 56,5o and 62o.
of SE data for thin films, such as PANI-20 and PANI-25, was not accurate enough since their values of amplitude (Ψ) and phase (Δ) of polarized light were very close to those of bare substrate, as shown above in Figure 6.
For a PANI film immersed in the reaction medium for 30 min (PANI-30), we obtained a thickness of 165.9 nm and for a thicker film (PANI-35), 185.4 nm, that are concordant with AFM: PANI-21, 65.2 nm, PANI-45, 188.3 nm, and PANI-90, 186.5 nm. We verified by using different aniline concentrations and immersion times that the maximum absorbance does not vary significantly for films immersed 90 min after staring polymerization of aniline. Thus it can be also expected that there is no variation of the thickness for films at longer immersion times because a saturation of the film grow take places.
Conclusions
The experimental results obtained by spectroscopic ellipsometry (SE) for transparent glasses are affected by internal reflections from the backside of glass, particularly at θ0>θB. Abrading theB backside avoids this problem, as is verified by our results of Ψ vs
wavelength. For absorbing polymer films on transparent glass, a database needs to be created for the substrate, and modeling can be done using both optical transmission and SE data with a model which includes for example Lorentz oscillators. Thin films are difficult to be analyzed because their optical properties are very similar to those of bare glasses. However, SE enables one to obtain optical parameters (n and k) and thickness of PANI films on glass plates similarly to those on opaque substrates, such as Pt or Au electrodes, where the SE analysis is simplified.
Experimental part
Borosilicate crown glass (BK7) (Schott optical glass) plates (36x14x1 mm), previously cleaned with the RCA methodology, were used as substrates for the chemical deposition of polyaniline (PANI) films. The BK7 substrates have been surface and electrical characterized as described in the literature [21] and manufacturer homepage. PANI films on BK7 plates were prepared after different times of immersion of the plates in the reaction medium by in situ adsorption polymerization, which also yields a precipitate (not analysed here) [22].
The polymerization medium of aniline was an aqueous solution with 0.11 mol L-1 aniline in 1.0 mol L-1 HCl at 0 oC. The oxidizer, ammonium persulfate, (NH4)2S2O8,
was added to the reaction medium at a 4:1 aniline:oxidizer molar ratio upon stirring at 0 oC. Several BK7 substrates were adapted to the polymerization vessel allowing deposition of PANI on their surfaces. The BK7 substrates were taken out of the reaction medium at different times; after that, they were washed with an aqueous 0.1 mol L-1 NH4OH solution for deprotonation of PANI.
Surface morphology was studied by a Nanoscope IIIa (Digital Inst.) atomic force microscope (AFM) in the tapping mode.
Acknowledgements
The authors acknowledge support by the National Science Foundation (NSF). DG acknowledges the Brazilian agencies FAPESP, CAPES and CNPq.
References
[1] Sapurina, I.; Riede, A.; Stejskal, J. Synth. Met. 2001, 123, 503.
[2] Job, A.E.; Herrmann, P.S.P.; Vaz, D.O.; Mattoso, L.H.C. J. Appl. Polym. Sci. 2001,
79, 1220.
[3] Sapurina, I.; Federova, S.; Stejskal, J. Langmuir 2003, 19, 7413.
[4] Orlov, A.V.; Kiseleva, S.G.; Yurchenko, O.Y.; Karpacheva, G.P. Polymer Science A
2000, 42, 1292.
[5] Sapurina, I.; Osadchev, A. Y.; Volchek, B.Z.; Trchová, M.; Riede, A.; Stejskal, J.
Synth. Metals 2002, 129, 29.
[6] Stejskal, J.; Sapurina, I.; Prokeš, J.; Zemek, J. Synth. Metals 1999, 105, 195.
[7] Lobo, R.F.M.; Pereira-da-Silva, M.A.; Raposo, M.; Faria, R.M.; Oliveira Jr., O.N.
Nanotechnology 1999, 10, 389.
[8] Gonçalves, D.; Irene, E.A. Quim. Nova 2002, 25, 794. [9] Irene, E.A. Thin Solid Films 1993, 233, 96.
[10] Azzam, R.M.A.; Bashara, N.M. In Ellipsometry and Polarized Light (2nd edn). Elsevier: Amsterdam, 1987.
[11] Tompkins, H.G. A User’s Guide to Ellipsometry, Academic Press; Boston, 1993. [12] Tompkins, H.G.; Irene, E.A.; (eds.) Handbook of Ellipsometry, William Andrew Pub.; NY, 2005.
[13] Tompkins, H.G.; Smith, S.; Convey. D.; Surf. Interface Anal. 2000, 29, 845.
[14] Johs, B.; Woollam, J.A.; Herzinger, C.M.; Hilfilker, J.; Synowicki, R.; Bungay, C.L.; in
Optical Metrology, Critical Reviews of Optical Science and Technology, CR72, Soc.
Photo-Optical Inst. Eng., Washington, USA, 29-58, 1999.
[15] Born, M.; Wolf, E. Principles of Optics (7th edn). Cambridge Univ. Press, 1999. [16] Hecht, E. Optics (2nd edn). Addison-Wesley, 1989.
[17] Gonçalves, D.; dos Santos Jr., D.S.; Mattoso, L.H.C.; Karasz, F.E.; Akcelrud, L.; Faria, R.M. Synth. Metals, 1997, 90, 5.
[18] Cruz, C.M.G.S.; Ticianelli, E.A. J. Electroanal. Chem., 1997, 428, 185.
[19] Al-Attar, H.A.; Al-Alawina, Q.H.; Monkman, A.P. Thin Solid Films, 2003, 429, 286.
[20] Shrestha, R.P.; Yang, D.; Irene, E.A. Thin Solid Films, 2006, 500, 252.
[21] Cumbo, M.J.; Fairhurst, D.; Jacobs, S.D.; Puchebner, B.E. Appl. Optics, 1995,
34, 3743.