BGD
9, 13243–13286, 2012
Impact of an 8.2-kyr-like event on
methane emissions in northern peatlands
S. Z ¨urcher et al.
Title Page
Abstract Introduction
Conclusions References
Tables Figures
◭ ◮
◭ ◮
Back Close
Full Screen / Esc
Printer-friendly Version
Interactive Discussion
Discussion
P
a
per
|
Dis
cussion
P
a
per
|
Discussion
P
a
per
|
Discussio
n
P
a
per
Biogeosciences Discuss., 9, 13243–13286, 2012 www.biogeosciences-discuss.net/9/13243/2012/ doi:10.5194/bgd-9-13243-2012
© Author(s) 2012. CC Attribution 3.0 License.
Biogeosciences Discussions
This discussion paper is/has been under review for the journal Biogeosciences (BG). Please refer to the corresponding final paper in BG if available.
Impact of an 8.2-kyr-like event on
methane emissions in northern peatlands
S. Z ¨urcher1,2, R. Spahni1,2, F. Joos1,2, M. Steinacher1,2, and H. Fischer1,2
1
Climate and Environmental Physics, Physics Institute, University of Bern, Sidlerstrasse 5, 3012 Bern, Switzerland
2
Oeschger Centre for Climate Change Research, University of Bern, Z ¨ahringerstrasse 25, 3012 Bern, Switzerland
Received: 18 July 2012 – Accepted: 12 September 2012 – Published: 25 September 2012
Correspondence to: S. Z ¨urcher ([email protected])
BGD
9, 13243–13286, 2012
Impact of an 8.2-kyr-like event on
methane emissions in northern peatlands
S. Z ¨urcher et al.
Title Page
Abstract Introduction
Conclusions References
Tables Figures
◭ ◮
◭ ◮
Back Close
Full Screen / Esc
Printer-friendly Version
Interactive Discussion
Discussion
P
a
per
|
Dis
cussion
P
a
per
|
Discussion
P
a
per
|
Discussio
n
P
a
per
|
Abstract
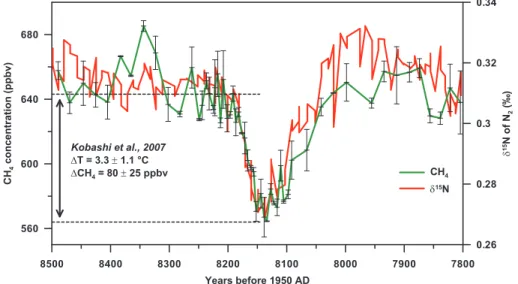
Rapid changes in atmospheric methane (CH4), temperature and precipitation are doc-umented by Greenland ice core data both for glacial times (the so called Dangaard-Oeschger (DO) events) as well as for a cooling event in the early Holocene (the 8.2 kyr event). The onsets of DO warm events are paralleled by abrupt increases in CH4 by
5
up to 250 ppbv in a few decades. Vice versa, the 8.2 kyr event is accompanied by an intermittent decrease in CH4 of about 80 ppbv over 150 yr. The abrupt CH4 changes are thought to mainly originate from source emission variations in tropical and bo-real wet ecosystems, but complex process oriented bottom-up model estimates of the changes in these ecosystems during rapid climate changes are still missing. Here we
10
present simulations of CH4 emissions from northern peatlands with the LPJ-Bern dy-namic global vegetation model. The model represents CH4production and oxidation in soils and transport by ebullition, through plant aerenchyma, and by diffusion. Parame-ters are tuned to represent site emission data as well as inversion-based estimates of northern wetland emissions. The model is forced with climate input data from
freshwa-15
ter hosing experiments using the NCAR CSM1.4 climate model to simulate an abrupt cooling similar to the widespread 8.2 kyr event. As a main result we get a concentration reduction of ∼10 ppbv per degree K change of mean northern hemispheric surface temperature in peatlands. This sensitivity comprises effects on peatland emissions of similar size by the temperature itself as well as by the accompanying change in
pre-20
BGD
9, 13243–13286, 2012
Impact of an 8.2-kyr-like event on
methane emissions in northern peatlands
S. Z ¨urcher et al.
Title Page
Abstract Introduction
Conclusions References
Tables Figures
◭ ◮
◭ ◮
Back Close
Full Screen / Esc
Printer-friendly Version
Interactive Discussion
Discussion
P
a
per
|
Dis
cussion
P
a
per
|
Discussion
P
a
per
|
Discussio
n
P
a
per
1 Introduction
CH4 is a greenhouse gas contributing to the ongoing global warming. CH4 concen-trations have increased from their preindustrial value of ∼700 ppbv to approximately 1800 ppbv in 2008 (Dlugokencky et al., 2009) due to anthropogenic CH4 emissions. Air enclosures in polar ice cores allows for the reconstruction of methane variations in
5
the past and show that CH4 changed in concert with Northern Hemisphere tempera-ture during the glacial/interglacial transitions (Loulergue et al., 2008) as well as during rapid climate variations. Examples of abrupt CH4variations recorded in Greenland ice cores are the 8.2 kyr event in the early Holocene (Fig. 1) (Blunier et al., 1995; Chap-pellaz et al., 1997; Spahni et al., 2003; Kobashi et al., 2007), the Dansgaard-Oeschger
10
events (D-O-events) in the glacial period (Chappellaz et al., 1993; Brook et al., 2000; Blunier and Brook, 2001; Fl ¨uckiger et al., 2004; Huber et al., 2006; Baumgartner et al., 2012) or the Younger Dryas (YD) cooling event (Chappellaz et al., 1993; Baumgartner et al., 2012). During the last glacial period Greenland temperature and CH4are found to covary within∼30 yr, which is the limit of ice core data resolution and the width of the
15
age distribution of air enclosed in bubbles in the ice (Huber et al., 2006). This suggests that CH4sources responded synchronously to the rapid climate changes. The nominal sensitivity of methane concentration variations on changes in Greenland temperature derived from ice cores is about ∼22 ppbv K−1 for the 8.2 kyr event (Kobashi et al., 2007),∼7–16 ppbv K−1for onsets of D-O events (Huber et al., 2006) and∼9 ppbv K−1
20
for the beginning and end of the YD (Severinghaus et al., 1998; Brook et al., 2000; Grachev and Severinghaus, 2005). Note, however, that temperature changes recorded in Greenland are not necessarily representative for the temperature changes in boreal and even less in tropical wetland sources nor for precipitation changes.
While the origin of the abrupt climate variations can be explained by a shut-down
25
BGD
9, 13243–13286, 2012
Impact of an 8.2-kyr-like event on
methane emissions in northern peatlands
S. Z ¨urcher et al.
Title Page
Abstract Introduction
Conclusions References
Tables Figures
◭ ◮
◭ ◮
Back Close
Full Screen / Esc
Printer-friendly Version
Interactive Discussion
Discussion
P
a
per
|
Dis
cussion
P
a
per
|
Discussion
P
a
per
|
Discussio
n
P
a
per
|
concentration to a change in methane emissions from both boreal and sub-tropical to tropical wet ecosystems (Chappellaz et al., 1997; Fischer et al., 2008). The inter-polar concentration gradient with higher values in the Northern versus the Southern Hemisphere during interstadials was reconstructed from ice core methane data from Greenland and Antarctica (Brook et al., 2000; Baumgartner et al., 2012). This gradient
5
together with methane isotopic information indicates important sources during warm periods located in high northern latitudes (Bock et al., 2010). For the 8.2 kyr event, the interpolar gradient suggests that the CH4 emissions must have been reduced in the early phase of the 8.2 kyr event in the Northern Hemisphere, followed by sub-tropical and tropical emission reductions (Spahni et al., 2003).
10
The dominant and most directly responding type of methane emitting ecosystems in the northern high latitudes, i.e. the latitudes with the strongest temperature response to rapid changes in the Atlantic Meridional Overturning Circulation (AMOC), are boreal peatlands (Dallenbach et al., 2000; Baumgartner et al., 2012). Northern high-latitude peatland and permafrost soils are associated with large carbon stocks that serve as
15
a substrate for microbial methane production (Gorham, 1991; Roulet, 2000). For the un-derstanding of the covariations of atmospheric methane and climate on abrupt events it is thus crucial to investigate the carbon cycle of northern high-latitude peatlands (north-ern peatlands hereafter). The carbon cycle response of north(north-ern peatlands is regulat-ing the peatland methane emissions and thus directly affecting the global methane
20
concentration within its atmospheric mixing and life time of ∼2 and ∼10 yr, respec-tively (Lelieveld et al., 1998; Denman et al., 2007; Prather, 2012). Accordingly, the goal of this study is to investigate how much of the CH4sensitivity to a rapid climate change can be explained by northern peatlands during the 8.2 kyr event.
There are two different attempts to model methane emissions from wet ecosystems
25
BGD
9, 13243–13286, 2012
Impact of an 8.2-kyr-like event on
methane emissions in northern peatlands
S. Z ¨urcher et al.
Title Page
Abstract Introduction
Conclusions References
Tables Figures
◭ ◮
◭ ◮
Back Close
Full Screen / Esc
Printer-friendly Version
Interactive Discussion
Discussion
P
a
per
|
Dis
cussion
P
a
per
|
Discussion
P
a
per
|
Discussio
n
P
a
per
methane emissions (e.g. Houweling et al., 1999; Pison et al., 2009; Bergamaschi et al., 2009). Combining both methods can help to narrow down the uncertainties of global wet ecosystem methane emissions (Spahni et al., 2011).
For past time periods, before the start of direct atmospheric methane monitoring in the 1980s, the spatially available CH4 data is restricted to ice cores from
Green-5
land and Antarctica and is not sufficient for applying top-down approaches. Accord-ingly, biogeochemical process modeling of methane emissions and comparisons of resulting atmospheric concentrations to ice core data is the only way to quantify natu-ral methane emission distributions. Previous paleo-modeling studies have shown that simple methane models are capable of simulating emissions during abrupt events
10
(van Huissteden, 2004; Hopcroft et al., 2011) and on long-term glacial-interglacial time scales (Valdes et al., 2005; Kaplan et al., 2006; Weber et al., 2010; Singarayer et al., 2011). The long-term simulations confirm the finding that atmospheric methane concentrations parallel temperature reconstructions from Antarctic ice cores also on glacial-interglacial time scales of the past 800 000 yr (Spahni et al., 2005; Loulergue
15
et al., 2008). A drawback of previous paleo-modeling studies for methane is the limited representation of processes and interactions related to the interplay of vegetation and soil dynamics, soil temperature, soil hydrology, permafrost thawing, methane produc-tion, oxidaproduc-tion, and transport from the soils to the atmosphere by a variety of mech-anisms. For example, Singarayer et al. (2011) and Kaplan et al. (2006) calculate the
20
methane emissions as a fixed ratio of the heterotrophic respiration.
Here, we apply a process-oriented CH4module based on earlier work (Wania et al., 2009a,b, 2010) within the Bern version of the LPJ dynamic global vegetation model. Soil temperature at different depths, including freeze-thaw cycles, and water table po-sition is explicitly calculated and CH4transport by soil diffusion, ebullition and through
25
BGD
9, 13243–13286, 2012
Impact of an 8.2-kyr-like event on
methane emissions in northern peatlands
S. Z ¨urcher et al.
Title Page
Abstract Introduction
Conclusions References
Tables Figures
◭ ◮
◭ ◮
Back Close
Full Screen / Esc
Printer-friendly Version
Interactive Discussion
Discussion
P
a
per
|
Dis
cussion
P
a
per
|
Discussion
P
a
per
|
Discussio
n
P
a
per
|
peatland distribution for the 8.2 kyr event. This approach appears to be justified, be-cause comparison of the recent peat land distribution with the ice coverage 8200 yr ago (Peltier, 2004) shows that only very small areas of present day peatlands where covered by land ice at that time.
The outline of this paper is as follows. In Sects. 2.1 and 2.2, we describe the
LPJ-5
Bern global dynamic vegetation model (Sitch et al., 2003; Joos et al., 2004; Gerber et al., 2003; Strassmann et al., 2008; Stocker et al., 2011), the implementation and im-provements to LPJ-WHyMe (Wania et al., 2009a,b) and a recently developed methane module (Wania et al., 2010). Section 2.3 presents the calibration of the model with modern site data and describes the experimental setup for control simulations and for
10
simulations forced with climate input from an ensemble of freshwater hosing model experiments (Bozbiyik et al., 2011). Results are presented in Sect. 3 and include sim-ulated changes in CH4 emissions for the set of freshwater hosing experiments, the attribution of change in CH4emissions to temperature and precipitation variations, and sensitivity on model parameters.
15
2 Model description and set-up
2.1 LPJ-Bern
The LPJ-Bern (hereafter LPJ) is a subsequent development of the Lund-Potsdam-Jena dynamic global vegetation model (LPJ-DGVM; Sitch et al., 2003) that com-bines process-based, large-scale representations of terrestrial vegetation dynamics
20
and land-atmosphere carbon and water exchanges in a modular framework. Vegeta-tion is defined by plant funcVegeta-tional types (PFTs) each with its own set of parameters describing growth, carbon uptake and mortality. LPJ has been applied previously in paleo studies (e.g. Joos et al., 2004; Gerber et al., 2004) and in simulations assessing the anthropogenic climate perturbation and the impact of human induced landuse (e.g.
25
BGD
9, 13243–13286, 2012
Impact of an 8.2-kyr-like event on
methane emissions in northern peatlands
S. Z ¨urcher et al.
Title Page
Abstract Introduction
Conclusions References
Tables Figures
◭ ◮
◭ ◮
Back Close
Full Screen / Esc
Printer-friendly Version
Interactive Discussion
Discussion
P
a
per
|
Dis
cussion
P
a
per
|
Discussion
P
a
per
|
Discussio
n
P
a
per
For this study we implemented the boreal peatland and methane module based on LPJ-WHyMe (Wetland Hydrology and Methane, Wania et al., 2009a,b, 2010) that de-rives its input data from the LPJ. It includes new features for grid cells with a (pre-scribed) partition of peatland: 8 soil layers, permafrost dynamics with freezing and thawing (including a soil temperature solver to simulate temperature as a function of
5
depth), peatland hydrology (active layer depth and water table position), peatland veg-etation as two additional PFTs (flood-tolerant C3 graminoids and Sphagnum moss), a slow-down of decomposition under inundation and the addition of root exudates (Wa-nia et al., 2009a,b).
The main scientific differences between our methane routine and the original
LPJ-10
WHyMe version 1.3.1 (Wania et al., 2010) is a more mechanistic ebullition mechanism that includes also the partial pressure of CO2 for triggering an ebullition event (see Sect. 2.2). The carbon balance over all layers is now preserved after every gas diffusion time step, whereas in LPJ-WHyMe the carbon balance was closed at the end of the year with a correction factor.
15
2.2 Methane routine in peatlands of LPJ-Bern
The carbon module simulates carbon allocation in vegetation, above and below ground litter and fast and slow soil carbon pools, as well as soil organic matter dynamics (Sitch et al., 2003). Heterotrophic respiration (HR) is calculated based on the size of the litter and soil pools, regulated by soil moisture and soil temperature at a depth of 25 cm.
20
HR is then distributed to 8 peat layers according to the root distribution, where it is used to compute methane production. In each layer methane production is calculated as the product of HR, the ratio of CH4 to CO2 production under anaerobic conditions (fCH
4/CO2), and the anoxity of the soil for each soil layer (Wania et al., 2010).
Depending on the water table position, the soil temperature and the presence of
25
BGD
9, 13243–13286, 2012
Impact of an 8.2-kyr-like event on
methane emissions in northern peatlands
S. Z ¨urcher et al.
Title Page
Abstract Introduction
Conclusions References
Tables Figures
◭ ◮
◭ ◮
Back Close
Full Screen / Esc
Printer-friendly Version
Interactive Discussion
Discussion
P
a
per
|
Dis
cussion
P
a
per
|
Discussion
P
a
per
|
Discussio
n
P
a
per
|
is implemented as described in (Wania et al., 2010): the flood-tolerant C3 graminoids (one of two PFTs growing in peatlands) are adapted to inundation by the presence of aerenchyma, gas-filled tissue, through which gas can be transported by diffusion. Plant-mediated transport depends on temperature, water content and the actual gra-dients of CH4, CO2 or O2. The tiller radius rtiller defines the open area available for
5
plant-mediated transport and is a tunable parameter.
Diffusion transports O2, CO2 and CH4 between the 8 soil layers. The temperature-dependent diffusion coefficients of all gases are set to their molecular diffusivities in air or water (Lerman, 1979; Broecker and Peng, 1974), depending on the water table position in the acrotelm (top 30 cm of soil). Peatland soil layers below that horizon
10
are assumed to be completely water saturated (catotelm). Water can freeze if the soil layer temperature falls below 0◦C and all transport mechanisms are prohibited. CH4 is not incorporated into the ice during freezing leading to an enrichment of CH4 in the remaining water and an eventual release by ebullition.
The new ebullition mechanism calculates how much of the CH4, CO2 and N2 is in
15
the gas phase and how much is dissolved. Following Henry’s law (FechnerLevy and Hemond, 1996; Rosenberry et al., 2003; Tokida et al., 2005, 2007) the amount of dis-solved gases in each layer depends on partial pressure of CH4, CO2 and N2, hydro-static pressure, and soil temperature. The available volume (Vavailable) within each layer i is given by the layer thickness and the porosity for fully water saturated conditions.
20
The total amount of N2 is assumed to be constant, since it is not simulated by our model. However, the partitioning of N2 between water and soil air changes. Assum-ing the gaseous volume of N2 to be 1% (lower bound estimate, e.g. Shannon et al., 1996) of the available volume in a layer (liquid phase and gas phase), we calculate with Henry’s law the amount of N2 dissolved in each layer (Tokida et al., 2007). We
25
then add the produced or transported CH4 and CO2 to the layer and recalculate the partial pressure for all gases (Eq. 1, Tokida et al., 2007; Kellner et al., 2006):
Px,i =nx,iRTi
Vg,i+
Vw,i
Hx
−1
BGD
9, 13243–13286, 2012
Impact of an 8.2-kyr-like event on
methane emissions in northern peatlands
S. Z ¨urcher et al.
Title Page
Abstract Introduction
Conclusions References
Tables Figures
◭ ◮
◭ ◮
Back Close
Full Screen / Esc
Printer-friendly Version
Interactive Discussion
Discussion
P
a
per
|
Dis
cussion
P
a
per
|
Discussion
P
a
per
|
Discussio
n
P
a
per
wherePx,i is the partial pressure of gas species x in layer i,nx,i is the total number
of moles of gasx, Vg,i is the gas volume, Vw,i is the volume of liquid water,Hx is the
dimensionless Henry’s law constant for gasx(Yamamoto et al., 1976; Wiesenburg and Guinasso, 1979; Weiss, 1970),R is the universal gas constant, andTi is the temper-ature in layeri (see Appendix). We assume that during ebullition the gas volume,Vg,i, 5
is equal to 15 % and the liquid water volume,Vw,i, 85 % of the available volume
(Fech-nerLevy and Hemond, 1996; Rosenberry et al., 2003; Tokida et al., 2005). In the code, ebullition is triggered if the sum of all partial pressures (pN2+pCO2+pCH4) (Eq. 1 with Vg,i =15 % · Vavailable) is larger than the sum of atmospheric and hydrostatic pressure. The number of moles of CO2and CH4 released per ebullition event is assumed to be
10
1 % of the available volume times the CO2 and CH4 partial pressure divided by R Ti,
respectively. In other words, a fifteenth of the CO2and CH4amount in the gas phase is released per ebullition event. This assumption and that the gas volume is equal to 15 % of the available volume are not critical for the total emissions. Instead these parame-ters do modulate the frequency and the magnitude of ebullition events (see parameter
15
tuning, Sect. 3.4).
Oxygen is transported into soils by diffusion through open soil pores and through the aerenchyma of the flood tolerant graminoids. Only a fraction (foxid) of the available oxygen is used to oxidise CH4to CO2. The remaining O2is assumed to be consumed by other electron acceptors. Againfoxidis a tunable model parameter.
20
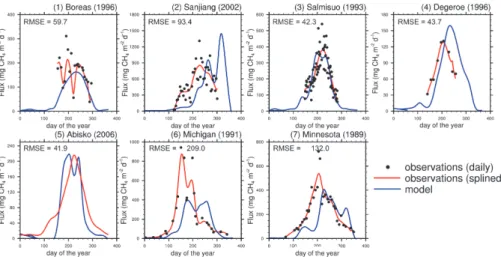
2.3 Calibration and site validation
The implementation of LPJ-WHyMe into the LPJ-Bern, the code improvements and the adaption of the ebullition scheme calls for a re-evaluation of flux densities at the site level and a retuning of model parameters. We compare simulated CH4 emissions to flux measurement at 7 sites. A detailed description of the sites and their environmental
25
BGD
9, 13243–13286, 2012
Impact of an 8.2-kyr-like event on
methane emissions in northern peatlands
S. Z ¨urcher et al.
Title Page
Abstract Introduction
Conclusions References
Tables Figures
◭ ◮
◭ ◮
Back Close
Full Screen / Esc
Printer-friendly Version
Interactive Discussion
Discussion
P
a
per
|
Dis
cussion
P
a
per
|
Discussion
P
a
per
|
Discussio
n
P
a
per
|
et al., 2006; Jackowicz-Korczynski et al., 2010; Shannon and White, 1994; Dise, 1993). We force LPJ with local temperature and precipitation for the sites in Abisko and San-jiang and we use CRU-data (Climate Research Unit’s (CRU) TS 2.1, climatology from 1901 to 2002, (New et al., 1999; Mitchell and Jones, 2005)) of the corresponding grid cell for the other sites for the calibration. LPJ is forced with monthly climate data, i.e.
5
temperature (Fig. 4b), precipitation (Fig. 4c) and cloud cover, which are interpolated to daily values. The climate records include seasonal and interannual variability and are repeated over the spin-up period to reach a stable steady state.
The three most important factors for total methane emissions and the attribution to each emission pathway in the model turned out to be (i) the CH4/CO2-factorfCH
4/CO2, 10
followed by (ii) the oxidation fraction foxid and (iii) the tiller radius rtiller of peatland grasses. Other factors controling methane emissions are the exudate turnover rate, the moisture response, which is also used to calculate decomposition rates, the leaf-to-root ratio, which influences the cross-sectional area of aerenchyma available for mediated gas transport, and the tiller porosity which influences the area for
plant-15
mediated transport.
The CH4/CO2-factor, linking heterotrophic respiration and CH4 production, directly affects the total production of CH4and thus total annual emissions. The oxidation frac-tion is the percentage of available O2 that is used to oxidize CH4 in each layer. Its effect is similar to the CH4/CO2-factor, but weaker. The tiller radius of peatland grasses
20
influences directly the plant-mediated transport of O2, CO2and CH4. These three pa-rameters were chosen to minimize the root mean square error between model results and data for the seven sites. Data and model results were smoothed using a spline approximation (Enting, 1987) with a cut-offperiod of two months. The spline covers the time period where the respective measurements exist. Nominally daily data were
ap-25
BGD
9, 13243–13286, 2012
Impact of an 8.2-kyr-like event on
methane emissions in northern peatlands
S. Z ¨urcher et al.
Title Page
Abstract Introduction
Conclusions References
Tables Figures
◭ ◮
◭ ◮
Back Close
Full Screen / Esc
Printer-friendly Version
Interactive Discussion
Discussion
P
a
per
|
Dis
cussion
P
a
per
|
Discussion
P
a
per
|
Discussio
n
P
a
per
from the spline fits. These optimized parameter set is then used to simulate global CH4 emissions in the model experiment. The same set of parameters is used across all sites although a better fit with observational data could be achieved when parameters would be adjusted for each site individually. We find an improved agreement between model and observations compared to results presented by (Wania et al., 2010). This is
5
likely related to the elimination of some coding errors and the improved representation of ebullition.
The optimized parameters are 0.17 g C (g C)−1 for the ratio of CH4/CO2 production under anaerobic conditions, 0.5 for the oxidation fraction, i.e. the fraction of available oxygen used for methane oxidation, 0.0035 m for the tiller radius, and the assumption
10
that ebullition occurs when 15 % of the available pore volume is gas and that 1 % of the available volume is released as gas in a single ebullition event. The influence of these parameters on modelled changes in methane emissions after a climate perturbation will be discussed in the result section.
It is possible to get similar root mean square deviations between model results and
15
observations with different combinations for the production ratio and the oxidation frac-tion. Here, the oxidation factor is set as a standard to the same value (0.5) as in Wania et al. (2010). Very different fractions of oxygen consumption by methanogenesis have been reported, reaching from 0.2 to 1 (Wania, 2007; Frenzel and Rudolph, 1998; Strom et al., 2005). Changing parameters, governing plant-mediated transport or ebullition,
20
changes the attribution to the different pathways, but does only weakly influence the total emission per unit area. To quantify the distribution better, either more site mea-surements would be needed or some further constraints like the13C signature of the total emissions.
Despite a rather well representation of the amplitide in CH4emissions in the course
25
BGD
9, 13243–13286, 2012
Impact of an 8.2-kyr-like event on
methane emissions in northern peatlands
S. Z ¨urcher et al.
Title Page
Abstract Introduction
Conclusions References
Tables Figures
◭ ◮
◭ ◮
Back Close
Full Screen / Esc
Printer-friendly Version
Interactive Discussion
Discussion
P
a
per
|
Dis
cussion
P
a
per
|
Discussion
P
a
per
|
Discussio
n
P
a
per
|
local conditions. For example a delayed rise in spring temperature leads to a time lag in soil thawing and thus methane production and emissions. Effects like water runofffrom other regions are not taken into account either. However, the phase lag at Sanjiang, where site climate data were used, shows that also the seasonal change in the different emission processes is not accurately reflected by our model for all of the sites. The
5
mismatch may be related to a possible neglect of heterotrophic respiration at shallow soils that thaw early in season. The methane routine distributes the total heterotrophic respiration that it gets as an input according to the root distribution and in case a layer is still frozen, the methane is put into the next unfrozen layer above. Analysis of the model output for Sanjiang shows that the soil thawing in deep layers has not began
10
when the measured emissions start and the substrate for production is transferred to upper layers where it’s almost completely oxidized.
Our sensitivity simulations presented in Sect. 3.4, show that also the partitioning between the different emission pathways (diffusion, plant transport, ebullition) has an influence on the seasonality of the emissions and is sensitive on the choice of model
15
parameters, however the total annual emission is not. As illustrated in Fig. (3), the time-integrated CH4 flux is well represented by the model across the different sites and a tight correlation (R2=0.92) is found between simulated and measured cumu-lative site emissions. This indicates that the model has a good skill in representing annual emissions across a wide range of environmental conditions in the boreal zone.
20
In conclusion, total annual emissions are simulated well across the different sites, while deviations between simulated and observed seasonal cycles remain (see also Wania, 2007).
2.3.1 Input data, spin-up, and setup for transient experiments
Spatially-resolved input data include the global land mask, the soil type (Zobler, 1986)
25
BGD
9, 13243–13286, 2012
Impact of an 8.2-kyr-like event on
methane emissions in northern peatlands
S. Z ¨urcher et al.
Title Page
Abstract Introduction
Conclusions References
Tables Figures
◭ ◮
◭ ◮
Back Close
Full Screen / Esc
Printer-friendly Version
Interactive Discussion
Discussion
P
a
per
|
Dis
cussion
P
a
per
|
Discussion
P
a
per
|
Discussio
n
P
a
per
set (Tarnocai et al., 2007) includes histels and histosols that were rasterized and re-gridded to the model resolution (Fig. 4c), and scaled globally to match an area of 1048 million km2 in the permafrost affected region in North America (Tarnocai et al., 2009). This scaling results in a Northern Hemisphere peatland area of 2.81 million km2. This area is larger than the 2.06 million km2derived from the IGBP-DIS map as used
5
in (Wania et al., 2010). Finally, input has to be provided for annual atmospheric CO2 constant at 279 ppmv as found in ice cores for preindustrial conditions (Monnin et al., 2004) and the number of wet days per month (New et al., 1999; Mitchell and Jones, 2005).
LPJ is forced with monthly data of temperature (Fig. 4b), precipitation (Fig. 4c) and
10
cloud cover. Here, climate output from a control run and a 3-member ensemble of freshwater hosing simulations recently conducted with the Climate System Model, ver-sion 1.4, (CSM1.4) of the National Centre for Atmospheric Research (NCAR) (Bozbiyik et al., 2011) is applied to simulate methane emissions and emission changes in north-ern peatlands during a cooling event similar to the 8.2 kyr event (Fig. 1). All CSM1.4
15
freshwater hosing simulations branch from the control simulations that features a stable climate and a constant freshwater input flux anomaly of 1 Sv (1 Sverdrup=106 m3s−1) is applied over 100 yr in the Northern North Atlantic. Freshwater input starts 126, 263, and 305 yr after the start of the control in ensemble simulation s1, s2, and s3 and simulations are continued for several centuries.
20
The monthly temperature and precipitation data of each CSM1.4 simulation are splined for each grid cell and each calendar month separately, using a 20-yr cut-off fre-quency (Enting, 1987) (Fig. 5). Anomalies for each month relative to the corresponding monthly mean of the CSM1.4 control run are computed. Monthly anomalies are then added to the CRU climatology (New et al., 1999; Mitchell and Jones, 2005). As the LPJ
25
BGD
9, 13243–13286, 2012
Impact of an 8.2-kyr-like event on
methane emissions in northern peatlands
S. Z ¨urcher et al.
Title Page
Abstract Introduction
Conclusions References
Tables Figures
◭ ◮
◭ ◮
Back Close
Full Screen / Esc
Printer-friendly Version
Interactive Discussion
Discussion
P
a
per
|
Dis
cussion
P
a
per
|
Discussion
P
a
per
|
Discussio
n
P
a
per
|
All simulations are driven with a combination of the repeated 31-yr cycle of CRU data (TS 2.1, detrended climatology from 1960 to 1990, New et al., 1999; Mitchell and Jones, 2005) as a baseline and monthly anomalies from the NCAR CSM 1.4 model under preindustrial conditions. The spinup is done for all runs with the CRU climatology and the anomalies from the control run and is 1000 yr long. To accelerate the spin-up
5
procedure, equilibrium soil carbon stocks are computed after 400 yr based on average input fluxes and decomposition rates. Then spin-up is continued for another 600 yr.
Simulated annual boreal methane emissions are scaled to 30 Tg CH4yr
−1
for the end of the spinup period, which is a reasonable value for the present day and the preindus-trial (Spahni et al., 2011, and therein). Since the area of effective methane emissions
10
is highly heterogeneous, the simulated emissions have to be scaled accordingly. The prescribed peatland map only indicates the location of peat and the total area, but not its small scale structure. Peat layers on hummocks are emitting much less than peat layers in lawns. Accordingly, a perfect match of the total modeled peatland emission with best estimates from observations cannot be expected.
15
3 Results
3.1 Preindustrial emissions from boreal peatlands and interannual variability
Multi-year average methane emissions from peatlands are simulated to typically range between 0 to 50 g C m−2yr−1(Fig. 7a) for the control. In general, emissions per unit area are relatively high in Northern Europe and in grid cells along the southern boundary of
20
the peat zone in North America. Relatively low emissions per unit area are simulated in the Canadian Arctic and parts of Siberia, reflecting a generally short growing season and harsh climatic conditions (Fig. 4).
There is significant year-to-year climate variability and boreal methane emissions vary accordingly in the control simulation (Fig. 6). The range in annual emissions lies
25
between 26 and 37 Tg CH4yr
−1
BGD
9, 13243–13286, 2012
Impact of an 8.2-kyr-like event on
methane emissions in northern peatlands
S. Z ¨urcher et al.
Title Page
Abstract Introduction
Conclusions References
Tables Figures
◭ ◮
◭ ◮
Back Close
Full Screen / Esc
Printer-friendly Version
Interactive Discussion
Discussion
P
a
per
|
Dis
cussion
P
a
per
|
Discussion
P
a
per
|
Discussio
n
P
a
per
the long-term mean is±1.8 Tg CH4yr
−1
in the control. The spread in annual emission of 26 to 37 Tg CH4yr
−1
may be compared with the spread of 29 to 37 Tg CH4yr
−1 for Northern Hemisphere extratropical wetlands found by Chen and Prinn (2006) or 25 to 34 Tg CH4yr
−1
by Spahni et al. (2011). Clearly, boreal wetland emissions have the potential to influence interannual variations in atmospheric methane by a few ppb.
5
3.2 Temporal and spatial changes in methane emissions after a climate perturbation
We next turn to the response for an 8.2 kyr-type event. The additional freshwater flux applied in the NCAR CSM1.4 ensemble simulations results in a collapse of the Atlantic Meridional Overturning Circulation and of the associated northward heat transport into
10
the North Atlantic region with no sign of recovery until the end of the simulations. In turn, simulated temperature and precipitation in the North Atlantic and over the adja-cent continents decrease relative to the stable CSM1.4 control run (Fig. 5). On annual and spatial average, using peatland area of each grid cell as weights, temperature over peatlands (40–90◦ N) decrease by about 2.5◦C within decades after adding the
15
freshwater and remain low until the end of the simulations (Fig. 5c). Largest temper-ature anomalies over peatlands are simulated for the British Isles and Scandinavia, whereas simulated temperature changes remain small in Northern North America and the Siberian lowland, except in near-costal regions (Fig. 7a). Even a slight warming is simulated for the major peat regions in North America. On average, precipitation drops
20
over peatland areas by 3 to 5 mm per month (Fig. 5d), with largest changes again in the British Isles (Fig. 7b). While the moss PFT was slightly dominant before the start of the freshwater input (foliar projective cover of 60 % for the moss PFT and 40 % for the grass PFT), it suffers more under the dryer and cooler conditions (50 % both after-wards). The biggest changes are in the Atlantic regions and the retreat of the sum of
25
BGD
9, 13243–13286, 2012
Impact of an 8.2-kyr-like event on
methane emissions in northern peatlands
S. Z ¨urcher et al.
Title Page
Abstract Introduction
Conclusions References
Tables Figures
◭ ◮
◭ ◮
Back Close
Full Screen / Esc
Printer-friendly Version
Interactive Discussion
Discussion
P
a
per
|
Dis
cussion
P
a
per
|
Discussion
P
a
per
|
Discussio
n
P
a
per
|
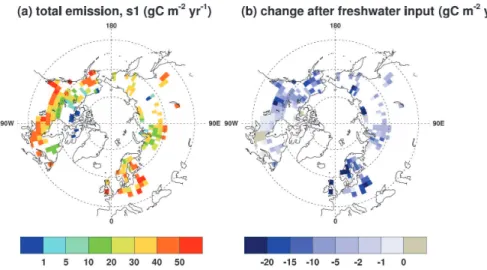
In response to the widespread decrease in temperature and precipitation, peatland CH4emissions are reduced by about 20 % compared to the control run. In accordance with the evolution of climate, emissions do not recover in the centuries after the per-turbation (Fig. 6). These results are consistent across the three ensemble members. The spatial pattern of response reflects the change in climate with largest decrease in
5
emissions per unit area of up to 25 g C m−2yr−1in Northern Europe and small changes in Eastern North America and in the Siberian lowlands (Fig. 7b). A slight increase in emissions is even found South of Hudson Bay where an increase in temperature and small precipitation changes are simulated after the freshwater perturbation.
The decrease in emissions from boreal peatlands by 6 Tg CH4yr
−1
corresponds to
10
a decrease of 18 ppb in atmospheric methane (assuming a lifetime of 8.4 yr Steven-son et al., 2006; Prinn, 1994; Lelieveld et al., 1998), and a unit conversion factor of 2.78 Tg CH4ppbv
−1
. This decrease explains about 23 % of the 80 ppbv reduction dur-ing the 8.2 kyr event observed in ice core records (Fig. 1). This suggests that varia-tions in emissions from boreal peatlands contributed significantly to the CH4variations
15
recorded in ice cores, but that other boreal and especially tropical CH4sources varied as well.
3.3 Influence of changes in temperature and precipitation on emission changes
Next, we investigate the sensitivity of methane emission changes to changes in indi-vidual climatic drivers. This is done by factorial simulations where either precipitation
20
anomalies or temperature anomalies from the NCAR CSM1.4 simulations are applied. The results show that the changes in the amount of precipitation and in temperature are about equally responsible for the drop in the total methane emissions from the northern peatlands (Fig. 8a); total emission decreases by about 4 Tg CH4yr−1in each simulation. The combined effect of temperature and precipitation is not the sum of the
25
BGD
9, 13243–13286, 2012
Impact of an 8.2-kyr-like event on
methane emissions in northern peatlands
S. Z ¨urcher et al.
Title Page
Abstract Introduction
Conclusions References
Tables Figures
◭ ◮
◭ ◮
Back Close
Full Screen / Esc
Printer-friendly Version
Interactive Discussion
Discussion
P
a
per
|
Dis
cussion
P
a
per
|
Discussion
P
a
per
|
Discussio
n
P
a
per
grid cells with no activity due to too dry conditions are inactive independent of a further decrease in temperature. In conclusion, both temperature and precipitation changes influence CH4emissions significantly.
3.4 Governing processes and their sensitivity to model parameters
We now turn our attention to the importance of individual processes for methane
5
emissions from boreal peatlands. Gross primary productivity (GPP) by the two plant functional types existing on boreal peatlands decreases by 14 % from 1463 to 1258 Tg C yr−1 after the freshwater input, net primary productivity (NPP) by 12 % from 839 to 739 Tg C and total (aerobic and anaerobic) heterotrophic respiration (HR) by 13 % from 837 to 731 Tg C. This decrease is driven by the general decrease in
temper-10
ature and precipitation in about equal parts as inferred from the factorial simulations described above. In turn, the simulated total soil carbon inventory in boreal peatlands of 536 Pg C, including the litter above and below ground, the exudates, and a fast and a slowly decaying soil carbon pool, remains virtually unchanged (532 Pg C). The de-crease in respiration is thus the result of a dede-crease in the mean decomposition rate
15
of organic material and not of a decrease in soil carbon inventory. Note that the soil carbon inventory which is in steady state and under preindustrial conditions is realistic compared to available data (MacDonald et al., 2006) and therefore also higher than at the beginning of the 8.2 kyr event. The average yearly water table position over all peatland gridcells drops from 4 mm below the surface to 6 mm. The biggest changes
20
are in the Atlantic regions and the adjacent areas with up to 110 mm change in the annual mean.
In our model, production of methane is linearly scaled with the rate of het-erotrophic respiration and total preindustrial emissions from peatlands are scaled to 30 Tg CH4yr
−1
as described in the method section. For the standard set of
param-25
eters, preindustrial total methane production amounts to 41.9 Tg CH4yr
−1
of which 28 % (11.7 Tg CH4yr
−1
BGD
9, 13243–13286, 2012
Impact of an 8.2-kyr-like event on
methane emissions in northern peatlands
S. Z ¨urcher et al.
Title Page
Abstract Introduction
Conclusions References
Tables Figures
◭ ◮
◭ ◮
Back Close
Full Screen / Esc
Printer-friendly Version
Interactive Discussion
Discussion
P
a
per
|
Dis
cussion
P
a
per
|
Discussion
P
a
per
|
Discussio
n
P
a
per
|
pulse, production drops on average to 35.4 Tg CH4yr
−1
of which again about 30 % (10.7 Tg CH4yr
−1
) are oxidized and 70 % emitted (Fig. 8a). The bottom line of this is that 2.7 % of total NPP and HR is converted into methane (22.5 Tg C/839 Tg C and 22.5 Tg C/837 Tg C) under preindustrial conditions. However, these fractions drop to 2.5 % under the climate prevailing after the freshwater input. This suggests that a fixed
5
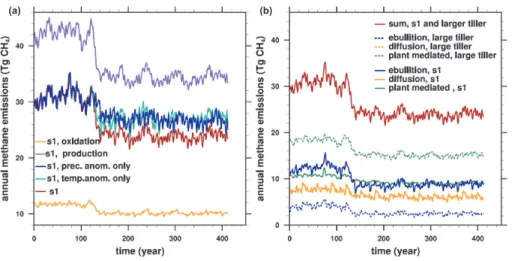
scaling of CH4 emissions to total heterotrophic respiration may not be adequate to simulate variations in CH4emissions under varying climate conditions such as recon-structed for Dansgaard-Oeschger events or glacial-interglacial cycles.
The total methane emission flux is the sum of plant transport, diffusion and ebullition. For the standard parameter choice, ebullition and plant transport are the dominant
10
transport pathways (solid lines in Fig. 8b) and each contribute about 35 to 40 % to the total emission. The percentage contribution of these pathways to total emissions remains roughly constant after the climatic perturbation. The fraction of methane that is oxidized remains also fairly constant.
Next, we analyse the sensitivity of the simulated emissions and their changes to the
15
choice of model parameters in the methane module (Table 1). In a suite of sensitivity experiments, a parameter is varied individually around its standard value. Each run is rescaled with the same factor that scales the standard parameters run to 30 Tg CH4yr−1 at the end of the spin-up. Parameters varied are the CH4/CO2 production factor, the oxidation factor, i.e. the percentage of available O2that is used to oxidize CH4in each
20
layer, and the tiller radius of the peatland grass PFT and the two parameters controlling the ebullition mechanism.
The CH4/CO2 production factor and the oxidation fraction (range 0.2 to 0.6) scale the total methane emissions from boreal wetlands almost linearly under preindustrial conditions. Changing the parameters governing methane transport to reduce a specific
25
BGD
9, 13243–13286, 2012
Impact of an 8.2-kyr-like event on
methane emissions in northern peatlands
S. Z ¨urcher et al.
Title Page
Abstract Introduction
Conclusions References
Tables Figures
◭ ◮
◭ ◮
Back Close
Full Screen / Esc
Printer-friendly Version
Interactive Discussion
Discussion
P
a
per
|
Dis
cussion
P
a
per
|
Discussion
P
a
per
|
Discussio
n
P
a
per
an increase in the tiller radius leads to more plant-mediated transport and in turn to a lower ebullition flux (Fig. 8b), whereas the diffusive flux to the atmosphere remains practically unchanged. A larger tiller radius increases O2 diffusion into the soil, and thus potentially favours oxidation. At the same time, a larger tiller radius also favours a larger methane efflux to the atmosphere (Wania et al., 2010). We find that the fraction
5
of produced methane that is oxidized in the soil increases from 30 to 32 % when the tiller radius is doubled.
It is interesting to analyse how the drop in emission for an 8.2 kyr-type climate anomaly depends on the choice of parameters. The reduction in methane emissions after the freshwater perturbation does barely depend on the oxidation fraction (Table 1).
10
The reduction in emissions in only 16.9 % when the oxidation fraction is set to 0.2 com-pared to a reduction by −18.6 % for the standard value of 0.5. Correspondingly, the reduction in emissions becomes slightly larger if a larger fraction of available oxygen is used for methane oxidation. Changes in the tiller radius and in the parameters gov-erning ebullition have as well a small influence on the simulated change in emission
15
(Table 1).
4 Conclusions
Various climate input scenarios and parameter sets were used to model methane emis-sions during a freshwater experiment under interglacial climate conditions, reflecting conditions similar to the 8.2 kyr event. The result that methane emissions from
north-20
ern peatlands drop during an average monthly precipitation change of 3 mm and an average temperature drop of about 2.5◦C over 50 yr by 20 % is generally insensitive to the parameter selection. The driving factor for the magnitude of the modelled emis-sions is the production. Changes in the parameters that describe the different transport mechanisms influence the seasonal timing of the emissions and the attribution to the
25
BGD
9, 13243–13286, 2012
Impact of an 8.2-kyr-like event on
methane emissions in northern peatlands
S. Z ¨urcher et al.
Title Page
Abstract Introduction
Conclusions References
Tables Figures
◭ ◮
◭ ◮
Back Close
Full Screen / Esc
Printer-friendly Version
Interactive Discussion
Discussion
P
a
per
|
Dis
cussion
P
a
per
|
Discussion
P
a
per
|
Discussio
n
P
a
per
|
produced and gets steadily transported to layers with less methane concentration, di-rectly to the atmosphere or gets stored in the soil. In the latter case it stays until it reaches the threshold for ebullition, which is the fastest and most efficient transport way.
CH4production also changes significantly from year to year in our model. The
mod-5
eled inter-annual variability in CH4 emissions is on the order of 10 Tg CH4yr−1, which is comparable to the variability found by Chen and Prinn (2006) or Spahni et al. (2011). This inter-annual variability amounts to a third of the average peatland emissions of 30 Tg CH4yr−1and is also comparable in size to the average decline in CH4emissions found during our freshwater hosing experiment. Accordingly, the decline in peatland
10
CH4emissions during the freshwater hosing event in our model is caused by a direct, fast response of the existing peatland ecosystems on the occuring climate change. The observed emission decline during the freshwater hosing experiment also occurs on time scales of years to decades, again showing that existing peatlands are able to respond quickly and sensitively to changing climate boundary conditions in our model.
15
Thus, a change in peatland emissions on the order of 10 Tg CH4yr
−1
does not require a much slower climate induced geographical relocation of peatlands or a change in peatland ecosystem structure, such as a transgression from fens to bogs. Note, that such a dynamic relocation or aging of peatlands is not yet included in our model, but would become important for the simulation of glacial CH4 emissions or during
tran-20
sient Holocene climate conditions on time scales of millenia, where peatland location and ecosystem composition can change. E.g. during glacial times northern boreal wet-lands have most likely been displaced southwards in response to the widespread cool-ing. Peatland distribution (and peatland ecosystem structure) may have also somewhat different for the time interval 8200 yr ago, when some ice remnants still existed in North
25
BGD
9, 13243–13286, 2012
Impact of an 8.2-kyr-like event on
methane emissions in northern peatlands
S. Z ¨urcher et al.
Title Page
Abstract Introduction
Conclusions References
Tables Figures
◭ ◮
◭ ◮
Back Close
Full Screen / Esc
Printer-friendly Version
Interactive Discussion
Discussion
P
a
per
|
Dis
cussion
P
a
per
|
Discussion
P
a
per
|
Discussio
n
P
a
per
response to the cooling appears to be unlikely as the time scale for peat development is much longer (Weber et al., 2010).
Assuming total emissions of 30 Tg CH4yr
−1
, the emission change during the cooling event explains a variation in the atmospheric methane concentration of about 18 ppbv. Taken at face value this cannot quantitatively explain the 80 ppbv change found in ice
5
cores during the 8.2 kyr event. Accordingly other sources such as tropical wetlands, but also other boreal and mid-latitude sources are likely to be affected by the 8.2 kyr event. However, scaling the annual average emissions to 30 Tg CH4yr−1 directly determines the magnitude of the emission reduction and thus of the implied decrease in atmo-spheric CH4.
10
Total average CH4 emissions of 30 Tg CH4yr−1 correspond to results from Spahni et al. (2011), compatible with Chen and Prinn (2006) and MacDonald et al. (2006) for current conditions, but is at the lower end compared to the survey of Zhuang et al. (2004). Zhuang et al. (2004) summarized the recent literature and found that emission estimates for the pan-arctic region from eleven studies ranged from 31 to
15
106 Tg CH4yr
−1
although the upper end of their range is incompatible with ice core observations on the interhemispheric CH4 gradient (Brook et al., 2000; Baumgartner et al., 2012). MacDonald et al. (2006) also suggests that boreal wetland CH4emissions might have been higher at 8 kyr BP than today although peat extent was lower. The reason for this is that the emissions from minerotrophic fens that dominated early
dur-20
ing peat formation are much higher than from the currently predominant ombrotrophic sphagnum bogs that only developed over time. They suggest that the northern peat-land complex was likely at 20 % of its current aerial extent at the end of the YD and expanded to about 50 % by 8 ka. On the basis of current estimates of overall CH4 pro-duction from northern peatlands, they may have contributed up to 12 to 27 Tg CH4yr
−1
25
BGD
9, 13243–13286, 2012
Impact of an 8.2-kyr-like event on
methane emissions in northern peatlands
S. Z ¨urcher et al.
Title Page
Abstract Introduction
Conclusions References
Tables Figures
◭ ◮
◭ ◮
Back Close
Full Screen / Esc
Printer-friendly Version
Interactive Discussion
Discussion
P
a
per
|
Dis
cussion
P
a
per
|
Discussion
P
a
per
|
Discussio
n
P
a
per
|
Brook et al. (2000) and Baumgartner et al. (2012) estimate the total CH4 source strength in the Northern Hemisphere to be 60–70 Tg CH4yr−1 for the early Holocene. This estimate includes all extratropical CH4sources (e.g. ruminants, wet soils, thawing of submerged permafrost, thermokarst lakes etc, where thermokarst lakes alone are estimated to account for up to 15 Tg CH4yr−1but could be taken as an upper boundary.
5
If we set the annual average peatland emissions to 50 instead of 30 Tg CH4yr
−1 , we could explain a 30 ppbv change during our freshwater hosing experiment. This could still only explain about 40 % of the observed CH4 decrease during the 8.2 kyr event. Accordingly, a substantial contribution of tropical and other boreal sources to this event remains most likely.
10
Although our findings are generally within the range of other estimates and ice core observations, they are still subject to considerable uncertainties both with respect to the total peatland CH4emissions as well as the processes on the soil and ecosystem level. To constrain the parameters further, additional information from field data and potentially from isotopic information are required. Moreover temporal changes also
15
exist in the CH4 emissions of peatland ecosystems. As outlined above the temporal transgression of peatlands from minerotrophic fens to ombrotrophic bogs is not yet in-cluded in our model. Sowers (2010) measured a decreasing trend inδ13C throughout the Holocene beginning at−46.4 permil at 11 kyr BP and decreasing to−48.4 permil at 1 ka. They suggest the 2 permilδ13C drop is likely to be a combination of increased
20
CH4emissions from Arctic lakes and wetlands, an increase in the ratio of C3/C4plants in wetlands and an increase in methanogenic communities utilizing the CO2reduction pathway as compared to the acetate fermentation pathway. In particular the latter pro-cess would be directly related to the transgression of fens to bogs and could explain theδ13CH4shift observed in ice cores (Sowers, 2010) in the first half of the Holocene.
25
BGD
9, 13243–13286, 2012
Impact of an 8.2-kyr-like event on
methane emissions in northern peatlands
S. Z ¨urcher et al.
Title Page
Abstract Introduction
Conclusions References
Tables Figures
◭ ◮
◭ ◮
Back Close
Full Screen / Esc
Printer-friendly Version
Interactive Discussion
Discussion
P
a
per
|
Dis
cussion
P
a
per
|
Discussion
P
a
per
|
Discussio
n
P
a
per
implication for simple models) and by including a dynamic peatland distribution. The simulations done for this study could be improved by choosing more specific bound-ary conditions for the 8.2 kyr event (such as an improved peatland distribution map, the climate influence of the ice sheet remnants and the choice of orbital parameters and CO2 concentrations at the time of the 8.2 kyr event) instead of preindustrial
con-5
ditions as used in these simulations. There are also uncertainties to which extend the NCAR climate input is appropriate to do a 8.2 kyr event like simulation. To improve the model calibration more site measurements would be needed and some further con-straints like the13C signature would give additional constraints for the attribution to the different processes.
10
Appendix A
Ebullition routine
We assume the existence of three gas species CH4, CO2and N2in the bubbles (Tokida et al., 2007). All calculations are done for each soil layer separately.
x gas species (CH4, CO2, N2)
Vavailable available volume (liquid and gas bubbles, not frozen) in a layer per m 2
(m) Vgas total gas volume per m
2 (m)
Vdiss,x dissolved volume of speciesxper m2(m)
Vdiss volume in which the gases can dissolve per m 2
(m) Vice frozen volume in a layer per m
2 (m) ρ porosity
T temperature in a layer (◦C) R universal gas constant Dz thickness of layerz (m)
BGD
9, 13243–13286, 2012
Impact of an 8.2-kyr-like event on
methane emissions in northern peatlands
S. Z ¨urcher et al.
Title Page
Abstract Introduction
Conclusions References
Tables Figures
◭ ◮
◭ ◮
Back Close
Full Screen / Esc
Printer-friendly Version
Interactive Discussion
Discussion
P
a
per
|
Dis
cussion
P
a
per
|
Discussion
P
a
per
|
Discussio
n
P
a
per
|
Hx dimensionless Henry constant (ratio of aqueous to gaseous phase) for gasx
nx total number of moles of gas speciesx per m2(mol m−2) Vgas, ebull gas volume at threshold o ebullition (m)
Pgas,x partial pressure of gas speciesx(Pa)
Pgas gas pressure (Pa)
∆V total gas volume lost through an ebullition event per m2(m)
∆nx change in total amount of gas speciesx(mol m
−2 )
∆mx total mass change in gas speciesx (g m−2) Mx molar mass of gas speciesx(g mol−1)
The available space per m2,Vavailable, is the layer height multiplied by the porosity and corrected for the frozen volume.
Vavailable=Vgas+Vdiss=ρ·Dz−Vice(m3m
−2) (A1)
The soil in wetlands is divided in the acrotelm (defined as the upper 0.3 m which ex-periences a fluctuating water table) and the catotelm, the underlying permanently
in-5
undated layers with 1.7 m thickness. The respective porosities areρacro=0.9 for the three first layers,ρcato=0.8 for the 5 deeper layers.
PEis the environmental pressure and therefore the sum of the atmospheric pressure (101 325 Pa) and the hydrostatic pressure.
Initial conditions:
10
nCO2=nCH4=0 (A2)
Vgas=1 %Vavailable (A3)
BGD
9, 13243–13286, 2012
Impact of an 8.2-kyr-like event on
methane emissions in northern peatlands
S. Z ¨urcher et al.
Title Page
Abstract Introduction
Conclusions References
Tables Figures
◭ ◮
◭ ◮
Back Close
Full Screen / Esc
Printer-friendly Version
Interactive Discussion
Discussion
P
a
per
|
Dis
cussion
P
a
per
|
Discussion
P
a
per
|
Discussio
n
P
a
per
We assume the gaseous volume of N2to be 1% (see Sect. 2.3) of the available volume. With Eq. (1) (ideal gas law and mass balance) we can calculate the total amount of N2
nN2=
PE·(Vgas+VHdiss
N2)
RT (mol m
−2) (A5)
Now we add CH4and CO2as they are simulated in the model.
nCO2(t)=nCO2(t−1)+ ∆nCO2 (A6)
5
nCH4(t)=nCH4(t−1)+ ∆nCH4 (A7)
For the ebullition criterion we assume that it is critical if the gas volume exceeds 15 % of the available volume
Vgas≥15 %Vavailable (A8)
10
and computePgas,x.
Pgas,x=
nxRT
Vgas+
Vdiss Hx
= nxRT
15 %Vavailable+
85 %Vavailable Hx
(A9)
IfPgas≥PE, ebullition is triggered:
Pgas=
X
x
Pgas,x≥PE (A10)
We assume that a fifteenth of the total gas volume bubbles out. The assumption is not
15
critical (see Sect. 3.4)
BGD
9, 13243–13286, 2012
Impact of an 8.2-kyr-like event on
methane emissions in northern peatlands
S. Z ¨urcher et al.
Title Page
Abstract Introduction
Conclusions References
Tables Figures
◭ ◮
◭ ◮
Back Close
Full Screen / Esc
Printer-friendly Version
Interactive Discussion
Discussion
P
a
per
|
Dis
cussion
P
a
per
|
Discussion
P
a
per
|
Discussio
n
P
a
per
|
Therefore, the change in the total amount of CO2and CH4is
∆nx= ∆V Px
RT (mol m
−2
) (A12)
∆mx= ∆nx·Mx(g m−2) (A13)
whilenN2 is kept constant.
5
Acknowledgements. Financial support for this study was provided by the European Research Council advanced grant MATRICs (ERC grant agreement no. 226172) under the European Community’s Seventh Framework Programme. We appreciate support by the Swiss National Science Foundation through the National Centre of Competence in Research (NCCR) Climate and its grant of the Division of Climate and Environmental Physics, and by the European
Com-10
mission through the FP7 project Past4Future (grant no. 243908).
References
Alm, J., Saarnio, S., Nykanen, H., Silvola, J., and Martikainen, P.: Winter CO2, CH4 and N2O fluxes on some natural and drained boreal peatlands, Biogeochemistry, 44, 163–186, doi:10.1023/A:1006074606204, 1999. 13251
15
Baumgartner, M., Schilt, A., Eicher, O., Schmitt, J., Schwander, J., Spahni, R., Fischer, H., and Stocker, T. F.: High-resolution interpolar difference of atmospheric methane around the Last Glacial Maximum, Biogeosciences Discuss., 9, 5471–5508, doi:10.5194/bgd-9-5471-2012, 2012. 13245, 13246, 13263, 13264
Bergamaschi, P., Frankenberg, C., Meirink, J. F., Krol, M., Villani, M. G., Houweling, S.,
Den-20
tener, F., Dlugokencky, E. J., Miller, J. B., Gatti, L. V., Engel, A., and Levin, I.: Inverse model-ing of global and regional CH4emissions using SCIAMACHY satellite retrievals, J. Geophys. Res., 114, D22301, doi:10.1029/2009JD012287, 2009. 13247
Blunier, T. and Brook, E.: Timing of millennial-scale climate change in Antarctica and Greenland during the last glacial period, Science, 291, 109–112, doi:10.1126/science.291.5501.109,
25
BGD
9, 13243–13286, 2012
Impact of an 8.2-kyr-like event on
methane emissions in northern peatlands
S. Z ¨urcher et al.
Title Page
Abstract Introduction
Conclusions References
Tables Figures
◭ ◮
◭ ◮
Back Close
Full Screen / Esc
Printer-friendly Version
Interactive Discussion
Discussion
P
a
per
|
Dis
cussion
P
a
per
|
Discussion
P
a
per
|
Discussio
n
P
a
per
Blunier, T., Chappellaz, J., Schwander, J., Stauffer, B., and Raynaud, D.: Variations in atmospheric methane concentration during the holocene epoch, Nature, 374, 46–49, doi:10.1038/374046a0, 1995. 13245
Bock, M., Schmitt, J., Moeller, L., Spahni, R., Blunier, T., and Fischer, H.: Hydrogen isotopes preclude marine hydrate CH4 emissions at the onset of Dansgaard-Oeschger events,
Sci-5
ence, 328, 1686–1689, doi:10.1126/science.1187651, 2010. 13246
Bozbiyik, A., Steinacher, M., Joos, F., Stocker, T. F., and Menviel, L.: Fingerprints of changes in the terrestrial carbon cycle in response to large reorganizations in ocean circulation, Clim. Past, 7, 319-338, doi:10.5194/cp-7-319-2011, 2011. 13248, 13255
Broecker, W. and Peng, T.: Gas-exchange rates between air and sea, Tellus, 26, 21–35, 1974.
10
13250
Brook, E., Harder, S., Severinghaus, J., Steig, E., and Sucher, C.: On the origin and timing of rapid changes in atmospheric methane during the last glacial period, Global Biogeochem. Cy., 14, 559–572, doi:10.1029/1999GB001182, 2000. 13245, 13246, 13263
Bubier, J. L., Crill, P. M., Varner, R. K. and Moore, T. R. BOREAS TGB-01/TGB-03 CH4 chamber
15
flux data: NSA Fen. Data set, available online: http://www.daac.ornl.gov from Oak Ridge National Laboratory Distributed Archive Center, Technical report, Oak Ridge, Tennessee, USA, last access date: 24 September, 2012 (access date: September 2012), 1998. 13251 Cao, M., Marshall, S., and Gregson, K.: Global carbon exchange and methane emissions from
natural wetlands: application of a process-based model, J. Geophys. Res., 101, 14399–
20
14414, doi:10.1029/96JD00219, 1996. 13246
Chappellaz, J., Blunier, T., Raynaud, D., Barnola, J., Schwander, J., and Stauffer, B.: Syn-chronous changes in atmospheric CH4and Greenland climate between 40-KYR AND 8-KYR BP, Nature, 366, 443–445, doi:10.1038/366443a0, 1993. 13245
Chappellaz, J., Blunier, T., Kints, S., Dallenbach, A., Barnola, J., Schwander, J., Raynaud, D.,
25
and Stauffer, B.: Changes in the atmospheric CH4gradient between Greenland and Antarc-tica during the Holocene, J. Geophys. Res., 102, 15987–15997, doi:10.1029/97JD01017, 1997. 13245, 13246
Chen, Y.-H. and Prinn, R. G.: Estimation of atmospheric methane emissions between 1996 and 2001 using a three-dimensional global chemical transport model, J. Geophys. Res.,
30
111, D10307, doi:10.1029/2005JD006058, 2006. 13257, 13262, 13263