EQUILIBRIUM OF WATER BALANCE AS A BASIC PRECONDITION OF PROGRESSIVE
DEVELOPMENT OF LAND AREA
ROVNOVÁHA VODNÍ BILANCE JAKO ZÁKLADNÍ PŘEDPOKLAD PROGRESIVNÍHO
VÝVOJE KRAJINNÉHO PROSTORU
K. KUDRNA, M. ŠINDELÁŘOVÁ*
*University of South Bohemia in České Budějovice, Faculty of Agriculture, Department of General Crop Production, 370 05 České Budějovice, Czech Republic, Tel: + 420 387 772 411, Fax: + 420 385 300 122
Manuscript received: September 13, 2004; Reviewed: December 11, 2004; Accepted for publication: December 19, 2004
ABSTRACT
The proportion of water balance components – precipitation, transpiration, evaporation, underground waters and surface runoff – is a determining factor of stabile development of land area. But this proportion can be considerably disturbed and is permanently changing. Certain many-year averages are usually accepted as a stable state. That is why, in the presented work, we have tried to defi ne water balance on symmetry and invariance principles, to express it as a limit state, which would characterize it as a natural principle and enable comparison with the present balance.
KEY WORDS: limit state of balance, water balance, symmetry, invariance
ABSTRAKT
Determinujícím faktorem stabilního vývoje krajinného prostoru je poměr složek vodní bilance – srážek, transpirace, evaporace, podpovrchových vod a odtoku. Tento poměr je však velmi porušený, neustále se mění a určité mnohaleté průměry jednotlivých veličin jsou zpravidla přijímány jako ustálený stav. Proto v předložené práci byl učiněn pokus defi novat vodní bilanci na principech symetrie a invariance, dát jí výraz mezního stavu, jenž by ji charakterizoval jako přírodní zákon a umožnil srovnání se současnou bilancí.
INTRODUCTION
The aim of the presented work is to know principles actuating development of water balance of catchments and whole land areas. Enormous unfavourable interferences in water regimen of whole regions caused changes in water balance, which found expression in extension of deserts, drying up of lakes, unfavourable changes of climate and in water regimen of catchments. Without knowledge of equilibrium state of water balance it can’t be determined the share of agricultural-forest systems as area regulators on its regulation, and therefore it is not possible to specify necessary water management measures. If it is not possible to express these relations exactly, it can’t be thought of an effective regulation. That is why the solution must be based on stabile quantities and constants, which would enable a uniform initial state. That is why we have limited individual components of water balance by constants, which present for each quantity an absolute limit. As limiting values we have chosen characteristics of Planck’s radiant constants, containing velocity of light, and the characteristic of Boltzman’s constant. In this way we have achieved limit states of individual quantities and their invariance. But, a precondition for determination of limit state of water balance equilibrium, is necessity to divide the quantity of evapotranspiration hsevtr into the quantity of transpiration (hstr) and the quantity of evaporation (hsev). The reason for division the quantity of evapotranspiration is based on water balance being a result of a complicated regulation process, which proceeds on catchment, in which a number of physical phenomena participate, as transpiration, evaporation, fi ltration, accumulation and run-off, which are governed by their own physical principles. Solution of their effectiveness then is determined by their inserting into a sole regulation circuit. Process of forming of water balance as a regulation circuit is a matter of trailing regulation, at which regulated quantity is changing in dependence on changes of other physical quantities (hstr, hsev, infi ltration and the like). As the rate of fl ow q is a required value, then the whole process of water balance regulation is regulation on a constant value (q konst).
Controlling quantity hstr changes hsev and hso in limit stage so, that the ratio hsev/hso in relation to ratio hstr/ hsp would be in a certain constant relationship. In this way, a ratio regulation comes to being, which is typical for water balance in limit stage. Here is also the reason, why evapotranspiration (hsevtr) must be divided in two components – hstr and hsev, as evapotranspiration combines a controlling quantity with a controlled quantity, which is not possible. Though we determine the hsevtr quantity using the whole range of methods, and we proceed from it in all calculations, in equation of limit
stage of equilibrium we must divide it.
Changes of controlling quantity then we do using action quantities (change of species composition of stands, retaining water by polders, and the like).
From practical reasons, in addition to that, we tried to determine the stage of water balance at saturation of groundwater body, so that it would be possible to evaluate conditions at least of a certain grade of invariance using external couplings between input and output quantities of hydrological circuit. Such state we called “relative equilibrium” of water balance. Comparison of both stages enables to determine regulation of water balance by means of Unitary System of Agricultural, Forest and Water Management.
MATERAL AND METHODS
As source documentation, data on global precipitation total and evapotranspiration on Earth mainland have been used [3] as well as values of contemporaneous water balance on chosen catchments. Month precipitation amounts and temperatures in two decades 1931-40 and 1981-90 have been used on the upper Lužnice catchment (P 1008.81 km2), Nežárka river catchment
(P 1011.85 km2), and Malše river catchment (979 km2).
The same data have been used on Volyňka river catchment (P 426.53 km2), Blanice river catchment (P 799.73 km2)
and on catchments of three water streams in the Kladno region (P 952 km2). On the streams of Blanice and
Volyňka and the streams of Kladno region, also month discharge values on their water gauges in estuary have been evaluated. All source data have been gained in Czech Hydrological-Meteorological Institute in Prague, Doksany and České Budějovice.
Metodology
RESULTS
Deriving of water balance quantities in the limit state of equilibrium
Limit value of evapotranspiration:
hsevtr = 1 / 40.01*2*�*h*c2*(0.1*h*c)/k = 0.657
where 0,01 . 2π . h . c2 = C
1 = 3,74 (characteristic of the
1ststst radiant Planck’s constant)
0,1 = C2 = characteristic of the 2ndndnd radiant Planck’s
constant
All the others quantities have been derived from this parameter at the following progression:
hsevtr: C1, C2
hsev: C1, 1/C2
hsp: C1
hso: C2, k
hsev = 0.657 / (C1 * 1 / C2) = 0.253
hsp = 0.657 / C1 = 0.176 hso = 0.657 / (C2 . k)2 = 0.167
From this follows division hsevtr in the limit stage: hsevtr – hsev = 0.657 – 0.253 = 0.404 (hstr) or:
hstr =
1 – (0.253 hs + 0.176 hs + 0.167 hs) = 1 – 0.596 = 0.404
From quoted quantities then we derive the equation of limit stage of water balance:
hs = 0,404 hs + 0,253 hs + 0,176 hs + 0,167 hs hs = hstr + hsev + hsp + hso
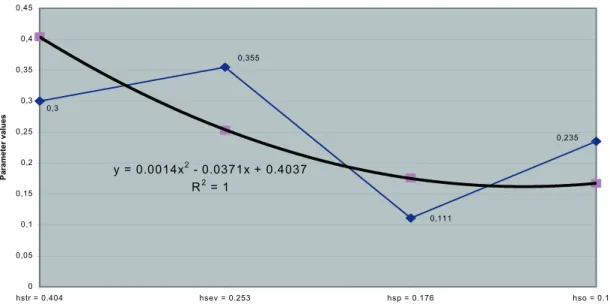
We get a curve expressed by the equation: y = 0.0014 x2 – 0.0371 x + 0.4037
Symmetry of values of limit stage of water balance equilibrium is expressed in the graph in fi gure 1. The graph enables comparison with the present (nonequilibrium) stage.
Symmetry of quantities of limit state of water balance equilibrium
0,235 0,355
0,3
0,111
y = 0.0014x2 - 0.0371x + 0.4037
R2 = 1
0 0,05 0,1 0,15 0,2 0,25 0,3 0,35 0,4 0,45
hstr = 0.404 hsev = 0.253 hsp = 0.176 hso = 0.167
Par
am
et
er
v
al
ues
Figure 1: Symmetry of values of water balance quantities in the limit state of equilibrium. [The values of quantities of the present (nonequilibrium) state are symmetrically arranged in relation to the counted coarse of the curve (axis
of symmetry).]
Generally, for the limit stage of water balance equilibrium is tru:
∀hs∅[ hstr >> hsev ⇒ hsp > hso]
Then we divide the individual components of water balance into two equivalent classes of parameters: Source parameters: hstrhsp and non-source parameters:
hso
hsev ; for them, the equation of symmetry is true:
∀(x) ∀(y) [ x = y2⇒ y2 = x]
That is why
∀hs∅ [ hstr/hsp = (hsev/hso)2]
If we use the calculated parameters, then in the limit stage will be:
hstr/hsp = 2.295 = (hsev/hso)2 = 1.5152
From the rate of fl ow on stream gauge we estimate hso hso * 1.515 = hsev
hs – (hsevtr + hso) = hsp hstr = hs – hsev –hsp – hso
hsevtr we estimate using for example Poljakov method [6], hso is estimated from measured stream fl ow values q in a long time series. These values then we compare with values estimated according to the equation of water balance in the limit stage of equilibrium (Mb).
That is why the set of limit constants (operators) in the equation of water balance enables to determine such symmetry of its quantities, that the curve expressed with the equation of operators y = 0.0014 x2 – 0.0371 x +
0.4037 is an axis of symmetry of real average values of water balance quantities, which have been measured in global (Earth) scale. The curve presents a limit state of water balance, which enables comparison of the state of water balance for any quantity of precipitation and on any catchment.
Course of groundwater body saturation in time series of 108 months in hydrological years 1976/77 – 1984/85 (Volyňka) is in fi gure 2.
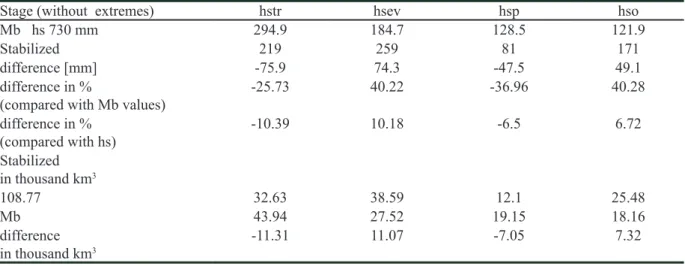
Table 1: The equilibrious and the stabilized (present) stages of the Earth water balance Tab. 1: Rovnovážný a ustálený (současný) stav vodní bilance na Zemi
Stage (without extremes) hstr hsev hsp hso
Mb hs 730 mm 294.9 184.7 128.5 121.9
Stabilized 219 259 81 171
difference [mm] -75.9 74.3 -47.5 49.1
difference in %
(compared with Mb values) -25.73 40.22 -36.96 40.28
difference in %
(compared with hs) -10.39 10.18 -6.5 6.72
Stabilized in thousand km3
108.77 32.63 38.59 12.1 25.48
Mb 43.94 27.52 19.15 18.16
difference
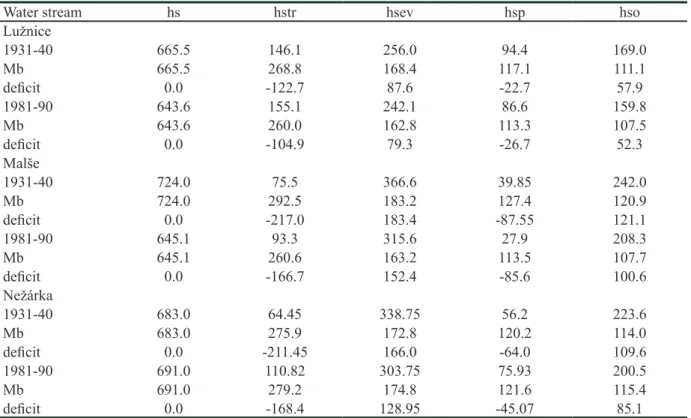
Water stream hs hstr hsev hsp hso Lužnice
1931-40 665.5 146.1 256.0 94.4 169.0
Mb 665.5 268.8 168.4 117.1 111.1
defi cit 0.0 -122.7 87.6 -22.7 57.9
1981-90 643.6 155.1 242.1 86.6 159.8
Mb 643.6 260.0 162.8 113.3 107.5
defi cit 0.0 -104.9 79.3 -26.7 52.3
Malše
1931-40 724.0 75.5 366.6 39.85 242.0
Mb 724.0 292.5 183.2 127.4 120.9
defi cit 0.0 -217.0 183.4 -87.55 121.1
1981-90 645.1 93.3 315.6 27.9 208.3
Mb 645.1 260.6 163.2 113.5 107.7
defi cit 0.0 -166.7 152.4 -85.6 100.6
Nežárka
1931-40 683.0 64.45 338.75 56.2 223.6
Mb 683.0 275.9 172.8 120.2 114.0
defi cit 0.0 -211.45 166.0 -64.0 109.6
1981-90 691.0 110.82 303.75 75.93 200.5
Mb 691.0 279.2 174.8 121.6 115.4
defi cit 0.0 -168.4 128.95 -45.07 85.1
Table 2: Comparison of water balance on catchments of some water streams in decades 1931-40 and 1981-90 with the equilibrious stage
Tab. 2: Porovnání vodní bilance na povodích některých vodních toků v desetiletích 1931-40 a 1981-90 s rovnovážným stavem
Table 3: Evaluations of statistic dependence Tab. 3: Vyhodnocení statistických závislostí
Symbols and meaning: NF – non-linear fall LF – linear fall LG – linear grow NG – non-linear grow Symboly a jejich význam: NF – nelineárně klesá LF – lineárně klesá LG – lineárně roste NG – nelineárně roste Water stream
Function Volyňka R
2 Blanice R2
hsp f(hso) NF 0.94 hsp f(hs above-normal) - 0.13
hso f(hs) LG 0.48 hsp f(hs below-normal) LG 0.63
q f(t) NF 0.70 hsp f(hsev) NF 0.80
hsev f(hs) LG 0.46 hso f(hs) NG 0.69
hsev f(hs below-normal) LG 0.73
hsev f(hs above-normal) NG 0.84
q f(t) NF 0.49
hsp f(hso)
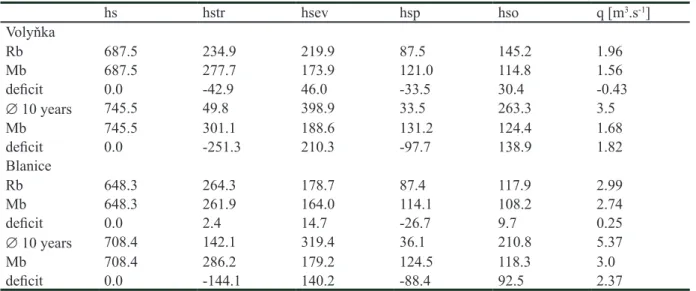
Table 4: Water balance at the maximal saturation of groundwater body (Relative equilibrium). (In the table, averages of last three years are stated, when the groundwater body was saturated.)
Tab. 4: Vodní bilance při maximálním nasycení zvodně (Relativní rovnováha). (V tab. jsou uvedeny průměry posledních 3 roků, kdy došlo k nasycení.)
hs hstr hsev hsp hso q [m3.s-1]
Volyňka
Rb 687.5 234.9 219.9 87.5 145.2 1.96
Mb 687.5 277.7 173.9 121.0 114.8 1.56
defi cit 0.0 -42.9 46.0 -33.5 30.4 -0.43
∅ 10 years 745.5 49.8 398.9 33.5 263.3 3.5
Mb 745.5 301.1 188.6 131.2 124.4 1.68
defi cit 0.0 -251.3 210.3 -97.7 138.9 1.82
Blanice
Rb 648.3 264.3 178.7 87.4 117.9 2.99
Mb 648.3 261.9 164.0 114.1 108.2 2.74
defi cit 0.0 2.4 14.7 -26.7 9.7 0.25
∅ 10 years 708.4 142.1 319.4 36.1 210.8 5.37
Mb 708.4 286.2 179.2 124.5 118.3 3.0
defi cit 0.0 -144.1 140.2 -88.4 92.5 2.37
Water stream hs hstr hsev hsp hso q [m3.s-1]
Bakovský Bakovsk
Bakovsk s. 516.6 275.1 93.93 85.57 62 0.82
Mb 516.6 208.7 130.7 90.92 86.3 1.14
defi cit 0.0 66.4 -36.8 -5.35 -24.3
Zákolanský kolanskkolansk s. 541.5 255.2 131.5 68.0 86.8 0.706
Mb 541.5 218.8 137.0 95.3 90.4 0.76
defi cit 0.0 36.4 -5.5 -27.3 -3.6
Loděnický nicknick s. 535.0 273.9 109.1 80.0 72.0 0.61
Mb 535.0 216.14 135.35 94.06 89.3 0.77
defi cit 0.0 57.76 -26.25 -14.06 -17.3
Table 5: Catchments of the Kladno region water streams. Time series of 1979-88. Tab. 5: Povodí vodních toků kladenského regionu. Řada 1979-88.
DISCUSSION
The derived equation of limit state of water balance equilibrium proved, that the characteristics of Planck’s radiant constants C1 and C2 have much wider effect and
can be used as operators which, in this case, limit values of individual quantities of water balance. We managed to prove clearly, that a key problem on Earth mainland consists in insuffi cient transpiration as a controlling quantity of water balance, on which the other quantities are depended. Particularly notable is a ratio regulation expressed by the relation:
hsp
hstr = 2
� � � � � �
hso hsev
balance. Using the principle of symmetry and invariance it has been proved, that the state of limit water balance equilibrium is invariant, presents its maximal stability and enables comparison with the present state of water balance in global scale as well as on individual catchments. The defi cits, evaluated in comparison of the present and the limit balance then proved, that water balance on Earth mainland is disturbed and needs to increase the infl uence of the controlling quantity – transpiration by 11.31 thousand km3, that is by 25.73 % as compared
with equilibrium state. Similarly, in underground water supplies, above 7 thousand km3 water lack.
-200 -100 0 100 200 300 400
1 4 7 10 13 16 19 22 25 28 31 34 37 40 43 46 49 52 55 58 61 64 67 70 73 76 79 82 85 88 91 94 97
10
0
10
3
10
6
t(x)
hs
p
[m
m
]
Figure 2: Coarse of groundwater body saturation during 108 months (Volyňka) Obr. 2: Průběh sycení zvodně v řadě 108 měsíců (Volyňka)
Consequently, also quantities of water balance decreased, but in both decades the water balance equilibrium is disturbed. Similarly, on the other streams, evaporation enormously prevails transpiration, which results in all cases in high runoff, which prevails the volume of underground waters. Calculations, which we realized on Volyňka and Blanice catchments at groundwater body saturation (state, which we characterized as a relative water balance equilibrium - Rb) (table 4) then proved, that (as a result of groundwater body saturation) the defi cit of all quantities decreases substantially in comparison with normal measured 10 year average. On Blanice, hstr is even quite well balanced. This state was refl ected in run-off values, which showed the difference in comparison with the equilibrium stage only 0.43 m3.s-1
on Volyňka river, and 0.25 m3.s-1 on Blanice river. Under
such circumstances, discharge would be stabile. Without groundwater body saturation (∅ 10 years) the defi cit in discharge was 1.82 m3.s-1 on Volyňka and 2.37 m3.s-1 on
Blanice river.
For comparison, we have evaluated 3 streams of the Kladno region, which belongs to the area with low rainfall. On the Bakovský and the Loděnický streams, water balance corresponds with general equation of equilibrium state, on the Zákolanský stream the ratio hsp : hso is disturbed. The reason of the differences is following: the Bakovský stream fl ows through deep loess and alluvial loam, the Loděnický stream is forested and there is a cascade of
pond reservoirs on it. The Zákolanský stream has not such conditions and that is the reason of disturbance in the hsp : hso. Flow measurements then proved that, according to the equation of limit stage of equilibrium, the fl ow q would have to be increased, which refl ects insuffi cient rainfall hs. Equation of equilibrium state thus proved also this property of the catchment. In the project, developed for this region [4], it has also been proved, that the only reserve, which is at disposal, are enormous fl ows from fl ood rainfalls, which must be impounded in retention reservoirs. That is why, in this forest-less area, 2885 ha of new forests around water streams and basins must be designed for increasing of transpiration, as well as 34 retention reservoirs with the total volume of 5.25 mil. m3 and 5 pond reservoirs with the total volume
of 2.05 mil. m3, to increase also water-surface evaporation
as well as for releases.
infi ltration (pond reservoirs, polders, delaying discharge troughs and other things). In connection with world mainland water balance we cannot help thinking, if the disturbance of the controlling quantity is not one of the reasons of extreme climate changes on the Earth. Then, evaporation is extremely high, and it results in runoff and shortage of water in the mainland groundwater body (aquifer).
ACKNOWLEDGMENT
This study was supported by the Grant Project of Ministry of Education of the Czech Republic, identifi cation code MSM 122200002/I.
REFERENCES
[1] Budyko, M. I. Evolucija biosfery. Leningrad: Gidrometeoizdat, 1984.
[2] Budyko, M. I. Zavisimosť srednej temperatury
ot izmenenija solnečnoj radiacii. Meteor. i gidrologija, 1955, vol. 10, p. 3-10.
[3] Kalinin, G. P. Kratkij obzor issledovanija vodoobmena v prirode, in: Globalnyj vodoobmen, SSSR, 1975, p. 3-13.
[4] Kudrna, K. Studie k řešení komplexních
hospodářsko-technických úprav v zemědělských
soustavách. (Study to solution of land management organization in agricultural systems.) Pozemkový úřad Kladno, 1994, 180 p.
[5] Kudrna, K., Šindelářová, M. Lesy jako plošný regulátor vodní bilance hydrologického obvodu. (Forests as an area regulator of water balance in hydrological circuit.) Lesnická práce, 2003, vol. 82, no. 2, p. 39-41.
[6] Poljakov, B. V. oljakovoljakov Gidravličeskij analiz i rasčoty. Leningrad: Gidrometeoizdat, 1946.
[7] WignerWW , E. P. Symmetries and Refl ections. Indiana Univ. Press, 1970, 315 p.
Symbols and indications used in the work Použité symboly a označení
Symbol Meaning Význam
P catchment area in km2 or ha plocha povodí v km2 nebo v ha
C1 characteristic of the 1ststst radiant Planck’s constant
3.74 1. vyzařovací charakteristika konstanty Planckovy 3,74
C2 characteristic of the 2ndndnd radiant Planck’s constant
1.4388 2. vyzařovací charakteristika konstanty Planckovy 1,4388
k characteristic of the Boltzman constant 1.380 charakteristika Boltzmannovy konstanty 1,380
hs precipitation quantity in mm množství srážek v mm
hsevtr evapotranspiration in mm celkový výpar (evapotranspirace) v mm
hstr transpiration in mm transpirace v mm
hsev evaporation in mm evaporace v mm
hsp underground waters in mm podpovrchové vody v mm
hso runoff in mm odtok v mm
q discharge in estuary of water streams in m3.s-1 průprpr tok v ústí vodních toků ch tokch tok v m3.s-1
Rb relative water balance relativní vodní bilance
Mb state of limit equilibrium of water balance mezní stav rovnováhy vodní bilance
h characteristic of universal Planck’s constant
6.624 charakteristika univerzální konstanty Planckovy 6,624