HESSD
10, 8421–8465, 2013Comparison of different evaporation
estimates
P. Trambauer et al.
Title Page
Abstract Introduction
Conclusions References
Tables Figures
◭ ◮
◭ ◮
Back Close
Full Screen / Esc
Printer-friendly Version
Interactive Discussion
Discussion
P
a
per
|
D
iscussion
P
a
per
|
Discussion
P
a
per
|
Discuss
ion
P
a
per
|
Hydrol. Earth Syst. Sci. Discuss., 10, 8421–8465, 2013 www.hydrol-earth-syst-sci-discuss.net/10/8421/2013/ doi:10.5194/hessd-10-8421-2013
© Author(s) 2013. CC Attribution 3.0 License.
Geoscientiic Geoscientiic
Geoscientiic Geoscientiic
Hydrology and Earth System
Sciences
Open Access
Discussions
This discussion paper is/has been under review for the journal Hydrology and Earth System Sciences (HESS). Please refer to the corresponding final paper in HESS if available.
Comparison of di
ff
erent evaporation
estimates over the African continent
P. Trambauer1, E. Dutra2, S. Maskey1, M. Werner1,3, F. Pappenberger2, L. P. H. van Beek4, and S. Uhlenbrook1,5
1
UNESCO-IHE, Department of Water Science and Engineering, P.O. Box 3015, 2601 DA Delft, the Netherlands
2
ECMWF, Shinfield Park, RG2 9AX, Reading, UK
3
Deltares, P.O. Box 177, 2600MH Delft, the Netherlands
4
Utrecht University, Dept. Physical Geography, Utrecht, the Netherlands
5
Delft University of Technology, Water Resources Section, P.O. Box 5048, 2600 GA Delft, the Netherlands
Received: 3 June 2013 – Accepted: 21 June 2013 – Published: 2 July 2013
Correspondence to: P. Trambauer ([email protected])
HESSD
10, 8421–8465, 2013Comparison of different evaporation
estimates
P. Trambauer et al.
Title Page
Abstract Introduction
Conclusions References
Tables Figures
◭ ◮
◭ ◮
Back Close
Full Screen / Esc
Printer-friendly Version
Interactive Discussion
Discussion
P
a
per
|
D
iscussion
P
a
per
|
Discussion
P
a
per
|
Discuss
ion
P
a
per
|
Abstract
Evaporation is a key process in the water cycle, with implications ranging from water management, to weather forecast and climate change assessments. The estimation of continental evaporation fluxes is complex and typically relies on continental-scale hy-drological or land-surface models. However, it appears that most global or continental-5
scale hydrological models underestimate evaporative fluxes in some regions of Africa, and as a result overestimate stream flow. Other studies suggest that land-surface mod-els may overestimate evaporative fluxes. In this study, we computed actual evaporation for the African continent using a continental version of the global hydrological model PCR-GLOBWB, which is based on a water balance approach. Results are compared 10
with other independently computed evaporation products: the evaporation results from the ECMWF reanalysis ERA-Interim and ERA-Land (both based on the energy balance approach), the MOD16 evaporation product, and the GLEAM product. Three other al-ternative versions of the PCR-GLOBWB hydrological model were also considered. This resulted in eight products of actual evaporation, which were compared in distinct re-15
gions of the African continent spanning different climatic regimes. Annual totals, spatial
patterns and seasonality were studied and compared through visual inspection and statistical methods. The comparison shows that the representation of irrigation areas has an insignificant contribution to the actual evaporation at a continental scale with
a 0.5◦ spatial resolution. The choice of meteorological forcing data has a larger e
ffect 20
on the evaporation results, especially in the case of the precipitation input as different
precipitation input resulted in significantly different evaporation in some of the studied
regions. ERA-Interim evaporation is generally the highest of the selected products fol-lowed by ERA-Land evaporation. The satellite based products (GLEAM and MOD16) do not show regular behaviour when compared to the other products, though this de-25
pends on the region and the season considered. The results from this study allow for
a better understanding of the differences between products in each climatic region.
Through an improved understanding of the causes of differences between these
HESSD
10, 8421–8465, 2013Comparison of different evaporation
estimates
P. Trambauer et al.
Title Page
Abstract Introduction
Conclusions References
Tables Figures
◭ ◮
◭ ◮
Back Close
Full Screen / Esc
Printer-friendly Version
Interactive Discussion
Discussion
P
a
per
|
D
iscussion
P
a
per
|
Discussion
P
a
per
|
Discuss
ion
P
a
per
|
ucts and their uncertainty, this study provides information to improve the quality of evaporation products for the African continent and, consequently, leads to improved water resources assessments at regional scale.
1 Introduction
Evaporation is one of the most important fluxes in the hydrological cycle. Recently, 5
there has been a wide interest in estimating evaporation fluxes on a continental and global scales for a variety of purposes (van der Ent et al., 2010; Teuling et al., 2009; Miralles et al., 2011a; Vinukollu et al., 2011; Mu et al., 2011; Mueller et al., 2011, 2013; Jiménez et al., 2011). The accurate estimation of these fluxes on large scales
has, however, always been a difficult issue. Direct measurements of evaporation are
10
only possible over small regions, e.g. using flux towers, and are limited to only few sites, particularly in some developed regions. Most of the existing global products are verified only in particular regions with available data, generally in North America and Europe (Mu et al., 2011; Alton et al., 2009; Zhang et al., 2010; Miralles et al., 2011b). Some studies have evaluated the developed global evaporation product with evapora-15
tion estimates by subtracting runofffrom the precipitation (Vinukollu et al., 2011; Zhang
et al., 2010). Few studies have compared the results of different evaporation products.
Vinukollu et al. (2011) compared results of six evaporation products (from three process based models forced with two radiation data sets) by computing the ensemble mean and product range globally, and by comparing the annual totals of each product over lat-20
itude bands. The LandFlux initiative, supported by GEWEX (http://www.gewex.org/) is clearly dedicated to evapotranspiration. In the framework of this initiative, several global evaporation datasets were evaluated and compared (Jiménez et al., 2011; Mueller et al., 2011), and global merged benchmarking evaporation products were derived (Mueller et al., 2013). To our knowledge, none of the existing studies regarding large 25
thor-HESSD
10, 8421–8465, 2013Comparison of different evaporation
estimates
P. Trambauer et al.
Title Page
Abstract Introduction
Conclusions References
Tables Figures
◭ ◮
◭ ◮
Back Close
Full Screen / Esc
Printer-friendly Version
Interactive Discussion
Discussion
P
a
per
|
D
iscussion
P
a
per
|
Discussion
P
a
per
|
Discuss
ion
P
a
per
|
ough comparison of different evaporation products over diverse African regions and
climates.
In most cases, estimations of actual evaporation at a continental scale rely on com-plementary data such as (i) remote sensing, (ii) continental-scale hydrological models,
or (iii) land surface models. However, in some ways, these three different data sources
5
follow different theoretical basis or approaches in estimating evaporation. For example
there is a significant difference in the model objective of land surface models and
hy-drological models. The former focus on providing boundary conditions (turbulent fluxes) to the atmosphere (mainly focusing on the energy balance) whereas the latter focus on closing the terrestrial water balance (Overgaard et al., 2006). In this study the class of 10
hydrological models is represented by PCR-GLOBWB (van Beek and Bierkens, 2009). This model is based on the water balance approach that focuses on water availability and vertical and lateral transfer of water. The class of land-surface models is repre-sented by the ECMWF reanalysis Land (Balsamo et al., 2012, ERAL) and ERA-Interim (ERAI, Dee et al., 2011) using a land surface model that describe the vertical 15
exchanges of heat and water between the atmosphere and the land surface on a grid point scale (Balsamo et al., 2011a). The evaporation results of both are compared with the remote sensing based data (MOD16 product by Mu et al., 2011, 2007; and the GLEAM product by Miralles et al., 2011b). It is worth clarifying that PCR-GLOBWB
and ERAL evaporation come from offline (or stand alone) simulations, while ERAI is a
20
coupled land-atmosphere reanalysis product. The quality of the individual products can
be influenced by different climatic regions. Therefore, in this study we differentiated the
hydro-climatic regions in Africa and the comparison is carried out for each region.
The main aim of the present paper is to compare different actual evaporation
esti-mates for the African continent in order to gain a better understanding of the dispari-25
ties between the different products within defined regions and the possible causes of
these differences (e.g. resulting from the meteorological input data or from the model
structure in the derivation of actual evaporation). This understanding can lead to
HESSD
10, 8421–8465, 2013Comparison of different evaporation
estimates
P. Trambauer et al.
Title Page
Abstract Introduction
Conclusions References
Tables Figures
◭ ◮
◭ ◮
Back Close
Full Screen / Esc
Printer-friendly Version
Interactive Discussion
Discussion
P
a
per
|
D
iscussion
P
a
per
|
Discussion
P
a
per
|
Discuss
ion
P
a
per
|
proved evaporation estimates for the African continent and, consequently, better water resources assessments.
2 Data and methods
2.1 Evaporation data sets
This section describes briefly the evaporation products used in this study (see Table 1 5
for a summary). These are all global products extracted for Africa at a daily temporal resolution, with the exception of MOD16 product, which is a monthly product. The period chosen in this study for the evaporation comparison is 2000–2010, which is the period common to all the products.
Four of the evaporation products considered in this study are based on the PCR-10
GLOBWB hydrological model (see Table 1, these products are indicated by the PCR
prescript) with differences in the input data or addition of specific processes to assess
their impact on the resulting evaporation product. Each of the products is described in detail below. The description of the first product based on PCR-GLOBWB also presents a general explanation of the PCR-GLOBWB hydrological model with the selected forc-15
ing data. We then describe the other PCR-GLOBWB based products by emphasizing
only the differences to the first product.
2.1.1 PCR-GLOBWB
The PCR-GLOBWB evaporation product was calculated by means of a continental scale version of the distributed global hydrological model PCR-GLOBWB (van Beek 20
and Bierkens, 2009), which was set up for the African continent. PCR-GLOBWB is a
process based model that is applied on a cell-by-cell basis (0.5◦
×0.5◦). PCR-GLOBWB
is forced with potential evaporation, and actual evaporation is derived through
simula-tion. Initially, the model converts potential reference evaporationE0 into potential soil
evaporation (ES0) and potential transpiration (T0) by introducing monthly and minimum
HESSD
10, 8421–8465, 2013Comparison of different evaporation
estimates
P. Trambauer et al.
Title Page
Abstract Introduction
Conclusions References
Tables Figures
◭ ◮
◭ ◮
Back Close
Full Screen / Esc
Printer-friendly Version
Interactive Discussion
Discussion
P
a
per
|
D
iscussion
P
a
per
|
Discussion
P
a
per
|
Discuss
ion
P
a
per
|
crop factors. The crop factors are specified on a monthly basis for short and tall veg-etation fractions, as well as for the open water fraction within each cell. These crop factors are calculated as a function of the Leaf Area Index (LAI) as well as of the crop factors for bare soil and under full cover conditions (van Beek et al., 2011). Interception evaporation reduces potential transpiration, and the availability of soil moisture storage 5
is responsible for the reductions of the potential bare soil evaporation and transpira-tion. The potential bare soil evaporation over the unsaturated area is only limited by the unsaturated hydraulic conductivity of the upper soil layer. For the saturated area the rate of evaporation cannot exceed the saturated hydraulic conductivity of the up-per soil layer. Transpiration only takes place for the unsaturated fraction of the cells 10
and depends on the total available moisture in the soil layers (van Beek and Bierkens, 2009).
The model is described in full detail elsewhere (van Beek et al., 2011; van Beek and Bierkens, 2009). We hereby describe the forcing data applied in the first version of the model used in this study (product 1). Three other evaporation products were derived 15
also from this model with changes in either the forcing data or in the model structure (products 2, 3 and 4, Table 1).
Meteorological forcing
The model is directly forced with daily precipitation, temperature and potential evap-oration as calculated from other meteorological variables (2 m temperature, 2 m dew-20
point temperature, surface pressure, wind speed, and net radiation). Meteorological forcing was obtained from the ERA-Interim (ERAI) reanalysis data of the past 32 yr (1979–2010). The ERA-Interim precipitation data used in this study is available at a resolution of approximately 0.7 degrees and was corrected with GPCP v2.1 (product of the Global Precipitation Climatology Project) to reduce the bias when compared to 25
measured products (Balsamo et al., 2010; Szczypta et al., 2011). The GPCP v2.1 is
available globally at 2.5◦
×2.5◦resolution with a monthly frequency, covering the period
HESSD
10, 8421–8465, 2013Comparison of different evaporation
estimates
P. Trambauer et al.
Title Page
Abstract Introduction
Conclusions References
Tables Figures
◭ ◮
◭ ◮
Back Close
Full Screen / Esc
Printer-friendly Version
Interactive Discussion
Discussion
P
a
per
|
D
iscussion
P
a
per
|
Discussion
P
a
per
|
Discuss
ion
P
a
per
|
several sources (satellite data, rain gauge data, etc.) into a merged product (Szczypta
et al., 2011; Huffman et al., 2009). The meteorological forcing was applied with the
same spatial resolution of 0.5◦as the model, using bilinear interpolation to downscale
from the ERAI grid to the model grid, and is assumed to be constant over the grid cell.
Potential evaporation from reanalysis data 5
The PCR-GLOBWB model requires potential evaporation as a meteorological input, and this therefore needs to be estimated externally. There are several approaches to estimate potential evaporation, with diverse levels of data requirements and
complex-ity, with different temporal scales, physically based and empirical, developed under
specific regions or climates. The Hargreaves equation was used because it has the 10
advantage to be applied in data scarce regions, which is the case for several regions in Africa. Droogers and Allen (2002) compared Penman-Monteith and Hargreaves ref-erence evaporation estimates on a global scale and suggest that Hargreaves formula should be considered in regions where accurate weather data cannot be expected. The Hargreaves method requires less parameterization, leading to notably smaller sensi-15
tivity to error in climatic inputs (Hargreaves and Allen, 2003). Moreover, Sperna Wei-land et al. (2012) studied several methods to calculate daily global reference potential evaporation from Climate Forecast System Reanalysis (CFSR) data from the National Center for Atmospheric Research, for application in a hydrological model study. They
compared six different methods and found a re-calibrated form of the Hargreaves
equa-20
tion (increasing the multiplication factor of the equation from 0.0023 to 0.0031) to out-perform the other alternatives.
2.1.2 PCR_PM
The PCR_PM evaporation product results from forcing the PCR-GLOBWB hydrolog-ical model with Penman-Monteith potential evaporation. The Penman-Monteith (P-M) 25
Al-HESSD
10, 8421–8465, 2013Comparison of different evaporation
estimates
P. Trambauer et al.
Title Page
Abstract Introduction
Conclusions References
Tables Figures
◭ ◮
◭ ◮
Back Close
Full Screen / Esc
Printer-friendly Version
Interactive Discussion
Discussion
P
a
per
|
D
iscussion
P
a
per
|
Discussion
P
a
per
|
Discuss
ion
P
a
per
|
though this formula is in general highly recommended by the FAO and is considered to be one of the most physically based methods, it is impacted by the site aridity and is reported to underestimate the potential evaporation in some regions of Africa and other arid regions (Sperna Weiland et al., 2012; Hargreaves and Allen, 2003). Never-theless, in this study we estimate the potential evaporation with the Penman-Monteith 5
method using input variables derived from the ERAI data. This is then used to force the
PCR-GLOBWB hydrological model to assess the difference in the actual evaporation
resulting from the different inputs in potential evaporation. This product differs from the
first product (PCR-GLOBWB) only in the forcing potential evaporation data set used.
2.1.3 PCR_TRMM
10
This evaporation product (PCR_TRMM) results from the PCR-GLOBWB hydrological model simulation, but forced with TRMM 3B42 v6 precipitation data, which has finer spatial resolution and is independent of the ERAI forecasting platform. Other meteo-rological inputs, including potential evaporation are as in the product 1 version of the PCR-GLOBWB model. Including this product in the comparison allows for assessing 15
the impact that the precipitation forcing has on the resulting actual evaporation. The TRMM 3B42 v6 precipitation data was chosen from the available satellite-based rainfall estimates following the results of a recent study that validated six of these products and one reanalysis product (ERA-Interim) over four African basins (Thiemig et al., 2012), and found TRMM 3B42 together with RFE 2.0 (NOAA African Precipitation Estimation 20
Algorithm) to be the most accurate products when compared to ground data.
2.1.4 PCR_Irrig
This product (PCR_Irrig) is also the result of the PCR-GLOBWB hydrological model when irrigation is included in the model structure. It was introduced in the study as some African countries such as Egypt, Morocco, Sudan and South Africa contain large 25
irrigation areas. In South Africa, for example, there is a high density of small
HESSD
10, 8421–8465, 2013Comparison of different evaporation
estimates
P. Trambauer et al.
Title Page
Abstract Introduction
Conclusions References
Tables Figures
◭ ◮
◭ ◮
Back Close
Full Screen / Esc
Printer-friendly Version
Interactive Discussion
Discussion
P
a
per
|
D
iscussion
P
a
per
|
Discussion
P
a
per
|
Discuss
ion
P
a
per
|
voirs for irrigation purposes (see McClain, 2012). The different components of
evap-oration (soil evapevap-oration, transpiration and open water evapevap-oration from reservoirs) are expected to increase as a result of irrigation practices, reaching potential evapo-ration rates under optimal irrigation practices. Moreover, a recent study by van Beek et al. (2011) suggested that the PCR-GLOBWB hydrological model might underesti-5
mate evaporation given that the model does not fully consider irrigated areas. They compared the PCR-GLOBWB evaporation results with the reanalyses ERA-40 (reanal-ysis by ECMWF, a previous version of the ERA-Interim) evaporation and found ERA-40 evaporation to be consistently higher than the evaporation data simulated by
PCR-GLOBWB. They attributed these differences to irrigation, as they indicated that
ERA-10
40 (which includes data assimilation) accounts implicitly for irrigation by decreasing the temperature to compensate for the energy loss as latent heat. The original version of PCR-GLOBWB, on the other hand, includes irrigated areas using crop factors, but actual evaporation cannot exceed the available soil moisture as the additional
contribu-tion due to irrigacontribu-tion is not modelled. The difference between the two actual evaporation
15
products represent the transpiration of the water applied (van Beek et al., 2011). To include the influence of irrigation the original PCR-GLOBWB hydrological model was adapted. The irrigation requirement for the irrigated crop area within a cell is sup-plied through the storage of freshwater in the cell. For each cell where irrigation takes place, it is assumed that at least a small farm reservoir is included and that this pro-20
vides sufficient storage to satisfy the demand. The irrigated area within each cell, water
requirements and irrigation cropping patterns are extracted from the “Global map of ir-rigated areas” from Siebert et al. (2007) and FAO (1997). This modified version of the hydrological model serves to assess the impact of adding irrigation in the model structure on the actual evaporation results.
25
2.1.5 ERAI
Jan-HESSD
10, 8421–8465, 2013Comparison of different evaporation
estimates
P. Trambauer et al.
Title Page
Abstract Introduction
Conclusions References
Tables Figures
◭ ◮
◭ ◮
Back Close
Full Screen / Esc
Printer-friendly Version
Interactive Discussion
Discussion
P
a
per
|
D
iscussion
P
a
per
|
Discussion
P
a
per
|
Discuss
ion
P
a
per
|
uary 1979 to present date with a horizontal resolution of approximately 0.7 degrees and 62 vertical levels. A comprehensive description of the ERAI product is available in Dee et al. (2011). The ERAI evaporation is the result from the coupled land-atmosphere simulations. The ERAI land component is the model TESSEL (Van den Hurk et al., 2000) that is coupled to the atmospheric model, therefore being forced (and providing 5
fluxes to the atmosphere) with the ERAI forecasts of near surface conditions (tem-perature, humidity, pressure and wind speed) and downward energy and water fluxes (precipitation, solar and thermal radiation).
2.1.6 ERAL
ERA-Land (ERAL, Balsamo et al., 2012) is a global land-surface data set covering the 10
period 1979–2010. ERA-Land is a land-surface only simulation (offline) carried out with
HTESSEL (Balsamo et al., 2011a, b), an updated version of TESSEL (that was used in ERAI), with meteorological forcing from ERAI and precipitation adjustments based on GPCP. HTESSEL computes the land surface response to the near surface atmo-spheric conditions forcing, and estimates the surface water and energy fluxes and the 15
temporal evolution of soil temperature, moisture content and snowpack conditions. At the interface to the atmosphere each grid box is divided into fractions (tiles), with up to six fractions over land (bare ground, low and high vegetation, intercepted water, shaded and exposed snow). The grid box surface fluxes are calculated separately for each tile, leading to a separate solution of the surface energy balance equation and the skin 20
temperature. The latter represents the interface between the soil and the atmosphere. Below the surface, the vertical transfer of water and energy is performed using four vertical layers to represent soil temperature and moisture. Soil heat transfer follows a
Fourier law of diffusion, modified to take into account soil water freezing/melting.
Wa-ter movement in the soil is deWa-termined by Darcy’s Law, and surface runoff accounts
25
for the sub-grid variability of orography (Balsamo et al., 2009). HTESSEL is part of the integrated forecast system at ECMWF with operational applications ranging from short-range to monthly and seasonal weather forecasts.
HESSD
10, 8421–8465, 2013Comparison of different evaporation
estimates
P. Trambauer et al.
Title Page
Abstract Introduction
Conclusions References
Tables Figures
◭ ◮
◭ ◮
Back Close
Full Screen / Esc
Printer-friendly Version
Interactive Discussion
Discussion
P
a
per
|
D
iscussion
P
a
per
|
Discussion
P
a
per
|
Discuss
ion
P
a
per
|
2.1.7 MOD16
Remote sensing provides an indirect method to estimate global actual and potential evaporation. MOD16 is described in detail by Mu et al. (2011, 2007), and computes potential and actual evaporation using MODIS (Moderate resolution Imaging Spectro-radiometer) land cover, albedo, leaf area index (LAI), an Enhanced Vegetation Index 5
(EVI), and a daily meteorological reanalysis data set from NASA’s Global Modelling
and Assimilation Office (GMAO) as inputs for regional and global evaporation mapping
and monitoring (Mu et al., 2011). This method is an adaptation of a previous version of the evaporation algorithm by Mu et al. (2007), which is based on the remotely sensed evaporation model developed by Cleugh et al. (2007).
10
Mu et al. (2011) computed potential evaporation with the Penman-Monteith method driven by GEOS-5 daily meteorological reanalysis inputs and MODIS derived vegeta-tion data: land surface temperature, leaf area index (LAI), gross primary productivity
and vegetation indices were extracted from four different MODIS products. To derive
actual from potential evaporation Mu et al. (2007) include multipliers to halt plant tran-15
spiration and soil evaporation as follows: low temperatures and water stress (due to high vapour pressure deficit) limit the transpiration flow, and soil evaporation is limited by a complementary relationship hypothesis which defines land-atmospheric interac-tions from vapour pressure deficit and relative humidity (Mu et al., 2007).
This product has been validated against actual measurements in several regions. 20
Mu et al. (2011) evaluated their algorithm using evaporation observations at 46 eddy covariance flux towers in the United States and Canada. In their paper they present the Root Mean Square Error (RMSE), correlation, and Taylor skill score for each flux tower, and they report that the average mean absolute bias values are 24.1 % of the evapo-ration measurements. Kim et al. (2012) validated MOD16 global terrestrial evapoevapo-ration 25
products at 17 flux tower locations in Asia and found good agreement only at five
loca-tions (r=0.50 to 0.76, bias=−1.42 to 1.99 mm 8d−1; RMSE=1.99 to 8.96 mm 8d−1).
HESSD
10, 8421–8465, 2013Comparison of different evaporation
estimates
P. Trambauer et al.
Title Page
Abstract Introduction
Conclusions References
Tables Figures
◭ ◮
◭ ◮
Back Close
Full Screen / Esc
Printer-friendly Version
Interactive Discussion
Discussion
P
a
per
|
D
iscussion
P
a
per
|
Discussion
P
a
per
|
Discuss
ion
P
a
per
|
forested land cover. They observed poor performance at sites with grassland cover in arid and polar climates. The MODIS derived potential and actual evaporation are avail-able online (http://www.ntsg.umt.edu/project/mod16) with a resolution of 1 km and as with most standard MODIS Land products, it uses the Sinusoidal grid tiling system in which the tiles are 10 degrees by 10 degrees at the equator (USGS, 2012) We created 5
the mosaic for each month obtaining one monthly map for the entire continent, and
we upscaled them to a resolution of 0.5 degrees (∼50 km) using the cubic convolution
resampling as suggested by Keys (1981) and Liu et al. (2007).
2.1.8 GLEAM
GLEAM (Global Land surface Evaporation: the Amsterdam Methodology) is a recent 10
global evaporation product with a 0.25 degree spatial resolution developed in the VU University of Amsterdam (Miralles et al., 2011b) mainly based on satellite observa-tions. This version of the model is forced with PERSIANN (Precipitation Estimation from Remotely Sensed Information using Artificial Neural Networks) precipitation data, soil moisture and vegetation optical depth from the NASA-LPRM (Land Parameter Re-15
trieval Model, Owe et al., 2008), radiation fluxes from ERA-Interim, air temperature from AIRS (Atmospheric InfraRed Sounder) gap-filled with ISCCP (International
Satel-lite Cloud Climatology Project, Rossow and Schiffer, 1999), and snow water
equiva-lents from NSIDC (National Snow and Ice Data Center, Armstrong et al., 2007). The GLEAM methodology uses the Priestley and Taylor (PT) evaporation model and several 20
satellite-sensor products to estimate global daily evaporation. The GLEAM algorithm was validated against one year of eddy covariance measurements from 43 stations in North America, showing a good model performance in all vegetation types and
cli-mate conditions (average correlation coefficient ofR=0.83 for daily time series, and
R=0.90 for monthly time series) (Miralles et al., 2011b).
25
HESSD
10, 8421–8465, 2013Comparison of different evaporation
estimates
P. Trambauer et al.
Title Page
Abstract Introduction
Conclusions References
Tables Figures
◭ ◮
◭ ◮
Back Close
Full Screen / Esc
Printer-friendly Version
Interactive Discussion
Discussion
P
a
per
|
D
iscussion
P
a
per
|
Discussion
P
a
per
|
Discuss
ion
P
a
per
|
2.2 Definition of regions
In this paper we aim to compare the different sets of evaporation results in defined
African regions. With this purpose, we divided the African continent in regions based on similar aridity conditions and annual precipitation cycles. First, we divided the African
continent based on climatic classes. The classification of the different climates was
5
done following the definition of the UNEP (1997) and the Global Aridity Index (Global-Aridity) data set produced by Zomer et al. (2008). This is published online in the Con-sultative Group for International Agriculture Research Consortium for Spatial Informa-tion (CGIAR-CSI) website (CGIAR CSI Consortium for Spatial InformaInforma-tion, 2010). The Global-Aridity data set is provided for non-commercial use in standard ARC/INFO Grid 10
format, at 30 arc seconds (∼1 km at equator). Zomer et al. (2008) calculated a global
map of the mean Aridity Index (AI) from the 1950–2000 period at 30′spatial resolution
(equivalent to half-degree) as:
AI=MAP/MAE (1)
where MAP is the Mean Annual Precipitation (mm yr−1) and MAE is the Mean Annual
15
Potential Evaporation (mm yr−1) (Zomer et al., 2008). In their study, Zomer et al. (2008)
computed the mean Aridity Index using the data available from the WorldClim Global Climate Data (Hijmans et al., 2005) as input parameters and the Hargreaves equation to model Potential Evaporation globally.
For the purpose of this study, we processed this AI global data set in GIS, trimmed 20
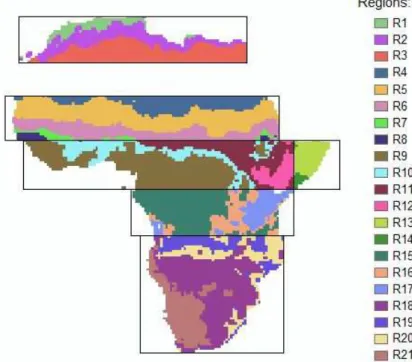
it for the African continent, classified it into six classes according to the UNEP clas-sification (1997) (see Table 2), and upscaled it to a grid resolution of 0.5 degrees in agreement with the hydrological model grid. For upscaling we used the area-majority technique. Figure 1 presents the resulting map of climate classes for the African conti-nent at the upscaled resolution.
25
Different regions of the continent have very diverse annual precipitation cycles
HESSD
10, 8421–8465, 2013Comparison of different evaporation
estimates
P. Trambauer et al.
Title Page
Abstract Introduction
Conclusions References
Tables Figures
◭ ◮
◭ ◮
Back Close
Full Screen / Esc
Printer-friendly Version
Interactive Discussion
Discussion
P
a
per
|
D
iscussion
P
a
per
|
Discussion
P
a
per
|
Discuss
ion
P
a
per
|
arid climate in the Horn of Africa and in South-Western Africa, one characterized by two rainy seasons and another by only one rainy season in a year (see McClain, 2012). This is why most studies that divide Africa in regions usually consider sub-regions that capture the mean annual cycle of precipitation of the region (single or multiple rainy seasons, precipitation interannual variability, etc.). Sylla et al. (2010) divided the conti-5
nent in eight regions, namely: West Sahel, East Sahel, Guinea Coast, North equatorial central Africa, Horn of Africa, South equatorial central Africa, Central Southern Africa, and South Africa. These regions have a uniform annual cycle of precipitation but do
not distinguish between the different climatic classes within the region. The total
an-nual precipitation in the Sahel region can be much higher for the semi-arid climate than 10
for the arid climate (both contained in the Sahel region).
This study differentiates in regions characterized by both the regional location (e.g.
Horn of Africa or Southern Africa) and the climatic class within the region. We merged some of the regions defined by Sylla et al. (2010) which had very similar mean annual cycles of precipitation (e.g. East Sahel with West Sahel, Central Southern Africa with 15
South Africa), to reduce the number of sub-regions from eight to five. To these we added the Mediterranean Region. Six location-regions were therefore defined and are presented in Fig. 2. Finally each location-region was divided in their climatic class and the resulting regions are shown in Fig. 3. The Sahara desert region was not considered in this study due to the negligible evaporation rates year round by virtue of hyper-arid 20
conditions that result in very low water content in the soil.
2.3 Comparison of evaporation products
The common period January 2000 to December 2010 was selected to compare the
evaporation products for this study. We first evaluate the difference between the
crop-specific potential evaporation products that are used in this study for the derivation of 25
the actual evaporation products (if applicable). The crop-specific potential evaporation,
PETc(mm day−1) is computed within the PCR-GLOBWB model from: PET
c=kc×PETr
where PETr (mm day−1) is the reference potential evaporation andk
c is a crop factor
HESSD
10, 8421–8465, 2013Comparison of different evaporation
estimates
P. Trambauer et al.
Title Page
Abstract Introduction
Conclusions References
Tables Figures
◭ ◮
◭ ◮
Back Close
Full Screen / Esc
Printer-friendly Version
Interactive Discussion
Discussion
P
a
per
|
D
iscussion
P
a
per
|
Discussion
P
a
per
|
Discuss
ion
P
a
per
|
(dimensionless) (van Beek et al., 2011). The comparison between the actual evapo-ration products is then carried out at a monthly temporal scale as well as within the defined regions in the continent.
Continental maps of long-term average annual potential evaporation were computed for each product. To compare two of the evaporation products on a gridded basis, and 5
considering the absence of ground data to compare to, we defined the relative mean
difference (RMD (%)) of the two evaporation products as:
RMD=(E1−E2)
¯
E ×100% (2)
whereE1 and E2is the annual evaporation (mm yr−1) data set of 1 or 2, respectively,
and ¯E is the mean evaporation (mm yr−1) of productsE
1andE2. 10
RMD indicates which product is consistently higher than the other, and the relative
magnitude of the difference between them (compared with the average value). This
indicator seems to be a fair way of estimating the relative difference as none of the
available products represents ground truth. Indicators showing absolute differences
are not useful as the same absolute difference can be relatively large for areas with
15
low actual evaporation values (arid areas), and relatively low for areas with high actual evaporation values (humid areas).
We also computed continental maps of long-term average actual evaporation for each product to allow for a visual perception of the spatial variability of the continental evaporation for each product, and between products. Moreover, to make the analysis 20
quantitative, we created an Evapotranspiration Multiproduct (EM) as the median of the considered products and we computed the Relative Mean Bias (RMB (%)) between each product and the EM. In this case we considered the EM as the “observations”, and the RMB was defined similarly to the RMD as follows:
RMB=(Ei−EM)
EM ×100% (3)
HESSD
10, 8421–8465, 2013Comparison of different evaporation
estimates
P. Trambauer et al.
Title Page
Abstract Introduction
Conclusions References
Tables Figures
◭ ◮
◭ ◮
Back Close
Full Screen / Esc
Printer-friendly Version
Interactive Discussion
Discussion
P
a
per
|
D
iscussion
P
a
per
|
Discussion
P
a
per
|
Discuss
ion
P
a
per
|
whereEi is the annual actual evaporation (mm yr−1) data set i and EM is the annual
actual evapotranspiration multiproduct (mm yr−1).
Subsequently, for each region the annual totals of each evaporation product were
computed and the seasonality of the different products was studied and compared
with the EM. The mean annual anomalies of each product with respect to the EM 5
are presented for each region, and the inter-annual variation of mean monthly actual evaporation was plotted for each product within each region and compared through visual inspection. The statistics of each evaporation product were then plotted for each region by means of Taylor diagrams of monthly evaporation and a box-plot diagram of seasonal evaporation. The box-plots are displayed for the wet and the dry seasons. 10
3 Results
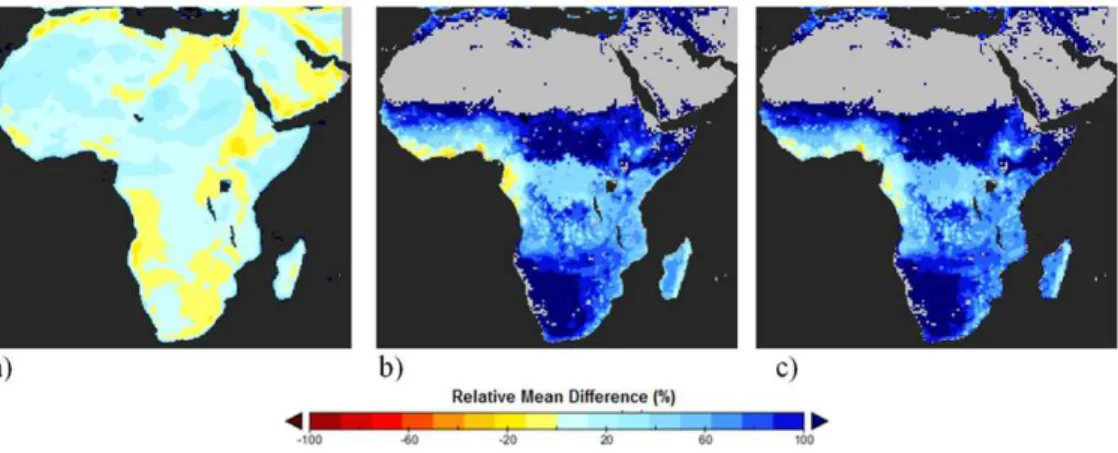
3.1 Comparison of potential evaporation products
Figure 4 presents the mean annual crop-specific potential evaporation for the pe-riod 2000–2010 based on (a) the Penman-Monteith method, and (b) the Hargreaves method, both derived from the ERA-Interim reanalysis data. Figure 4c presents the po-15
tential evaporation from the MOD16 product, which uses the Penman-Monteith method
but is derived from NASA’s Global Modelling and Assimilation Office (GMAO)
meteoro-logical data and MODIS maps. The areas in grey in the MOD16 potential evaporation correspond to missing evaporation data in the MOD16 product. These are mainly in the hyper-arid and arid areas with sparsely vegetated or with barren soils. The other 20
products included in this study do not compute or provide the potential evaporation. As can be seen in Fig. 4a and b, the potential evaporation derived from the Penman-Monteith equation and Hargreaves equation result in very similar values throughout the continent. The potential evaporation from MOD16, on the other hand, results in much higher values than the ones derived from the other two methods, especially for arid and 25
semi-arid areas. The differences are such (a factor of 2 or up to 3) that the map needs to
HESSD
10, 8421–8465, 2013Comparison of different evaporation
estimates
P. Trambauer et al.
Title Page
Abstract Introduction
Conclusions References
Tables Figures
◭ ◮
◭ ◮
Back Close
Full Screen / Esc
Printer-friendly Version
Interactive Discussion
Discussion
P
a
per
|
D
iscussion
P
a
per
|
Discussion
P
a
per
|
Discuss
ion
P
a
per
|
be presented with a different scale. The high disparities between the different potential
evaporation products seem to be quite common, as also reported in Sperna Weiland et al. (2012), Weiß and Menzel (2008) and Kingston et al. (2009). Figure 5 presents
the Relative Mean Difference (RMD) between each pair of products, and shows that
the difference between the MOD16 potential evaporation product with the other two
5
products is much smaller in humid areas than in arid and semi-arid areas. Penman-Monteith and Hargreaves products present RMD smaller than 20 % throughout the continent.
3.2 Comparison of actual evaporation products
3.2.1 Mean annual evaporation 10
From the maps of mean annual evaporation for each product (not shown) it appears
that the similarity between the different actual evaporation products is much higher than
it is between the potential evaporation products. This suggests that the high variability introduced by the potential evaporation products is decreased in the derivation of ac-tual evaporation. Figure 6 shows the maps of RMB between the mean annual acac-tual 15
evaporation of each product and the EM for the period 2000–2010. The RMB results in the highest values for the hyper-arid areas in the Sahara desert, region that was left out of this analysis due to its negligible actual evaporation values. It can also be ob-served that mean annual evaporation maps of the PCR-GLOBWB and the PCR_Irrig products are almost identical (with the exception of some few regions). For this reason, 20
PCR_Irrig product was not considered in the EM product to avoid a double weight.
ERAI is generally considerable above the EM, and for the remaining products the off
-set with the EM depends on the region. Over some water bodies higher evaporation values are noticeable in the products resulting from the PCR-GLOBWB model when compared to the other products, as open water evaporation is considered in the total 25
HESSD
10, 8421–8465, 2013Comparison of different evaporation
estimates
P. Trambauer et al.
Title Page
Abstract Introduction
Conclusions References
Tables Figures
◭ ◮
◭ ◮
Back Close
Full Screen / Esc
Printer-friendly Version
Interactive Discussion
Discussion
P
a
per
|
D
iscussion
P
a
per
|
Discussion
P
a
per
|
Discuss
ion
P
a
per
|
The annual anomalies of evaporation for each product with respect to the EM are presented in Fig. 7 for each region. The figure shows that ERAI evaporation product has the highest annual evaporation in the continent for almost every region with the ex-ception of the hyper-arid and arid areas of the Mediterranean (R2 and R3) and Sahel (R4 and R5) regions, which border the Sahara desert. Regarding the other evapora-5
tion products, in most cases they deviate from the EM for less than 100 mm yr−1, with
some few exceptions for MOD16, PCR_TRMM and GLEAM. The PCR-GLOBWB
de-rived products forced with ERAI+GPCP precipitation are in almost every case close to
the EM with the exception of humid Sahel (R8). PCR_TRMM product (PCR-GLOBWB model forced with TRMM precipitation data) is mostly lower than the EM (with the ex-10
ception of the regions bordering the Sahara desert), and closer to GLEAM, both forced with satellite rainfall products.
3.2.2 Monthly and seasonal evaporation
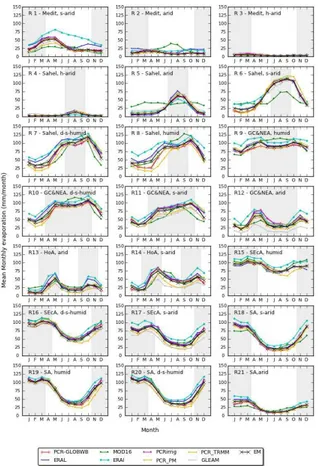
Figure 8 shows how the different evaporation products follow the inter-annual
variabil-ity. For each region the mean monthly actual evaporation for every product and the EM 15
is plotted. Seasonality is highlighted in the figure. We defined the seasons in the con-tinent as dry and wet, and the wet seasons for each region are indicated with a grey shadow in Fig. 8. The statistics of the seasonal evaporation during the wet and dry sea-sons are presented graphically in Fig. 9 by means of a box-plot diagram, showing the variability of the seasonal evaporation for each product within each region. Additionally, 20
the statistics of monthly evaporation are presented in Taylor diagrams for each region (see Fig. 10), which summarize the ratio of the standard deviation of each product and
the EM, their root-mean-square difference (RMSD, showed in grey curves in Fig. 10),
and the temporal correlation between each product and EM (based on the monthly values 2000–2010). The EM is considered here as the “reference” field. In the Taylor 25
diagrams, products that are closer to the reference field have a “higher performance” than those which are farther, which in this study is interpreted as higher consistency between the products.
HESSD
10, 8421–8465, 2013Comparison of different evaporation
estimates
P. Trambauer et al.
Title Page
Abstract Introduction
Conclusions References
Tables Figures
◭ ◮
◭ ◮
Back Close
Full Screen / Esc
Printer-friendly Version
Interactive Discussion
Discussion
P
a
per
|
D
iscussion
P
a
per
|
Discussion
P
a
per
|
Discuss
ion
P
a
per
|
Large scale analysis
In general terms, introducing the irrigation process in such a large scale-analysis does not result in visible changes. This can be observed in Figs. 7, 8, 9 and 10, where only in the Mediterranean region (R1, R2 and R3) and in the semi-arid Horn of Africa (R14) a slight deviation between the evaporation products with and without irrigation 5
can be observed. In the regions where the larger irrigation areas in the continent are lo-cated (e.g. Nile Delta), the evaporation estimate when irrigation is considered is slightly higher than when irrigation is not considered. Introducing irrigation therefore does not significantly bring the evaporation closer to the ERA-Interim product at this scale, as the higher evaporations in the comparatively small irrigated areas become insignifi-10
cant when merging these values over larger areas without irrigation. In Figs. 8 and 10 PCR_Irrig product is in general overlapping with the PCR-GLOBWB product.
Another feature that is clearly visible from Figs. 7, 8 and 9 is that for almost every region and season ERAI product consistently has the highest evaporation. ERAL
evap-oration is in almost every case lower than that of ERAI. ERAI and ERAL differ mainly
15
in three aspects: (i) land surface model: TESSEL in ERAI and HTESSEL in ERAL; (ii) coupling to the atmosphere: ERAI coupled and ERAL land surface only simulations (no feedback to the atmosphere forced with corrected precipitation); and (iii) data assimila-tion: none in ERAL while ERAI soil moisture assimilation scheme corrects soil moisture in the first three layers based on the 6 h atmospheric analysis increments of specific 20
humidity and temperature at the lowest model level (Douville et al., 2000). While the
first two points are difficult to evaluate, the impact of soil moisture data assimilation in
ERAI can be evaluated by calculating the assimilation increments: i.e. the amount of soil moisture added (or removed) by the data assimilation system. Figure 11 shows the mean annual soil moisture increments in ERAI. The increments are positive in most of 25
HESSD
10, 8421–8465, 2013Comparison of different evaporation
estimates
P. Trambauer et al.
Title Page
Abstract Introduction
Conclusions References
Tables Figures
◭ ◮
◭ ◮
Back Close
Full Screen / Esc
Printer-friendly Version
Interactive Discussion
Discussion
P
a
per
|
D
iscussion
P
a
per
|
Discussion
P
a
per
|
Discuss
ion
P
a
per
|
source of the differences between ERAI and ERAL, but qualitatively, ERAL is closer to
the remaining data sets.
Regarding the impact that input meteorological data has on the resulting evaporation we should look at both input precipitation and input potential evaporation. With respect to the input precipitation, there seems to be a general behaviour showing that the 5
evaporation resulting from the model forced with TRMM precipitation is consistently
lower than the evaporation that results when the model is forced with ERAI+GPCP
(see Figs. 7, 8 and 9). For almost every region, TRMM forced model results in lower evaporations than the EM. Regarding the potential evaporation input, it can be seen that the evaporation generated with Penman-Monteith potential evaporation is in every 10
case very similar to the one forced with Hargreaves.
The MOD16 evaporation show poor consistency with the other products in arid areas (Kim et al., 2012, observed poor performance of this product for arid areas); this can be seen in Figs. 8 and 10 for regions R2 to R5 and R21 where in some cases the product representation it is even out of the Taylor plot. For other regions, mainly in the 15
dry-sub humid and semi arid climatic regions, MOD16 is more consistent with the other products (see Fig. 10 for R7, R8 and R17 to R20).
Regional analysis
Mediterranean region (R1 to R3)
20
This region is characterized by higher evaporation rates in the months of March to May, after the end of the rainy season (see Fig. 8). The evaporation peak is clear in the Semi-Arid region (R1), but becomes less noticeable in the arid region (R2) as the evaporation rates become lower and almost disappear in the hyper-arid areas (R3) where evaporation rates throughout the year are negligible. In the rainy season Figs. 8 25
and 9 show a clear offset between ERAI and ERAL with respect to the other products,
where the first two present considerably higher evaporation rates. In the dry season,
while ERAL comes closer to the other products, the offset of ERAI is still evident.
HESSD
10, 8421–8465, 2013Comparison of different evaporation
estimates
P. Trambauer et al.
Title Page
Abstract Introduction
Conclusions References
Tables Figures
◭ ◮
◭ ◮
Back Close
Full Screen / Esc
Printer-friendly Version
Interactive Discussion
Discussion
P
a
per
|
D
iscussion
P
a
per
|
Discussion
P
a
per
|
Discuss
ion
P
a
per
|
This offset of ERAI in the dry periods decreases with increasing aridity, in contrast
with the MOD16 product, which shows higher evaporation rates than the remaining datasets for arid areas (R2) in the dry period. In the Mediterranean region only the dry season of the semi-arid region (R1) presents quite a high variability between the
different seasons for every product (Fig. 9). Figure 10 shows that for the semi-arid
5
Mediterranean region (R1) most products are quite similar to the EM with the exception of ERAI and MOD16 which are poorly correlated. As aridity increases, the consistency between the products deteriorate and in hyper-arid Mediterranean region (R3) all the products show very little consistency.
10
Sahel (R4 to R8)
The Sahel region is characterized by an annual evaporation cycle with one peak during the rainy season, namely from July to September (Sylla et al., 2010) (see Fig. 8). The evaporation rates become higher and the peaks become clearer with 15
increasing humidity. Figure 8 shows that only the MOD16 product in the arid region (R5) and to a less extent in the semi-arid region (R6) do not capture the annual evaporation cycle, presenting a relatively uniform evaporation throughout the year. This can also be seen in Fig. 10 where the very low values of normalized standard deviation in MOD16 indicate that the amplitude of the annual cycle is underestimated. 20
Figures 8 and 9 show that the lowest evaporation values are observed for PCR_TRMM during the dry season but it is not clear for the wet season. Regarding the highest evaporation values, ERAI (and secondly ERAL) present these during the dry season, but a clear behaviour cannot be observed for the wet season. The semi-arid (R6), dry-sub-humid (R7) and humid Sahel (R8) are the regions that present the largest 25
HESSD
10, 8421–8465, 2013Comparison of different evaporation
estimates
P. Trambauer et al.
Title Page
Abstract Introduction
Conclusions References
Tables Figures
◭ ◮
◭ ◮
Back Close
Full Screen / Esc
Printer-friendly Version
Interactive Discussion
Discussion
P
a
per
|
D
iscussion
P
a
per
|
Discussion
P
a
per
|
Discuss
ion
P
a
per
|
have a higher consistency with the exception of MOD16 for R5 and R6 that was already discussed, and ERAI and PCR_TRMM for R8. The figure shows that in the Sahel region ERAI product slightly underestimate the annual cycle amplitude when compared to the EM, and PCR-PM, and PCR_TRMM slightly overestimate of this amplitude, while all the products are correctly phased (high correlation).
5
Guinean coast and north equatorial central Africa (R9 to R12)
This region is characterized by a bimodal precipitation cycle with unpronounced
peaks and precipitation minima. This precipitation pattern results in different
evapora-10
tion cycles depending on the aridity of the region (see Fig. 8). For the humid region (R9) all products show more or less uniform evaporation over the year; however,
respective values between the products are different (see Fig. 10). In regions R10 and
R11 the majority of the products follow roughly the same pattern, with slightly notice-able peaks around May and October. MOD16 deviates from this pattern, represents 15
the amplitude fairly well in the annual cycle but remains out of phase (see Fig. 10). Figure 8 shows that the peaks of the evaporation cycle become more pronounced when aridity increases. The arid area (R12) has a clear bimodal evaporation cycle. For this region (R12) the GLEAM product presents the lowest values throughout the year. During the dry season ERAI present the highest values; while during the wet season 20
a clear behaviour cannot be observed. Figure 10 suggests that most of the products have a good consistency in R10 and R11 with the exception of MOD16, while in R12 the products show less consistency.
Horn of Africa (R13 and R14)
25
The Horn of Africa presents a bimodal evaporation cycle with defined peaks at around May and November (see Fig. 8). For this region most products show little consistency. This can be observed both in Figs. 8 and 10. In the arid Horn of Africa
HESSD
10, 8421–8465, 2013Comparison of different evaporation
estimates
P. Trambauer et al.
Title Page
Abstract Introduction
Conclusions References
Tables Figures
◭ ◮
◭ ◮
Back Close
Full Screen / Esc
Printer-friendly Version
Interactive Discussion
Discussion
P
a
per
|
D
iscussion
P
a
per
|
Discussion
P
a
per
|
Discuss
ion
P
a
per
|
(R13) ERAI and ERAL present larger amplitude of the annual cycle than the EM, and MOD16 shows lower amplitude of the annual cycle than the EM. In the semi-arid region (R14) the amplitude of the annual cycle are now consistent between most
products (normalized standard deviation close to one), but the correlation coefficients
are rather low (the time series are not correctly phased). 5
Southern equatorial central Africa (R15 to R17)
This region presents an evaporation seasonal cycle with a minimum in June through
October and a maximum in December through April (see Fig. 8). The difference
10
between the evaporation values in the wet and in the dry season increases with aridity. The consistency between all products seems to be quite better in the dry-sub-humid region (R16) than in the humid region (R15). In R15 MOD16 and ERAL seem to be fairly out of phase (low correlation values), and PCR_TRMM presents a larger amplitude of the annual cycle than the EM. Regarding the semi-arid region (R17), the 15
absolute amplitude of the annual cycle increases, and quite a good consistency is observed between all the products.
Southern Africa (R18 to R21)
20
The Southern Africa region show a pronounced seasonal cycle with a minimum in June through October and a maximum in December through April (see Fig. 8). In the semi-arid (R18), humid (R19) and dry-sub-humid (R20) regions all the products present a good consistency (see Fig. 10). In the semi-arid (R18) and arid (R21) regions MOD16 presents a lower annual cycle amplitude that the EM, which is represented in 25
HESSD
10, 8421–8465, 2013Comparison of different evaporation
estimates
P. Trambauer et al.
Title Page
Abstract Introduction
Conclusions References
Tables Figures
◭ ◮
◭ ◮
Back Close
Full Screen / Esc
Printer-friendly Version
Interactive Discussion
Discussion
P
a
per
|
D
iscussion
P
a
per
|
Discussion
P
a
per
|
Discuss
ion
P
a
per
|
4 Discussion and conclusions
The validation of a continental evaporation product for Africa is still limited due to the inexistence of a continental-scale evaporation product representing ground measured data. Some past studies introduced newly developed (global or continental) evapora-tion products which were compared with one or two other existing products with valida-5
tion purposes, or they were validated with measured data in limited regions. However, they all face the same problem concerning the lack of real ground data to validate against. This study attempts to bridge a gap in this issue of evaporation estimation for the African continent. We are not trying to introduce a new product, but rather trying to
understand to what extent different existing products match or differ in different regions
10
of Africa. We also attempt to explain the causes of these differences, which can be
various, such as the type of model used to estimate evaporation, the model structure and the input data.
4.1 Effect of input meteorological data in the estimation of actual evaporation
4.1.1 Precipitation data 15
The intensity of the forcing precipitation has a large influence in the simulated actual evaporation. ERAI precipitation corrected with GPCP in general compares well with observed data at a monthly basis and has good ability to estimate the peak locations, but it is known to overestimate the frequency of wet days and underestimate the daily highest intensities in some regions (e.g. Iberian Peninsula, Belo-Pereira et al., 2011). 20
Thiemig et al. (2012) obtained similar results for a number of African river basins for the
ERAI precipitation data without correction. The effect of the rainfall intensity on actual
evaporation is not linear. On the one hand, at smaller scales for Hortonian overland flow, rainfall event with lower intensity lasting for a longer period results in higher in-filtration. This contributes to higher base flows and keeps the water out of reach of 25
evaporation, resulting in lower evaporation. On the other hand, higher intensities lead
HESSD
10, 8421–8465, 2013Comparison of different evaporation
estimates
P. Trambauer et al.
Title Page
Abstract Introduction
Conclusions References
Tables Figures
◭ ◮
◭ ◮
Back Close
Full Screen / Esc
Printer-friendly Version
Interactive Discussion
Discussion
P
a
per
|
D
iscussion
P
a
per
|
Discussion
P
a
per
|
Discuss
ion
P
a
per
|
to higher surface runoff, which also keeps the water out of reach of evaporation and
results in lower evaporation. For the scale considered in this study, it is clear that rainfall events with higher intensities result in lower evaporation values (see Figs. 7 and 8) as
a result of higher surface runoff, given that PCR_TRMM evaporation is generally lower
than PCR-GLOBWB evaporation. 5
The difference between the evaporation products PCR_TRMM and PCR-GLOBWB
is not negligible and it varies from region to region, and therefore is important to force the hydrological model with the most suitable precipitation product for that particular region. Thiemig et al. (2012) found TRMM together with RFE to be the best satellite products available for the African continent. However, they noted that both TRMM and 10
ERAI underestimate the amount of rainfall during the heavy rainfall events, and they explained that for the satellite products this was mainly the result of the small extent of the heavy precipitation cells, which are generally lower than the detection limit of the satellite sensors. While ERAI highly overestimates the number of rainy days, TRMM also has some overestimation of the rainy days for tropical wet and dry zones but lower 15
than that of ERAI (Thiemig et al., 2012). Moreover, Wang et al. (2009) highlights some known “anomalies” in TRMM such as underestimation in “warm-rain” regimes. In these regimes rain is derived from non icephase processes in clouds (see Lau and Wu, 2003, for detailed explanation).
4.1.2 Potential evaporation data 20
The potential evaporation used as a forcing appears to have some influence in the es-timation of actual evaporation in some of the regions. The PCR-GLOBWB hydrological model was forced with two sets of reference potential evaporation products to assess the weight that this input has on the results. The resulting evaporation product PCR_PM (model forced with Penman-Monteith potential evaporation) is in general slightly higher 25
HESSD
10, 8421–8465, 2013Comparison of different evaporation
estimates
P. Trambauer et al.
Title Page
Abstract Introduction
Conclusions References
Tables Figures
◭ ◮
◭ ◮
Back Close
Full Screen / Esc
Printer-friendly Version
Interactive Discussion
Discussion
P
a
per
|
D
iscussion
P
a
per
|
Discussion
P
a
per
|
Discuss
ion
P
a
per
|
be due to the fact that the original difference between the two potential evaporation
products was quite small.
4.2 Effect of the model structure in the estimation of actual evaporation
The comparison between the PCR-GLOBWB and the PCR_Irrig evaporation products
can help us identify the effect of introducing an irrigation scheme in a hydrological
5
model on simulated actual evaporation. The only difference between these two
mod-els is the introduction of the irrigation scheme in PCR_Irrig which was not included in PCR-GLOBWB. A recent study by van Beek et al. (2011) attributed partly the dif-ference between PCR-GLOBWB simulated actual evaporation and ERA-40 reanalysis evaporation to the under representation of the irrigation areas in PCR-GLOBWB. 10
Contrary to the expectations, it appears that introducing an irrigation scheme in the
hydrological model has negligible effect in the actual evaporation results for the
resolu-tion of 0.5◦
×0.5◦ used in this study. Only in some regions with very large irrigation
ar-eas, marginally higher evaporation was observed. However, we observed considerable
differences in the evaporation results when the same irrigation scheme was introduced
15
in a finer resolution model (0.05◦
×05◦) for the Limpopo river basin. Therefore, it seems
to be a resolution issue due to the small irrigation areas in Africa (with the exception of the Nile Delta) and the averaging in regions containing large non-irrigated areas.
4.3 Final remarks
This paper compares different evaporation products for Africa and presents an
Ac-20
tual Evaporation Multiproduct at a 0.5◦ resolution. This EM integrates satellite based
products, evaporation results from land-surface models and from hydrological
mod-els forced with different precipitation and potential evaporation data sets. This product
may serve as a reference data set (benchmark) and provide a range of variance in the expected actual evaporation values, which may be useful for water management 25
applications in Africa. In general ERAI and MOD16 do not show good agreement with
HESSD
10, 8421–8465, 2013Comparison of different evaporation
estimates
P. Trambauer et al.
Title Page
Abstract Introduction
Conclusions References
Tables Figures
◭ ◮
◭ ◮
Back Close
Full Screen / Esc
Printer-friendly Version
Interactive Discussion
Discussion
P
a
per
|
D
iscussion
P
a
per
|
Discussion
P
a
per
|
Discuss
ion
P
a
per
|
other products in most part of Africa, while the rest of the products are more consistent. ERAL is generally quite close to the EM, and the higher values of evaporation in ERAI when compared with ERAL are partly explained by the soil moisture data assimilation in ERAI. It also appears that in some regions like in Southern Africa the agreement be-tween the products is very good, which means that use of any of these products may 5
be equally good. In other regions, such as in humid Sahel or the Mediterranean the
choice of a particular product needs to be further studied as there is a larger difference
between the products. A potential action to improve this comparison study and the EM is to validate the products in at least some African regions with ground data.
Acknowledgements. This study was carried out as part of the DEWFORA Project (“Improved
10
Drought Early Warning and Forecasting to strengthen preparedness and adaptation to droughts in Africa”) which is funded by the Seventh Framework Programme for Research and Techno-logical Development (FP7) of the European Union (Grant agreement no: 265454). Special ac-knowledgment goes to V. Thiemig from JRC for providing pre-processed TRMM data for the African continent and to D. Miralles from the University of Bristol and VU Amsterdam for provid-15
ing the global GLEAM dataset. The authors would like to thank G. Balsamo for the suggestions that helped to improve the manuscript.
References
Alton, P., Fisher, R., Los, S., and Williams, M.: Simulations of global evapotranspiration using semiempirical and mechanistic schemes of plant hydrology, Global Biogeochem. Cy., 23, 20
GB4023, doi:10.1029/2009GB003540, 2009.
Armstrong, R. L., Brodzik, M. J., Knowles, K., and Savoie, M.: Global monthly EASE-Grid snow water equivalent climatology, Boulder, CO: National Snow and Ice Data Center, Digital media, 2007.
Balsamo, G., Beljaars, A., Scipal, K., Viterbo, P., van den Hurk, B., Hirschi, M., and Betts, A. 25