ISSN: 2322-2093
Technical Note
Estimating Suspended Sediment by Artificial Neural Network (ANN),
Decision Trees (DT) and Sediment Rating Curve (SRC) Models
(Case study: Lorestan Province, Iran)
Barzegari, F.1*,Yosefi, M.2 and Talebi, A.3
1
Instructor of Agricultural Department, Payam Noor University, Iran.
2
M.Sc., Faculty of Natural Resources, Yazd University, Iran.
3
Associate Professor, Faculty of Natural Resources, Yazd University, Iran.
Received: 16 Apr. 2014 Revised: 08 Aug. 2015 Accepted: 12 Sep. 2015
Abstract: The aim of this study was to estimate suspended sediment by the ANN model, DT with CART algorithm and different types of SRC, in ten stations from the Lorestan Province of Iran. The results showed that the accuracy of ANN with Levenberg-Marquardt back propagation algorithm is more than the two other models, especially in high discharges. Comparison of different intervals in models showed that running models with monthly data, resulted in smaller error and better estimated results. Moreover, results showed that using Minimum Variance Unbiased Estimator
(
MVUE) bias correction factor modified the SRC results, especially in monthly time steps in almost all stations. Hence, it can be said that if because of advantages such as simplicity, SRC models are preferred, it is better that MSRC (modified sediment rating curve) is used in monthly period.Keywords: Artificial Neural Network, CART algorithm, Decision Tree, Levenberg-Marquardtalgorithm,Sediment Rating Curve.
INTRODUCTION
Quantification of Suspended Sediment Yield (SSY) in rivers is crucial for issues of soil erosion, water quality, reservoir sedimentation, fish habitat and other ecological impacts (Morris and Fan, 1998; Melesse et al., 2011; Isik, 2013). Unfortunately, sediment-observed data are lacking for rivers in many parts of the world, especially in developing and remote regions (Walling and Fang, 2003). So to deal with this problem, many empirically- and physically-based models have been developed to model the suspended sediment flux of a catchment. Empirical
Corresponding author Email: [email protected]
field. Several authors (Abrahart and White, 2001; Nagy et al., 2002; Jain, 2001; Kisi, 2005; Nourani et al., 2012; Rajaee et al., 2009; Rezapour et al., 2010) have conducted studies in this field, some of them are mentioned below.
Cigizoglu (2002) made a comparison between ANNs and SRC for suspended sediment estimation and found that the estimations obtained by ANNs were significantly superior to the corresponding classical SRC ones. Kumar et al. (2011) compared ANN with back propagation and Levenberg-Maquardt algorithms, radial basis function (RBF), Fuzzy Logic, and decision tree algorithms such as M5 and REP Tree for predicting the suspended sediment concentration at Kasol, located in the Sutlej basin in northern India. It was found that the M5 model performed well compared to the other soft computing techniques. Heng and Suetsugi (2013a) regionalized the parameters of an artificial neural network model that was used to predict monthly sediment yield in the Lower Mekong Basin. Heng and Suetsugi (2013b) evaluated the relative performance of SRC and ANN at two phases consecutively: (1) site-specific modeling and (2) ungauged catchment modeling. SRC was found to be inferior at Phase1but superior at Phase 2. At both phases SRC produced satisfactory results for all modeled catchments and exhibited the greatest response repeatedly in estimating low values. Lastly, they concluded that SRC is the most practical and promising data-driven model in predicting suspended sediment yield time series in ungauged catchments. Two case studies were examined by Wolfs and Willems (2014) to show hysteresis using various approaches, namely (1) single rating curves, (2) rating curves with dynamic correction, (3) artificial neural networks (ANN) and (4) M5 model trees. All methods outperformed the traditional rating curve. The approach that used a dynamically corrected rating curve delivered accurate results and
allowed for physical interpretation. The ANNs mimicked the calibration data precisely but suffered from over fitting when smallamountofdatawasappliedfor training .The rarely used M5 model tree’s architecture was easier to interpret than that of neural networks and delivered more accurate results. The purpose of this study was to estimate the suspended sediment in Lorestan Province of Iran, using computer based methods (ANN and DT) and modified sediment rating curve.
MATERIALS AND METHODS
Study Area
Lorestan province is located in the western part of Iran, between longitudes 46˚51' and 50º30'E and latitude 32˚37' and 34˚22' N. Discharge data and corresponding sediment from ten hydrometric stations located in the area were used for this study.
Data Collection
In this study, water discharges and corresponding sediment data from ten stations were applied daily, monthly and seasonally between 1996 to 2006. Statistical data were divided in two parts, 70% of data was employed as training data and 30% was used for testing.
Artificial Neural Network Model and Decision Tree
In recent decades, artificial neural network and decision tree are computer-based methods which have been widely used in hydrological studies. The Levenberg Marquardt (LM) algorithm of ANN and CART algorithm of DT were used in this study. Sediment data were categorized into monthly, seasonal and categorized hydrological groups (same as what is used in sediment rating curves), in order to be used in DT and ANN.
Sediment Rating Curve
concentrations (SSC) or sediment load (Qs)
and stream discharge (Qw). It is generally
expressed as a power function (Eq. (1)), (Walling, 1974; Fenn et al., 1985; Syvitski et al., 2000).
b
Qs aQw (1)
Values of a and b for a particular stream are determined from data via a linear regression between (log S) and (log Q).
Some correction coefficients such as FAO, QMLE, Smearing and MVUE are suggested to improve the sediment rating curve. In this study, data were subdivided in to monthly, seasonal and categorized hydrological groups and then bias correction factors were used to minimize error on the SRC.
Selecting the Best Sediment Rating Curve
To compare different combinations of SRCs and correction factors, root mean square error (RMSE) and the Nash and Sutcliffe (NS) indicators were used.
RESULTS AND DISCUSSION
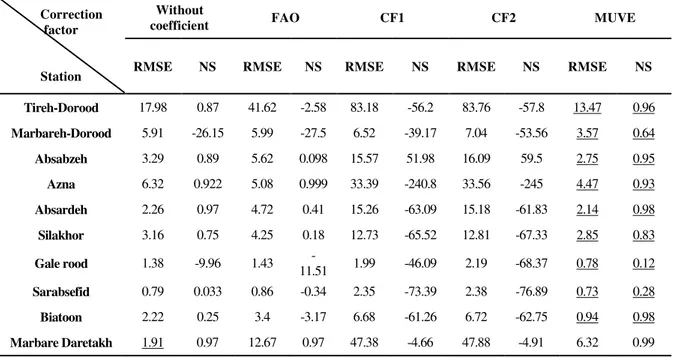
The results of using different combinations of SRC and bias correction factors showed that monthly SRC is the most appropriate SRC model. Table1 illustrates the efficiency of different bias correction factors applied to improve monthly SRC from RMSE and NS view points. Based on the results of this table, the MUVE bias correction factors had the least RMSE and NS. It means that MVUE is the most appropriate bias correction factor to improve monthly SRC .
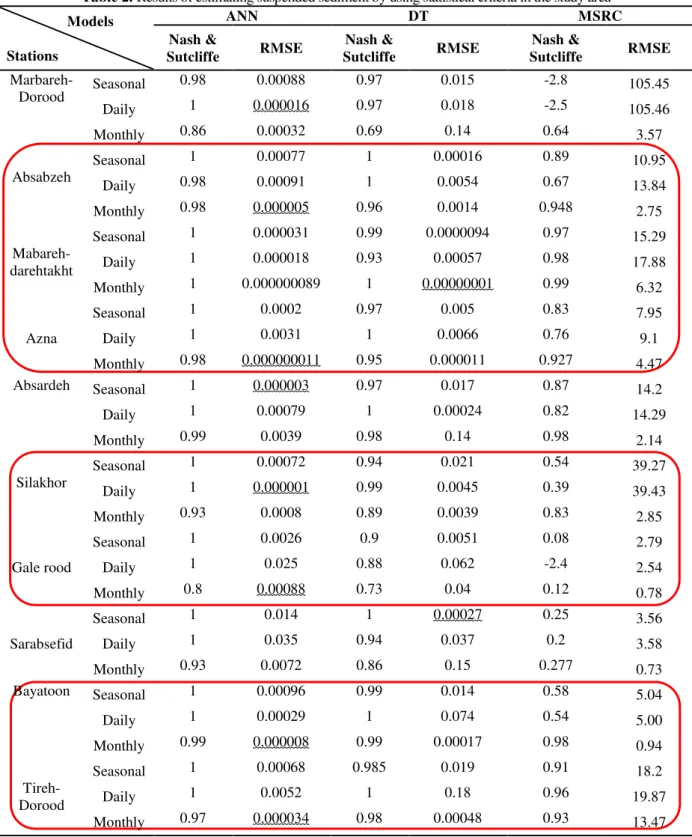
Through the use of training data, different models have been built namely DT (CART algorithm), ANN (feed forward back propagation algorithm) and the MSRC model. The used input data include the related flow discharge with sediment discharge in daily, monthly and seasonal time steps. The suspended sediment has also been considered as the output data. For statistical comparison of predicted and observed values, (RMSE) as well as (NS) criteria were used. Table 2 shows the values of statistical criteria for the different models.
Table 1. Results of using different bias correction factors on monthly SRC (the most appropriate sediment rating curve)
Correction factor
Station
Without
coefficient FAO CF1 CF2 MUVE
RMSE NS RMSE NS RMSE NS RMSE NS RMSE NS
Tireh-Dorood 17.98 0.87 41.62 -2.58 83.18 -56.2 83.76 -57.8 13.47 0.96
Marbareh-Dorood 5.91 -26.15 5.99 -27.5 6.52 -39.17 7.04 -53.56 3.57 0.64
Absabzeh 3.29 0.89 5.62 0.098 15.57 51.98 16.09 59.5 2.75 0.95
Azna 6.32 0.922 5.08 0.999 33.39 -240.8 33.56 -245 4.47 0.93
Absardeh 2.26 0.97 4.72 0.41 15.26 -63.09 15.18 -61.83 2.14 0.98
Silakhor 3.16 0.75 4.25 0.18 12.73 -65.52 12.81 -67.33 2.85 0.83
Gale rood 1.38 -9.96 1.43
-11.51 1.99 -46.09 2.19 -68.37 0.78 0.12
Sarabsefid 0.79 0.033 0.86 -0.34 2.35 -73.39 2.38 -76.89 0.73 0.28
Biatoon 2.22 0.25 3.4 -3.17 6.68 -61.26 6.72 -62.75 0.94 0.98
Table 2. Results of estimating suspended sediment by using statistical criteria in the study area
Models
Stations
ANN DT MSRC
Nash &
Sutcliffe RMSE
Nash &
Sutcliffe RMSE
Nash &
Sutcliffe RMSE
Marbareh-Dorood Seasonal
0.98 0.00088 0.97 0.015 -2.8 105.45
Daily 1 0.000016 0.97 0.018 -2.5 105.46 Monthly 0.86 0.00032 0.69 0.14 0.64 3.57
Absabzeh
Seasonal 1 0.00077 1 0.00016 0.89 10.95 Daily 0.98 0.00091 1 0.0054 0.67 13.84 Monthly 0.98 0.000005 0.96 0.0014 0.948 2.75
Mabareh-darehtakht
Seasonal 1 0.000031 0.99 0.0000094 0.97 15.29 Daily 1 0.000018 0.93 0.00057 0.98 17.88 Monthly 1 0.000000089 1 0.00000001 0.99 6.32
Azna
Seasonal 1 0.0002 0.97 0.005 0.83 7.95 Daily 1 0.0031 1 0.0066 0.76 9.1 Monthly 0.98 0.000000011 0.95 0.000011 0.927 4.47 Absardeh Seasonal 1 0.000003 0.97 0.017 0.87 14.2
Daily 1 0.00079 1 0.00024 0.82 14.29 Monthly 0.99 0.0039 0.98 0.14 0.98 2.14
Silakhor
Seasonal 1 0.00072 0.94 0.021 0.54 39.27 Daily 1 0.000001 0.99 0.0045 0.39 39.43 Monthly 0.93 0.0008 0.89 0.0039 0.83 2.85
Gale rood
Seasonal 1 0.0026 0.9 0.0051 0.08 2.79 Daily 1 0.025 0.88 0.062 -2.4 2.54 Monthly 0.8 0.00088 0.73 0.04 0.12 0.78
Sarabsefid
Seasonal 1 0.014 1 0.00027 0.25 3.56 Daily 1 0.035 0.94 0.037 0.2 3.58 Monthly 0.93 0.0072 0.86 0.15 0.277 0.73 Bayatoon Seasonal 1 0.00096 0.99 0.014 0.58 5.04
Daily 1 0.00029 1 0.074 0.54 5.00 Monthly 0.99 0.000008 0.99 0.00017 0.98 0.94
Tireh-Dorood
Seasonal 1 0.00068 0.985 0.019 0.91 18.2 Daily 1 0.0052 1 0.18 0.96 19.87 Monthly 0.97 0.000034 0.98 0.00048 0.93 13.47
The validation accuracy of each model is illustrated in Table 2. From this table, it is clear that in 78% of cases, the ANN model performed better than the other models in respect to the RMSE and NS criteria. For instance, the relative RMSE for the ANN model ranged from 1.1*10-8 to 0.035 with an
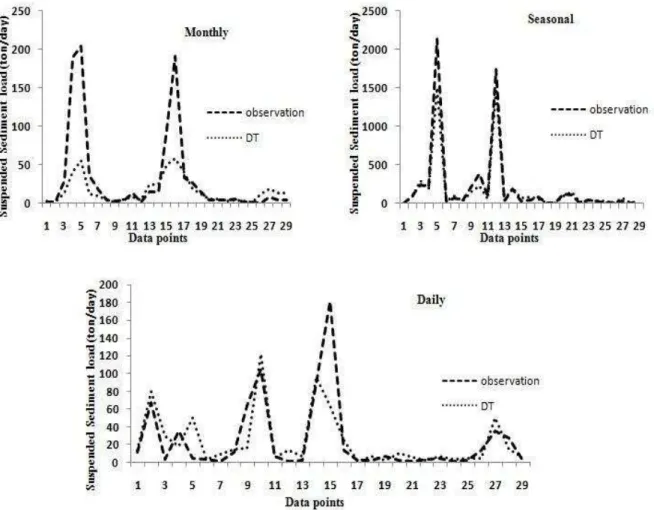
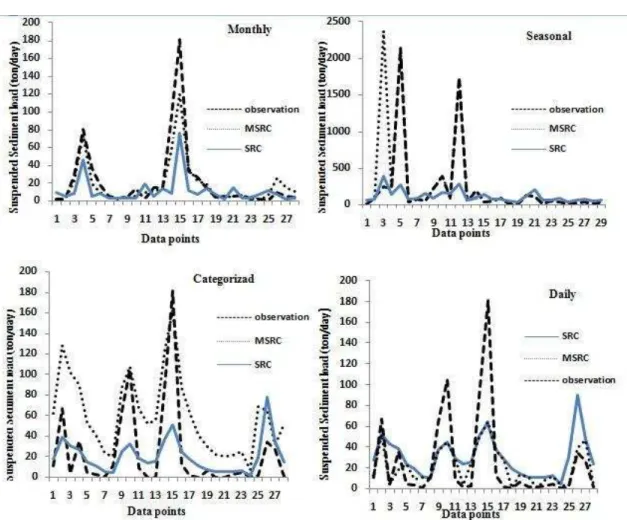
As shown in the table, the DT model performed better than the MSRC model and in some cases, it is better than the ANN model from the RMSE and NS view points. Kumar et al. (2011) showed that DT produced better performance than ANN. Moreover, in 67% of cases (marked as the red box), running models use monthly data, which result in smaller error and better estimated results. Figures 1 to 3 show the same results. Based on Table 2, model validations measured by RMSE for monthly time steps ranged between 1.1*10-8 and 0.0072 (average = 0.00076) for ANN, in comparison with 1.1*10-8 and 0.15 (average = 0.04) for DT and 0.73 and 6.32 (average =
2.57) for the MSRC method. Thus, it can be concluded that using monthly intervals as input for the ANN model, results in improving the accuracy of suspended sediment estimation. On the other hand, it is clear that using monthly intervals has no considerable impact on increasing the accuracy in DT, while ANN and especially MSRC were significantly affected by this problem. Hence, it can be concluded that in the current situation of suspended sediment sampling in Iran, that suspended sediment sampling is not intensive, using daily data leads to inappropriate results but using monthly intervals is accountable.
Fig. 2. Comparison of ANN model with observational sediment
CONCLUSION
In this research, the accuracy of decision trees (DT) (CART algorithm), artificial neural networks (Levenberg-Marquardt back propagation algorithm) and modified sediment rating curve (MSRC) model, in predicting the suspended sediment load was investigated in ten hydrometric stations of Lorestan Province in Iran. Results show that the accuracy of ANN is more than the two other models especially in high discharges. Therefore, as in most of the problems in river engineering, high discharges are crucial, ANN models are more applicable. Comparison of different intervals in models showed that running models with use of monthly data leads to smaller error and better estimated results especially in the SRC model. Hence, it can be concluded that if SRC models are preferred for advantages such as simplicity, it is better that MSRC with monthly time steps be used.
REFERENCES
Abrahart, R.J. and White, S.M. (2001). “Modeling sediment transfer in Malawi: Comparing back propagation neural network solutions against a multiple linear regression benchmark using
small data set”, Physics and Chemistry of the Earth, Part B: Hydrology, Oceans and Atmosphere, 26 (1), 19-24.
Asselman, N.E.M. (2000). “Fitting and
interpretation of sediment rating curves”, Journal of Hydrology, 234(4), 228-248.
Cigizoglu, H.K. (2002). “Suspended sediment
estimation for rivers using Artificial Neural Networks and sediment rating curves”. Turkish Journal of Engineering and Environmental Sciences, 26(1), 27-36.
Fenn, C., Gurnell, A. and Beecroft, I. (1985). “An evaluation of the use of suspended sediment rating curves for the prediction of suspended
sediment concentration in a pro glacial stream”. Geografiska Annalar Series A: Physical Geography, 67(1-2), 71-82.
Heng ,S., and Suetsugi, T. (2013a).”Using artificial neural network to estimate sediment load in ungauged catchments of the Tonle Sap River Basin, Cambodia”, Journal of Water Resources Protection, 5(2), 111-123.
Heng , S., and Suetsugi, T. (2013b). “Investigation on applicability of data-driven models in ungauged catchments: sediment yield prediction”, Earth Resources, 1(2), 37-47. Isik, S. (2013). “Regional rating curve models of
suspended sediment transport for Turkey”, Earth Science Informatics, 6(2), 87-98.
Jain, S.K. (2001). “Development of integrated
sediment rating curves using ANNs”, Journal of Hydraulic Engineering, 127(1), 30-37.
Kisi, O. (2005). “Suspended sediment estimation using neuro-fuzzy and neural network approaches”, Hydrological Sciences Journal– des Sciences Hydrologiques, 50(4), August. Kumar, S.A., Ojha, C., Goyal, M., Singh, R. and
Swamee, P. (2011). “Modeling of suspended sediment concentration at Kasol in India using ANN, Fuzzy Logic, and Decision Tree
algorithms”, Journal of Hydrologic
Engineering, 17(3), 394–404.
Melesse, A.M., Ahmad, S., McClain, M.E., Wang,
X. and Lim, Y.H. (2011). “Suspended sediment
load prediction of river systems: An artificial
neural network approach”, Agricultural Water Management Journal, 98(5), 855-866.
Melesse, A.M., Ahmad, S., McClain, M.E., Wang,
X. and Lim, Y.H. (2011). “Suspended sediment
load prediction of river systems: An artificial
neural network approach”, Agricultural Water Management Journal, 98(5), 855-866.
Morris, G.L. and Fan, J. (1998). “Reservoir
sedimentation handbook”, Electronic Version
1.04, 1st ed., McGraw-Hill, New York, ISBN-10: 007043302X, pp. 805.
Mosaedi, A., Mohammadi Ostadkelayeh, A., Najafinejad, A. and Yaghmaiee, F. (2006).
“Optimization of the relations between flow discharge and suspended sediment discharge in selected hydrometric stations of Gorganroud River”, Iranian Journal of Natural Resources, 59(2), 332-341, (In Persian).
Nagy, H.M., Watanabe, K.and Hirano, M. (2002).
“Prediction of sediment load concentration in rivers using artificial neural network model”, Journal of Hydraulic Engineering, 128(6), 588-595.
Nourani, V., Kalantari, O. and Baghanam, A. (2012). “Two semi-distributed ANN-based models for estimation of suspended sediment load.” Journalof Hydrologic Engineering, 17(12), 1368-1380.
Rajaee, T., Mirbagheri, S.A. and Zounemat Kermani, M. (2009). “Daily suspended sediment concentration simulation using ANN and neura-fuzzy models”, Science of the Total Environment, 407, 4916-4927.
Australian Journal of Basic and Applied Sciences, 4(8), 3347-3353.
Syvitski, J.P.M., Morehead, M.D., Bahr, D.B. and Mulder, T. (2000). “Estimating fluvial sediment transport: The rating parameters”, Water Resources Research Journal, 36(9), 2747-2760.
Walling, D.E. and Fang, D. (2003). “Recent trends in the suspended sediment loads of the world’s
rivers”, Global Planetary Change, 39(1), 111-126.
Walling, D.E. (1974). “Suspended sediment and
solute yields from a small catchment prior to urbanization”, In: Gregory, K.J., Walling, D.E. (eds.), Fluvial Processes in Instrumented Watersheds, Institute of British Geographers, Special Publication, 6, 169-192.
Wang, H., Yang, Z., Wang, Y., Saito, Y. and Liu,
J.P. (2007). “Reconstruction of sediment flux
from the Changjiang (Yangtze River) to the sea since the1860s”, Hydrology Journal, 349(3), 318-332.