www.ann-geophys.net/24/2743/2006/ © European Geosciences Union 2006
Annales
Geophysicae
The presence of large sunspots near the central solar meridian at the
times of modern Japanese auroral observations
D. M. Willis1,2, R. Henwood3, and F. R. Stephenson4
1Rutherford Appleton Laboratory, Chilton, Didcot, Oxon OX11 0QX, UK
2Centre for Fusion, Space and Astrophysics, Department of Physics, University of Warwick, Coventry CV4 7AL, UK 3UK Solar System Data Centre, Rutherford Appleton Laboratory, Chilton, Didcot, Oxon OX11 0QX, UK
4Department of East Asian Studies, University of Durham, Durham DH1 3TH, UK Received: 18 July 2006 – Accepted: 31 August 2006 – Published: 20 October 2006
Abstract. The validity of a technique developed by the
au-thors to identify historical occurrences of intense geomag-netic storms, which is based on finding approximately coin-cident observations of sunspots and aurorae recorded in East Asian histories, is corroborated using more modern sunspot and auroral observations. Scientific observations of aurorae in Japan during the interval 1957–2004 are used to identify geomagnetic storms that are sufficiently intense to produce auroral displays at low geomagnetic latitudes. By exam-ining white-light images of the Sun obtained by the Royal Greenwich Observatory, the Big Bear Solar Observatory, the Debrecen Heliophysical Observatory and the Solar and He-liospheric Observatory spacecraft, it is found that a sunspot large enough to be seen with the unaided eye by an “experi-enced” observer was located reasonably close to the central solar meridian immediately before all but one of the 30 dis-tinct Japanese auroral events, which represents a 97% suc-cess rate. Even an “average” observer would probably have been able to see a sunspot with the unaided eye before 24 of these 30 events, which represents an 80% success rate. This corroboration of the validity of the technique used to identify historical occurences of intense geomagnetic storms is im-portant because early unaided-eye observations of sunspots and aurorae provide the only possible means of identifying individual historical geomagnetic storms during the greater part of the past two millennia.
Keywords. Magnetospheric physics (Auroral phenomena;
Storms and substorms) – Solar physics, astrophysics and as-tronomy (Photosphere and chromosphere)
Correspondence to: D. M. Willis
(d.m.willis@rl.ac.uk)
1 Introduction
including possible dates for both the central meridian passage of the sunspot and the occurrence of the energetic solar fea-ture, as well as the likely time delay between the solar event and the onset of the historical geomagnetic storm. Moreover, European telescopic sunspot drawings from the seventeenth century were used to assess the credibility of some of the later historical geomagnetic storms defined solely by the East Asian sunspot and auroral records.
An anonymous referee pointed out, quite constructively, that the conclusions in Willis et al. (2005) would be much more convincing if it could be shown that the technique for identifying historical geomagnetic storms was equally suc-cessful when applied to comparable modern sunspot and au-roral observations. Following this suggestion, the goal of the present paper is to show that essentially the same procedure can indeed be used successfully with modern data. In partic-ular, it is shown that a sunspot large enough to be seen with the unaided eye by an “experienced” observer was reason-ably close to the central solar meridian at the times of all but one of the 43 modern auroral observations from Japan in the interval 1957–2004. Some of these auroral displays were too faint to be seen with the unaided eye and were detected in-strumentally. This result is especially important because the modern auroral observations discussed in the present paper are from the same region of the world as the historical auro-ral observations discussed in the paper by Willis et al. (2005). In particular, the conclusions of both papers are based on au-roral observations at low geomagnetic latitudes in East Asia. Moreover, the average frequency of auroral occurrence is much lower in East Asia than in Europe. Statistical studies published several decades ago have indicated that the annual frequency of occurrence of Japanese auroral displays (visible with the unaided eye) should amount to no more than about one per decade (Vestine, 1944), which implies that Japanese auroral observations are likely to be associated with intense geomagnetic storms.
The paper by Willis et al. (2005) provides further details on the three crucial assumptions that result in the condition –8≤T≤+15 for the identification of historical geomagnetic storms. Although this discussion need not be repeated here, certain key facts regarding the ancient East Asian sunspot and auroral observations should be emphasised before dis-cussing the modern observations. An important feature of all the East Asian catalogues of early sunspot and auroral obser-vations is the fact that the date of each observation is clearly specified, although in some cases only the lunar month, the season, the year, or even just the reign period, is recorded. Moreover, most early auroral records give only a very gen-eral time of night, if any indication at all. Similarly, most early sunspot records give no indication of the time of day, although in a few cases there is a clear indication that the observation was made close to sunrise or sunset. As a result of this limited temporal resolution, the shortest time inter-val that can be realistically considered in any investigation of the ancient sunspot and auroral observations is just one
day (24 h). Therefore, it is those specific sunspot and au-roral observations, for which an exact date is known (year, month and day all recorded precisely), that are crucially im-portant in the identification of historical geomagnetic storms. In addition, the historical sunspot records rarely give any in-dication of the position of a sunspot (or sunspot group) on the solar disk. In a few cases, it is stated that the sunspot was seen for several days, which implies that it must have been observed throughout a significant part of its transit across the solar disk. Conversely, on many occasions cloud cover or other adverse viewing conditions must have restricted the observation of a sunspot to just a single day and in the vast majority of such cases the sunspot is at an unknown position. The great advantage of using modern solar observations is that the positions of sunspots (and sunspot groups) on the solar surface are essentially known at all times, as a result of routine monitoring-type observations of the Sun, which obviates the need for the assumption that sunspots can be ob-served continually within±5 days of the central solar merid-ian.
2 Modern measurements of low-latitude aurorae in Japan
The auroral observations used in this study were obtained during the interval AD 1957–2004 at a number of observ-ing stations in Japan, usobserv-ing a variety of scientific equipment (Huruhata, 1958, 1960; Hikosaka, 1958; Kakioka Magnetic Observatory, 1969; Miyaoka et al., 1990; Saito et al., 1994; Shiokawa et al., 1994, 1995, 2001, 2005). Commencing with the International Geophysical Year in 1957, systematic sci-entific auroral observations have been made in Japan. For several decades prior to 1957, occasional auroral observa-tions were made with a scientific motive but these sightings tended to be irregular or opportunistic rather than systematic, and in most cases the observers had no specially designed equipment. As we have discussed elsewhere (e.g. Willis and Stephenson, 2000; Willis et al., 2005), numerous auroral ob-servations were recorded in Chinese, Japanese and Korean histories as part of a culture and tradition extending back over a few millennia (see also Nakazawa et al., 2004). At these earlier times, the motivation was mainly astrological rather than scientific.
Shiokawa et al. (2005), some small differences are inevitable in view of the fact that the earlier observations are less de-tailed. The first column in Table 1 gives a reference num-ber for each Japanese auroral observation; the second and third columns give the date and duration (UT) of each ob-servation. The fourth and fifth columns provide the name of the observatory (or location) at which the auroral sight-ing was made and its geomagnetic (dipole) latitude. If the observation is not specific to a particular observatory, as is the case for some of the earlier observations, then the loca-tion or region of the observaloca-tion(s) is given in parentheses (e.g. Hokkaido), together with the lowest geomagnetic lati-tude at which the aurora was observed (also in parentheses), if known. The sixth, seventh and eighth columns record the emission intensities in Rayleighs (R) at three wavelengths, namely, 630.0 nm, 557.7 nm and 427.8 nm, whenever these intensities are known. The ninth column provides the mini-mum hourly value of theDst index during the course of the
associated geomagnetic storm. The tenth, and final, column of Table 1 is discussed in the next section.
The footnotes to Table 1 provide all the necessary quali-fications to the various entries. The qualiquali-fications that apply to the auroral observations in the interval 1989–2004 are the same as those presented in Table 2 of the paper by Shiokawa et al. (2005), apart from insignificant changes of notation. The qualifications that apply to the auroral observations in the interval 1957–1960 have been derived from the diverse publications cited at the beginning of this section. In the context of the present investigation, the most important en-tries in Table 1 are the date and time of each Japanese auroral observation and the presence (or absence) of a sunspot large enough to be seen with the unaided eye, which is reasonably close to the central meridian immediately beforehand. The precise physical characteristics of each auroral observation are slightly less significant in terms of demonstrating that the technique developed for the identification of historical oc-currences of intense geomagnetic storms (Willis et al., 2005) is equally successful when used in conjunction with modern Japanese auroral observations.
3 White-light images of the Sun immediately prior to the Japanese auroral observations
The goal in this section is to present white-light images of the Sun from 1 to 6 days before the onset of the Japanese auroral observations discussed in Sect. 2 and summarised in Table 1. The sizes of all sunspots on the solar disk can then be compared with the threshold size of a sunspot capable of being detected with the unaided eye. Following the discus-sion in the paper by Willis et al. (2005), a distinction is made between “average” and “experienced” sunspot observers. It is assumed that an “average” observer can routinely detect sunspots with umbral and umbral plus penumbral (whole-spot) diameters of 15 and 41 arc s, respectively. However,
it seems likely that an “experienced” observer can detect sunspots with a penumbral diameter of about 25 arc s under optimal viewing conditions. Both criteria are used to assess the possibility of detecting a sunspot with the unaided eye (in the absence of cloud cover) prior to each of the Japanese auroral observations listed in Table 1. Column 10 in Table 1 summarises the results of an examination of white-light im-ages of the Sun immediately before each of the distinct dates of the auroral observations. The entry “Yes” in column 10 signifies that an “average” observer (and hence also an “ex-perienced” observer) would be able to detect at least one sunspot on the Sun’s surface with the unaided eye; the en-try “Yes?” signifies that an “experienced” observer would probably be able to detect at least one sunspot, whereas an “average” observer might fail to detect any sunspots; and the entry “No” signifies that neither “average” nor “experienced” observers would be able to detect any sunspots.
Newton (1958) and Howse (1975) have published detailed descriptions of the photoheliographs used in the programme of white-light solar observations maintained and organised for more than a century by the Royal Greenwich Obser-vatory (RGO). The measured sunspot areas and positions have been archived as the “Greenwich Photo-heliographic Results, 1873–1976” (Greenwich Observations, 1873–1955; Royal Observatory Bulletins, Series C, 1956–1961; Royal Observatory Annals, 1962–1976); further details are given in the paper by Willis et al. (1996). The Debrecen Helio-physical Observatory (DHO) has employed essentially the same procedures as the RGO and Gy˝ori et al. (2005) have discussed recent advances in the compilation of the Debre-cen sunspot catalogues, as well as the available sets of data and images. Further information on the available BBSO and SOHO images can be found at the respective websites (http://www.bbso.njit.edu and http://soi.stanford.edu).
The main source of the white-light solar images for any auroral observation is presented in parentheses in Table 1, according to the following abbreviations: Royal Greenwich Observatory (RGO); Big Bear Solar Observatory (BBSO); Debrecen Heliophysical Observatory (DHO); and Solar and Heliospheric Observatory (SOHO). If a continuous sequence of solar images for the appropriate six-day interval is not available from the same source, then images from another source are used to fill gaps in the main sequence. The final entry in column 10 of Table 1 is the number of the figure that shows a continuous sequence of solar images for one to six days before the date of each distinct Japanese auroral obser-vation. In each figure (apart from Fig. 1a), the source of each daily solar image is indicated immediately below the appro-priate image (i.e. RGO, BBSO, DHO, SOHO), together with the date and time of the solar image.
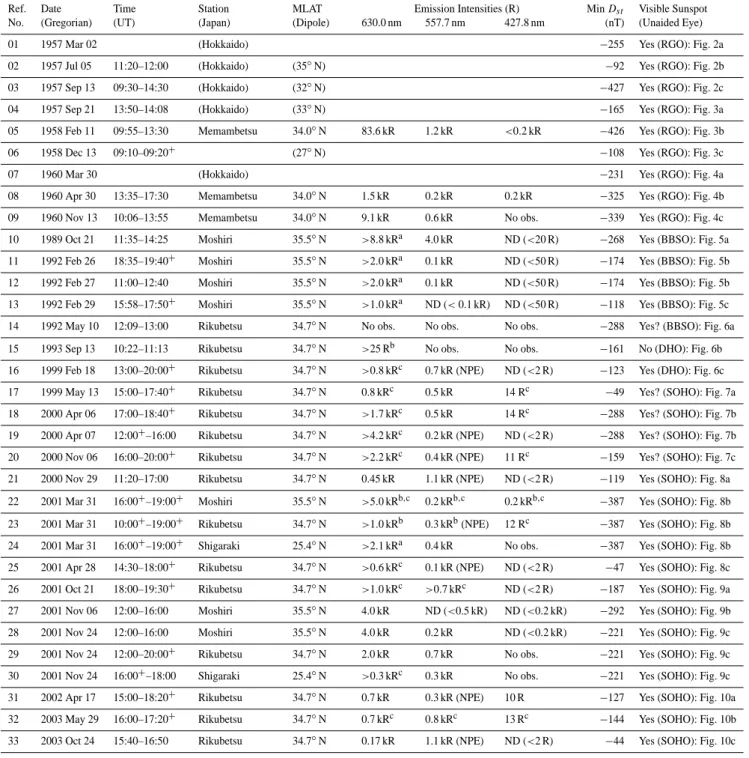
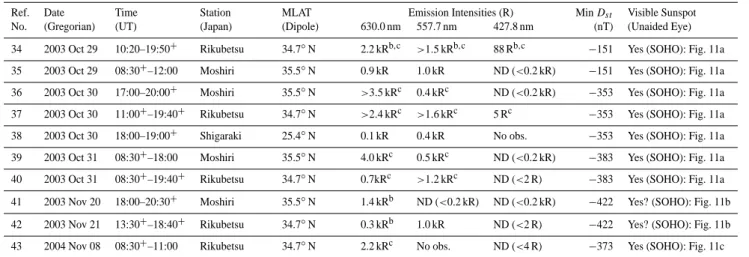
Table 1. Dates, times, locations and emission intensities of low-latitude auroral observations in Japan during the interval AD 1957–2004
are listed chronologically (after Shiokawa et al., 2005). For convenience, a reference number precedes each auroral observation. If the observation is not specific to a particular observatory, the location or region of the observation is given in parentheses (e.g. Hokkaido). The geomagnetic (dipole) latitude of the place of observation, or the lowest geomagnetic latitude (in parentheses) at which the aurora was observed (if known) in a specified region (in parentheses), as well as the minimum hourly value of theDst index during the course of the associated geomagnetic storm, are also presented. The final column shows whether or not (“Yes”, “No”) a sunspot large enough to be seen with the unaided eye was close to the central solar meridian at any time from one to six days before the auroral observation. The entry “Yes” signifies that both “average” and “experienced” observers would be able to detect at least one sunspot; the entry “Yes?” signifies that an “experienced” observer would probably be able to detect at least one sunspot, whereas an “average” observer might fail to detect any sunspots; and the entry “No” signifies that neither “average” nor “experienced” observers would be able to detect any sunspots.
Ref. Date Time Station MLAT Emission Intensities (R) MinDst Visible Sunspot
No. (Gregorian) (UT) (Japan) (Dipole) 630.0 nm 557.7 nm 427.8 nm (nT) (Unaided Eye)
01 1957 Mar 02 (Hokkaido) −255 Yes (RGO): Fig. 2a
02 1957 Jul 05 11:20–12:00 (Hokkaido) (35◦N) −92 Yes (RGO): Fig. 2b
03 1957 Sep 13 09:30–14:30 (Hokkaido) (32◦N) −427 Yes (RGO): Fig. 2c
04 1957 Sep 21 13:50–14:08 (Hokkaido) (33◦N) −165 Yes (RGO): Fig. 3a
05 1958 Feb 11 09:55–13:30 Memambetsu 34.0◦N 83.6 kR 1.2 kR <0.2 kR −426 Yes (RGO): Fig. 3b
06 1958 Dec 13 09:10–09:20+ (27◦N) −108 Yes (RGO): Fig. 3c
07 1960 Mar 30 (Hokkaido) −231 Yes (RGO): Fig. 4a
08 1960 Apr 30 13:35–17:30 Memambetsu 34.0◦N 1.5 kR 0.2 kR 0.2 kR −325 Yes (RGO): Fig. 4b
09 1960 Nov 13 10:06–13:55 Memambetsu 34.0◦N 9.1 kR 0.6 kR No obs. −339 Yes (RGO): Fig. 4c
10 1989 Oct 21 11:35–14:25 Moshiri 35.5◦N >8.8 kRa 4.0 kR ND (<20 R) −268 Yes (BBSO): Fig. 5a
11 1992 Feb 26 18:35–19:40+ Moshiri 35.5◦N >2.0 kRa 0.1 kR ND (<50 R) −174 Yes (BBSO): Fig. 5b
12 1992 Feb 27 11:00–12:40 Moshiri 35.5◦N >2.0 kRa 0.1 kR ND (<50 R) −174 Yes (BBSO): Fig. 5b
13 1992 Feb 29 15:58–17:50+ Moshiri 35.5◦N >1.0 kRa ND (<0.1 kR) ND (<50 R) −118 Yes (BBSO): Fig. 5c
14 1992 May 10 12:09–13:00 Rikubetsu 34.7◦N No obs. No obs. No obs. −288 Yes? (BBSO): Fig. 6a
15 1993 Sep 13 10:22–11:13 Rikubetsu 34.7◦N >25 Rb No obs. No obs. −161 No (DHO): Fig. 6b
16 1999 Feb 18 13:00–20:00+ Rikubetsu 34.7◦N >0.8 kRc 0.7 kR (NPE) ND (<2 R) −123 Yes (DHO): Fig. 6c
17 1999 May 13 15:00–17:40+ Rikubetsu 34.7◦N 0.8 kRc 0.5 kR 14 Rc −49 Yes? (SOHO): Fig. 7a
18 2000 Apr 06 17:00–18:40+ Rikubetsu 34.7◦N >1.7 kRc 0.5 kR 14 Rc −288 Yes? (SOHO): Fig. 7b
19 2000 Apr 07 12:00+–16:00 Rikubetsu 34.7◦N >4.2 kRc 0.2 kR (NPE) ND (<2 R) −288 Yes? (SOHO): Fig. 7b
20 2000 Nov 06 16:00–20:00+ Rikubetsu 34.7◦N >2.2 kRc 0.4 kR (NPE) 11 Rc −159 Yes? (SOHO): Fig. 7c
21 2000 Nov 29 11:20–17:00 Rikubetsu 34.7◦N 0.45 kR 1.1 kR (NPE) ND (<2 R) −119 Yes (SOHO): Fig. 8a
22 2001 Mar 31 16:00+–19:00+ Moshiri 35.5◦N >5.0 kRb,c 0.2 kRb,c 0.2 kRb,c −387 Yes (SOHO): Fig. 8b
23 2001 Mar 31 10:00+–19:00+ Rikubetsu 34.7◦N >1.0 kRb 0.3 kRb(NPE) 12 Rc −387 Yes (SOHO): Fig. 8b
24 2001 Mar 31 16:00+–19:00+ Shigaraki 25.4◦N >2.1 kRa 0.4 kR No obs. −387 Yes (SOHO): Fig. 8b
25 2001 Apr 28 14:30–18:00+ Rikubetsu 34.7◦N >0.6 kRc 0.1 kR (NPE) ND (<2 R) −47 Yes (SOHO): Fig. 8c
26 2001 Oct 21 18:00–19:30+ Rikubetsu 34.7◦N >1.0 kRc >0.7 kRc ND (<2 R) −187 Yes (SOHO): Fig. 9a
27 2001 Nov 06 12:00–16:00 Moshiri 35.5◦N 4.0 kR ND (<0.5 kR) ND (<0.2 kR) −292 Yes (SOHO): Fig. 9b
28 2001 Nov 24 12:00–16:00 Moshiri 35.5◦N 4.0 kR 0.2 kR ND (<0.2 kR) −221 Yes (SOHO): Fig. 9c
29 2001 Nov 24 12:00–20:00+ Rikubetsu 34.7◦N 2.0 kR 0.7 kR No obs. −221 Yes (SOHO): Fig. 9c
30 2001 Nov 24 16:00+–18:00 Shigaraki 25.4◦N >0.3 kRc 0.3 kR No obs. −221 Yes (SOHO): Fig. 9c
31 2002 Apr 17 15:00–18:20+ Rikubetsu 34.7◦N 0.7 kR 0.3 kR (NPE) 10 R −127 Yes (SOHO): Fig. 10a
32 2003 May 29 16:00–17:20+ Rikubetsu 34.7◦N 0.7 kRc 0.8 kRc 13 Rc −144 Yes (SOHO): Fig. 10b
Table 1. Continued.
Ref. Date Time Station MLAT Emission Intensities (R) MinDst Visible Sunspot
No. (Gregorian) (UT) (Japan) (Dipole) 630.0 nm 557.7 nm 427.8 nm (nT) (Unaided Eye)
34 2003 Oct 29 10:20–19:50+ Rikubetsu 34.7◦N 2.2 kRb,c >1.5 kRb,c 88 Rb,c −151 Yes (SOHO): Fig. 11a
35 2003 Oct 29 08:30+–12:00 Moshiri 35.5◦N 0.9 kR 1.0 kR ND (<0.2 kR) −151 Yes (SOHO): Fig. 11a
36 2003 Oct 30 17:00–20:00+ Moshiri 35.5◦N >3.5 kRc 0.4 kRc ND (<0.2 kR) −353 Yes (SOHO): Fig. 11a
37 2003 Oct 30 11:00+–19:40+ Rikubetsu 34.7◦N >2.4 kRc >1.6 kRc 5 Rc −353 Yes (SOHO): Fig. 11a
38 2003 Oct 30 18:00–19:00+ Shigaraki 25.4◦N 0.1 kR 0.4 kR No obs. −353 Yes (SOHO): Fig. 11a
39 2003 Oct 31 08:30+–18:00 Moshiri 35.5◦N 4.0 kRc 0.5 kRc ND (<0.2 kR) −383 Yes (SOHO): Fig. 11a
40 2003 Oct 31 08:30+–19:40+ Rikubetsu 34.7◦N 0.7kRc >1.2 kRc ND (<2 R) −383 Yes (SOHO): Fig. 11a
41 2003 Nov 20 18:00–20:30+ Moshiri 35.5◦N 1.4 kRb ND (<0.2 kR) ND (<0.2 kR) −422 Yes? (SOHO): Fig. 11b
42 2003 Nov 21 13:30+–18:40+ Rikubetsu 34.7◦N 0.3 kRb 1.0 kR ND (<2 R) −422 Yes? (SOHO): Fig. 11b
43 2004 Nov 08 08:30+–11:00 Rikubetsu 34.7◦N 2.2 kRc No obs. ND (<4 R) −373 Yes (SOHO): Fig. 11c
Notes: Local Mean Time (LT) and Universal Time (UT) are related by the equation LT=UT+9 h. A superscript plus sign (+) following the time indicates that the event may last longer (e.g. measurements were terminated due to sunrise or moonrise). ND signifies that emission at the associated wavelength is not detected (i.e. is less than the noise level of measurement). NPE signifies that there is no significant enhancement in the northern direction (i.e. northward and southward intensities are comparable). No obs. signifies that no observations are available. Superscript “a” indicates that the maximum intensity should be larger (instrumental saturation); superscript “b” indicates that the maximum intensity should be larger (measurements through a cloudy sky); and superscript “c” indicates that the maximum intensity should be larger (measurements were terminated due to sunrise or moonrise). Following advice received from K. Shiokawa (personal communication, 2005), the tabulated emission intensities for each auroral event observed at Memambetsu are obtained by averaging the measured emission intensities at a zenith angle of 75◦N (Kakioka Magnetic Observatory, 1969) over the entire time interval. Final hourly values of theDst index (column 9) are available up to the end of 2003 and provisional values are available thereafter. The abbreviations for the sources of the solar images (column 10) are as follows: Royal Greenwich Observatory (RGO); Big Bear Solar Observatory (BBSO); Debrecen Heliophysical Observatory (DHO); and Solar and Heliospheric Observatory (SOHO).
Gopalswamy et al., 2000; Cane et al., 2000; Wang et al., 2002; Gonz´alez-Esparza et al., 2003; Zhang et al., 2003; Sri-vastava and Venkatakrishnan, 2004). This time delay varies from storm to storm, depending on the exact location of the “geo-effective” plasma within the solar wind material. For the purposes of the present investigation, it suffices to note that several studies have indicated that coronal mass ejec-tions (CMEs) from the Sun (in particular magnetic clouds) are the main drivers of major geomagnetic storms (Gosling et al., 1991: Richardson et al., 2001; Gopalswamy et al., 2005; Xie et al., 2006). The shortest known time delay between an energetic solar feature and the onset of a geomagnetic storm is about 17.5 h (Royal Greenwich Observatory, 1955); this time delay is associated with the first observation of a white-light flare on 1859 September 01 (Carrington, 1860; Hodg-son, 1860) and the abrupt onset of a great geomagnetic storm on the following day. This storm was the second in a pair of violent storms that produced brilliant auroral displays seen from many parts of the world (Silverman, 2006). In the case of historical geomagnetic storms, for which the best time res-olution is one day (24 h), Willis et al. (2005) assumed that the time delay between the solar event and the onset of the his-torical geomagnetic storm was within the range 1 to 6 days.
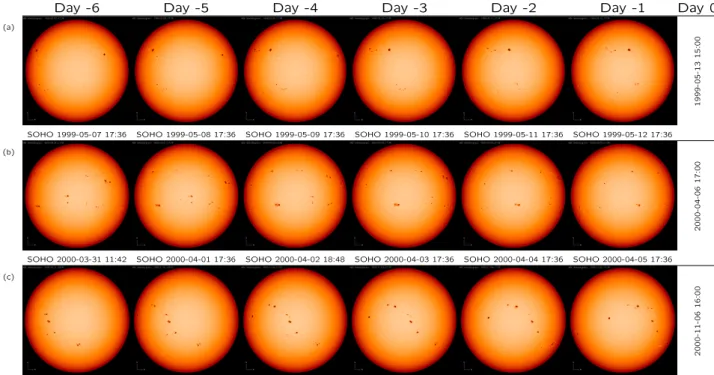
The Solar and Heliospheric Observatory (SOHO) space-craft normally acquires more than one white-light image of the Sun on each day, frequently as many as four. The first SOHO image examined for each of the appropriate Japanese auroral observations listed in Table 1 is the one that corre-sponds to a time (UT) as close as possible to, but greater than, the limiting value of 17.5 h before the time of onset (UT) of the associated auroral emission, which is consid-ered to occur on Day 0; this first SOHO image is labelled Day–1. The five preceding SOHO images are those that cor-respond as closely as possible to the same time of day as the first image, progressing backwards in time; these are labelled Day –2, Day –3, Day –4, Day –5, Day –6, respectively. As a result of operational constraints, it is not always possible to obtain a set of six daily SOHO images (Day –6, Day –5, Day –4, Day –3, Day –2, and Day –1) separated by exactly 24 h. However, often only one or two SOHO images in a set of six depart significantly from an approximate sequence of 24-h separations.
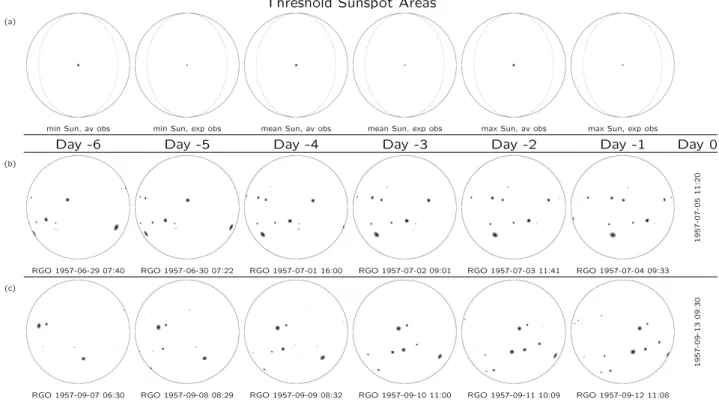
Threshold Sunspot Areas
(a)
min Sun, av obs min Sun, exp obs mean Sun, av obs mean Sun, exp obs max Sun, av obs max Sun, exp obs
Day -6 Day -5 Day -4 Day -3 Day -2 Day -1 Day 0
(b)
1957-
07-05
11:
20
RGO 1957-06-29 07:40 RGO 1957-06-30 07:22 RGO 1957-07-01 16:00 RGO 1957-07-02 09:01 RGO 1957-07-03 11:41 RGO 1957-07-04 09:33 (c)
1957-
09-13
09:
30
RGO 1957-09-07 06:30 RGO 1957-09-08 08:29 RGO 1957-09-09 08:32 RGO 1957-09-10 11:00 RGO 1957-09-11 10:09 RGO 1957-09-12 11:08
Fig. 1. (a) Threshold areas for the detection of sunspots with the unaided eye for “average” and “experienced” observers (av obs and exp obs),
respectively. Successive pairs of images, which are all reduced to a common solar diameter, show the negligible variation of these threshold areas during the course of a year (i.e. for minimum, mean and maximum distances of the Sun from the Earth). (b) and (c) Reconstructed solar images for the six-day intervals immediately prior to the Japanese auroral events on 1957 July 05 and 1957 September 13, respectively.
a time (UT) as close as possible to, but greater than, 17.5 h before the time of onset (UT) of the associated auroral emis-sion; this image is again labelled Day –1. In the two cases for which the time of onset of the auroral emission is un-known (1957 March 02 and 1960 March 30), this onset time is arbitrarily assumed to be 12:00 UT for the sake of defi-niteness. The five preceding solar images in each six-day se-quence are then the single daily solar images for the five days before Day –1, although the time difference between succes-sive “ground-based” images may depart significantly from 24 h. It is clear from Table 1 that Japanese auroral obser-vations are sometimes made on consecutive nights. In such instances, Day –1 is measured from the first day in the set of consecutive auroral observations. In the case of multi-ple auroral observations on the same day, time is measured backwards from the start of the interval with the maximum emission intensity at 630 nm.
Figure 1a shows the threshold areas for the detection of sunspots with the unaided eye for “average” and “experi-enced” observers, respectively. According to the threshold areas quoted previously, Fig. 1a shows, alternately, a single sunspot with umbral and umbral plus penumbral diameters of 15 and 41 arc s, located at the centre of the solar disk, and a single sunspot with just a penumbral area of 25 arc s, again located at the centre of the solar disk. For future reference,
the first, second and third pairs of images in Fig. 1a (viewed from the left) show the threshold areas for “average” and “ex-perienced” observers, respectively, for the minimum, mean (or average) and maximum distances of the Sun from the Earth during the course of the year, if all images are reduced to a common solar diameter. It is clear from Fig. 1a that the apparent annual variation in the diameter of the Sun, as seen from the Earth, makes a negligible difference to the ef-fective threshold areas for both “average” and “experienced” observers, at least on the scale of the set of solar images pre-sented in this paper (Figs. 2–11). However, in a more quanti-tative study of the presence of large sunspots near the central solar meridian at the times of geomagnetic storms, it might be wise to allow for the small annual changes in the threshold sunspot areas (as indicated schematically in Fig. 1a). More-over, because of foreshortening, the projected threshold ar-eas shown in Fig. 1a would become elliptical and smaller if they were simply rotated away from the centre of the solar disk. Therefore, the true threshold areas of sunspots, which are merely shown located at the centre of the solar disk in Fig. 1a for convenience, must be used in comparisons with actual sunspot areas, irrespective of the location of the latter on the solar disk.
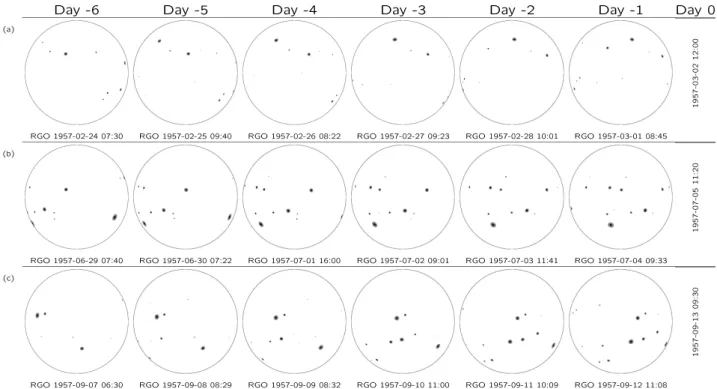
Day -6 Day -5 Day -4 Day -3 Day -2 Day -1 Day 0
(a)
1957-
03-02
12:
00
RGO 1957-02-24 07:30 RGO 1957-02-25 09:40 RGO 1957-02-26 08:22 RGO 1957-02-27 09:23 RGO 1957-02-28 10:01 RGO 1957-03-01 08:45 (b)
1957-
07-05
11:
20
RGO 1957-06-29 07:40 RGO 1957-06-30 07:22 RGO 1957-07-01 16:00 RGO 1957-07-02 09:01 RGO 1957-07-03 11:41 RGO 1957-07-04 09:33
(c)
1957-
09-13
09:
30
RGO 1957-09-07 06:30 RGO 1957-09-08 08:29 RGO 1957-09-09 08:32 RGO 1957-09-10 11:00 RGO 1957-09-11 10:09 RGO 1957-09-12 11:08
Fig. 2. Reconstructed solar images for the six-day intervals immediately prior to the Japanese auroral events on: (a) 1957 March 02; (b) 1957 July 05; and (c) 1957 September 13.
that the energetic solar feature producing the historical ge-omagnetic storm must have occurred when the associated sunspot was within±4 days (or about±50◦of heliographic longitude) of the central solar meridian (Willis et al., 2005). Therefore, in the context of testing the procedure for detect-ing historical geomagnetic storms usdetect-ing modern sunspot and auroral observations, a sunspot (or sunspot group) must not only be large enough to be seen with the unaided eye but it must also be within±4 days of the central meridian. In order to illustrate this additional criterion, Fig. 1a also shows dot-ted lines (meridians) at±50◦of heliographic longitude with respect to the central meridian. Sunspots (or sunspot groups) that are closer to the central solar meridian than the dotted lines, and also large enough to be seen with the unaided eye, can be associated meaningfully with Japanese auroral obser-vations. Conversely, sunspots that are further from the cen-tral meridian (i.e. closer to the solar limbs) than the dotted lines cannot be associated meaningfully with Japanese auro-ral observations, irrespective of their size, because the asso-ciated active solar region (and hence energetic solar feature) is most unlikely to generate a terrestrial geomagnetic storm, at least in a statistical sense.
Figures 1a, b and c have all been produced using the tech-nique for reconstructing solar images developed previously (Willis et al., 1996). In this technique, it is assumed that the umbral and umbral plus penumbral (whole-spot) areas of each sunspot group can be represented by concentric circular areas (or, more accurately, zones of one base) on the visible
hemispherical solar surface. The common centre of these two circular areas is supposed to be located at the centre of the sunspot group. This approach allows for foreshortening but is based on the assumption that the boundaries of the ob-served (i.e. projected) umbral and penumbral areas are exact ellipses. An assumption of this type is an almost inevitable consequence of the fact that no information on the irregu-lar shapes of individual sunspots, and only limited informa-tion on the irregular distribuinforma-tion of spots within groups, has been archived in the “Greenwich Photo-heliographic Results, 1873–1976”. Nevertheless, the procedure for reconstructing solar images provides an acceptably accurate visual repre-sentation of an individual sunspot that is not too close to the limb of the Sun. In the case of a complex sunspot group, however, the procedure only provides an approximate visual representation in the sense that the total umbral and penum-bral areas are correct but the assumed distribution of these areas on the solar surface is a rather extreme simplification.
Day -6 Day -5 Day -4 Day -3 Day -2 Day -1 Day 0
(a)
1957-
09-21
13:
50
RGO 1957-09-15 09:44 RGO 1957-09-16 07:33 RGO 1957-09-17 02:16 RGO 1957-09-18 07:46 RGO 1957-09-19 11:03 RGO 1957-09-20 08:39
(b)
1958-
02-11
09:
55
RGO 1958-02-05 13:56 RGO 1958-02-06 07:04 RGO 1958-02-07 07:06 RGO 1958-02-08 07:00 RGO 1958-02-09 12:01 RGO 1958-02-10 09:33 (c)
1958-
12-13
09:
10
RGO 1958-12-07 06:41 RGO 1958-12-08 13:03 RGO 1958-12-09 09:15 RGO 1958-12-10 09:24 RGO 1958-12-11 12:54 RGO 1958-12-12 06:46
Fig. 3. Same as Fig. 2 but for the Japanese auroral events on: (a) 1957 September 21; (b) 1958 February 11; and (c) 1958 December 13.
Day -6 Day -5 Day -4 Day -3 Day -2 Day -1 Day 0
(a)
1960-
03-30
12:
00
RGO 1960-03-24 09:56 RGO 1960-03-25 16:32 RGO 1960-03-26 15:04 RGO 1960-03-27 08:38 RGO 1960-03-28 07:16 RGO 1960-03-29 08:13
(b)
1960-
04-30
13:
35
RGO 1960-04-24 07:35 RGO 1960-04-25 07:29 RGO 1960-04-26 07:58 RGO 1960-04-27 07:29 RGO 1960-04-28 07:32 RGO 1960-04-29 08:15
(c)
1960-
11-13
10:
06
RGO 1960-11-07 09:46 RGO 1960-11-08 11:44 RGO 1960-11-09 14:02 RGO 1960-11-10 11:00 RGO 1960-11-11 09:34 RGO 1960-11-12 07:01
Day -6 Day -5 Day -4 Day -3 Day -2 Day -1 Day 0
(a)
1989-
10-21
11:
35
BBSO 1989-10-15 19:14 BBSO 1989-10-16 17:58 BBSO 1989-10-17 21:43 BBSO 1989-10-18 23:17 DHO 1989-10-19 07:17 BBSO 1989-10-20 17:55
(b)
1992-
02-26
18:
35
BBSO 1992-02-20 20:12 BBSO 1992-02-21 17:41 BBSO 1992-02-22 19:10 BBSO 1992-02-23 18:09 BBSO 1992-02-24 17:58 DHO 1992-02-25 12:40
(c)
1992-
02-29
15:
58
BBSO 1992-02-23 18:09 BBSO 1992-02-24 17:58 DHO 1992-02-25 12:40 BBSO 1992-02-26 22:10 BBSO 1992-02-27 17:51 BBSO 1992-02-28 18:56
Fig. 5. Actual solar images for the six-day intervals immediately prior to the Japanese auroral events on: (a) 1989 October 21; (b) 1992
Febru-ary 26; and (c) 1992 FebruFebru-ary 29.
Day -6 Day -5 Day -4 Day -3 Day -2 Day -1 Day 0
(a)
1992-
05-10
12:
09
DHO 1992-05-04 06:20 DHO 1992-05-05 15:33 DHO 1992-05-06 12:42 BBSO 1992-05-07 19:00 BBSO 1992-05-08 17:08 BBSO 1992-05-09 17:22
(b)
1993-
09-13
10:
22
DHO 1993-09-07 06:17 DHO 1993-09-08 09:53 DHO 1993-09-09 07:27 DHO 1993-09-10 13:39 DHO 1993-09-11 07:16 DHO 1993-09-12 13:37
(c)
1999-
02-18
13:
00
SOHO 1999-02-12 09:36 SOHO 1999-02-13 11:38 SOHO 1999-02-14 12:03 DHO 1999-02-15 09:54 DHO 1999-02-16 08:19 DHO 1999-02-17 11:01
Day -6 Day -5 Day -4 Day -3 Day -2 Day -1 Day 0
(a)
1999-
05-13
15:
00
SOHO 1999-05-07 17:36 SOHO 1999-05-08 17:36 SOHO 1999-05-09 17:36 SOHO 1999-05-10 17:36 SOHO 1999-05-11 17:36 SOHO 1999-05-12 17:36
(b)
2000-
04-06
17:
00
SOHO 2000-03-31 11:42 SOHO 2000-04-01 17:36 SOHO 2000-04-02 18:48 SOHO 2000-04-03 17:36 SOHO 2000-04-04 17:36 SOHO 2000-04-05 17:36
(c)
2000-
11-06
16:
00
SOHO 2000-10-31 18:00 SOHO 2000-11-01 18:02 SOHO 2000-11-02 17:52 SOHO 2000-11-03 17:36 SOHO 2000-11-04 17:36 SOHO 2000-11-05 17:36
Fig. 7. Same as Fig. 5 but for the Japanese auroral events on: (a) 1999 May 13; (b) 2000 April 06; and (c) 2000 November 06.
and “experienced” observers, and lying within±50◦of heli-ographic longitude with respect to the central meridian, ex-isted for all 6 days (Day –6 to Day –1) immediately prior to the Japanese auroral observations on 1957 July 05 and 1957 September 13. These two sequences of reconstructed solar images have been selected for presentation in Figs. 1b and c because they correspond to the first two auroral events for which the time of the auroral observation is known (i.e. Ref. Nos. 02 and 03 in Table 1).
Although the comparisons between the sunspot areas pre-sented in Figs. 1b and c and the threshold areas prepre-sented in Fig. 1a are implicitly visual, it is possible to validate numerically the statement that at least one sunspot large enough to be seen easily by both “average” and “experi-enced” observers existed for all 6 days immediately prior to the Japanese auroral observations on 1957 July 05 and 1957 September 13. Since it is assumed that an “average” ob-server can routinely detect sunspots with umbral and umbral plus penumbral (whole-spot) diameters of 15 and 41 arc s, respectively, the corresponding mean threshold areas are 61 and 456 millionths of the Sun’s visible disk, taking the semi-diameter of the Sun at the mean Earth distance to be approx-imately 960 arc s (Cox, 2000). Likewise, since an “experi-enced” observer can detect sunspots with a penumbral diam-eter of about 25 arc s under optimal viewing conditions, the corresponding mean threshold area is 170 millionths of the Sun’s visible disk. The actual projected umbral and umbral plus penumbral (whole-spot) areas for any particular day can be derived from the corresponding areas in the “Greenwich
Photo-heliographic Results, 1873–1976”, which have been corrected for foreshortening and are expressed in millionths of the Sun’s visible hemisphere, simply by reversing the fore-shortening correction.
Day -6 Day -5 Day -4 Day -3 Day -2 Day -1 Day 0
(a)
2000-
11-29
11:
20
SOHO 2000-11-23 17:36 SOHO 2000-11-24 17:36 SOHO 2000-11-25 17:36 SOHO 2000-11-26 17:36 SOHO 2000-11-27 17:36 SOHO 2000-11-28 17:36
(b)
2001-
03-31
16:
00
SOHO 2001-03-25 17:36 SOHO 2001-03-26 17:36 SOHO 2001-03-27 17:36 SOHO 2001-03-28 17:36 SOHO 2001-03-29 17:36 SOHO 2001-03-30 17:36
(c)
2001-
04-28
14:
30
SOHO 2001-04-22 17:36 SOHO 2001-04-23 17:36 SOHO 2001-04-24 17:36 SOHO 2001-04-25 18:08 SOHO 2001-04-26 17:36 SOHO 2001-04-27 17:36
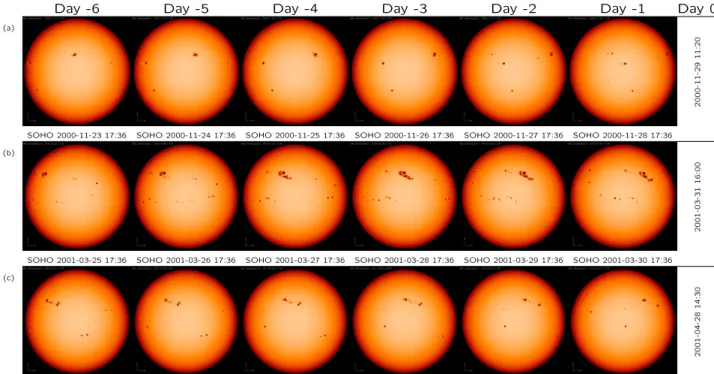
Fig. 8. Same as Fig. 5 but for the Japanese auroral events on: (a) 2000 November 29; (b) 2001 March 31; and (c) 2001 April 28.
which appears to have been made in a deliberate manner, only affects the very smallest sunspots and hence is unim-portant in the present study.]
Actual white-light photographs of the Sun acquired by the Big Bear Solar Observatory (BBSO), the Debrecen Helio-physical Observatory (DHO) and the Solar and Heliospheric Observatory (SOHO) are presented in Figs. 5–11. Apart from the replacement of reconstructed images by actual im-ages, the format in Figs. 5–11 is exactly the same as in Figs. 2–4.
Despite the difficulties involved in making comparisons between the reconstructed threshold sunspot areas presented in Fig. 1a and the “experimentally recorded” areas of the sunspots that appear in Figs. 5–11, it is still preferable to present real solar images, whenever possible, because these are much closer to what an observer would actually see with the unaided eye. The difficulties in making such comparisons are threefold. First, as noted previously, Fig. 1a shows true threshold areas for “average” and “experienced” observers for the case in which these threshold areas are located at the centre of the Sun. Owing to foreshortening, the depicted threshold areas would decrease in size and become elliptical if the threshold sunspot area were simply rotated away from the centre of the Sun. Fortunately, the foreshortening fac-tor is not hugely significant provided the threshold sunspot remains within about±50◦ of heliographic longitude with respect to the central meridian (i.e. within the dotted lines shown in Fig. 1a). However, visual comparisons made us-ing the true threshold areas shown in Fig. 1a represent the
most exacting test of the visibility of any actual sunspot with the unaided eye. Second, reconstructed solar images have a much greater contrast than actual solar images, which makes comparisons difficult for the small-format solar images pre-sented in the figures. [The authors have employed the practi-cal expediency of printing the threshold areas presented in Fig. 1a on a transparency and then overlaying this trans-parency on the solar images.] Nevertheless, it seems prefer-able to present all the relevant solar images, rather than just a selection, despite the fact that it is very difficult to detect small sunspots in the small-format images. Third, the bound-aries of the reconstructed threshold areas are assumed to be circular on the solar surface (but projected areas are elliptical away from the Sun’s centre), whereas actual sunspot areas are often distributed irregularly on the solar surface. Com-parisons are then slightly problematic if each of a pair of closely adjacent sunspots has an area less than the threshold area but the combined area of the pair exceeds the threshold area.
Day -6 Day -5 Day -4 Day -3 Day -2 Day -1 Day 0
(a)
2001-
10-21
18:
00
SOHO 2001-10-15 24:00 SOHO 2001-10-16 24:00 SOHO 2001-10-17 24:00 SOHO 2001-10-18 20:25 SOHO 2001-10-19 24:00 SOHO 2001-10-20 24:00
(b)
2001-
11-06
12:
00
SOHO 2001-10-31 08:36 SOHO 2001-11-01 11:12 SOHO 2001-11-02 09:36 SOHO 2001-11-03 11:12 SOHO 2001-11-04 11:12 SOHO 2001-11-05 11:12
(c)
2001-
11-24
12:
00
SOHO 2001-11-18 11:12 SOHO 2001-11-19 11:12 SOHO 2001-11-20 06:24 SOHO 2001-11-21 11:12 SOHO 2001-11-22 11:12 SOHO 2001-11-23 11:12
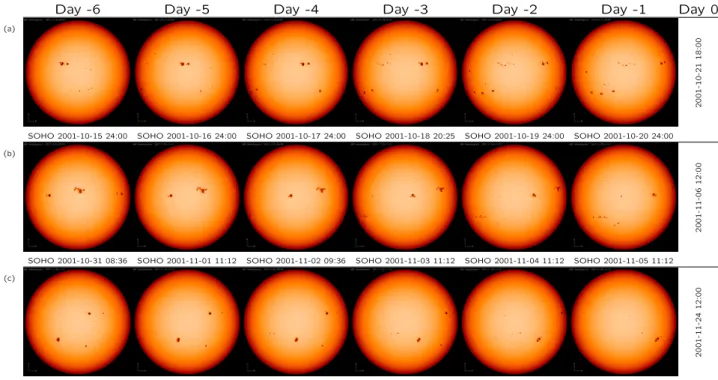
Fig. 9. Same as Fig. 5 but for the Japanese auroral events on: (a) 2001 October 21; (b) 2001 November 06; and (c) 2001 November 24.
observer might also have been unable to see a sunspot for the auroral events on 1992 May 10 (Fig. 6a), 1999 May 13 (Fig. 7a), 2000 April 06/07 (Fig. 7b), 2000 November 06 (Fig. 7c), and 2003 November 20/21 (Fig. 11b). However, an “average” sunspot observer would still have been able to see a sunspot with the unaided eye before 24 of the 30 dis-tinct Japanese auroral observations listed in Table 1, which represents an 80% success rate. If the auroral events on 2003 October 29 and 30 are regarded as being produced by three separate geomagnetic storms, defined by the three distinct minima in theDst index, the success rates for both
“experi-enced” and “average” observers are marginally higher. A few brief comments should be made on the possi-ble reasons for a small number of Japanese auroral events (and hence geomagnetic storms) not being associated with large sunspots near the central solar meridian, as noted in the previous paragraph. Cane et al. (1996) have associ-ated a cosmic-ray decrease on 1992 May 09, one day be-fore the auroral event on May 10, with a solar event on May 08 (Day –2) that was in very close proximity to the bipo-lar pair of sunspots shown in Fig. 6a. Limited sobipo-lar wind data are available for the auroral event on 1993 September 13 (Fig. 6b). Therefore, it is not clear whether the solar source was a transient or perhaps a co-rotating interplan-etary stream. Nor is it known if there were any coronal holes at the “correct” location. There is still considerable de-bate about the solar sources of the geomagnetic storms (and hence auroral events) on 2000 April 06/07 (Fig. 7b) and 2000
November 06 (Fig. 7c), which reflects the lack of major solar activity in the correct time frames. However, it is known that the geomagnetic storm and auroral event on 2003 Novem-ber 20 (Fig. 11b) was so intense because of a sustained strong southward-directed interplanetary magnetic field (∼50 nT) at the Earth; there was also an associated fast CME that erupted on November 18 (Gopalswamy et al., 2005).
4 Discussion and conclusions
Day -6 Day -5 Day -4 Day -3 Day -2 Day -1 Day 0
(a)
2002-
04-17
15:
00
SOHO 2002-04-11 17:36 SOHO 2002-04-12 17:36 SOHO 2002-04-13 17:36 SOHO 2002-04-14 16:00 SOHO 2002-04-15 17:36 SOHO 2002-04-16 19:45
(b)
2003-
05-29
16:
00
SOHO 2003-05-23 19:28 SOHO 2003-05-24 17:36 SOHO 2003-05-25 17:36 SOHO 2003-05-26 17:36 SOHO 2003-05-27 17:36 SOHO 2003-05-28 18:06
(c)
2003-
10-24
15:
40
SOHO 2003-10-18 17:36 SOHO 2003-10-19 17:36 SOHO 2003-10-20 17:36 SOHO 2003-10-21 17:36 SOHO 2003-10-22 17:36 SOHO 2003-10-23 17:36
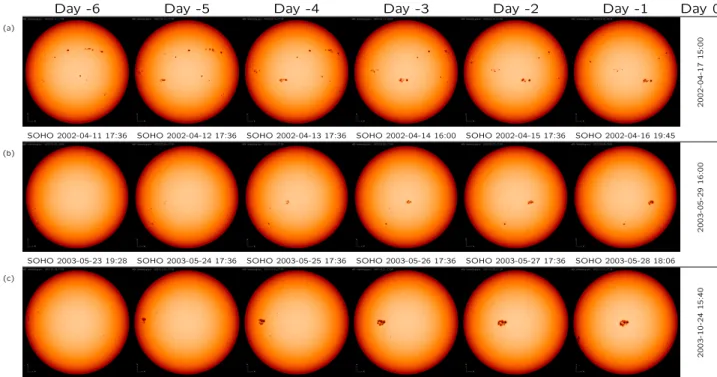
Fig. 10. Same as Fig. 5 but for the Japanese auroral events on: (a) 2002 April 17; (b) 2003 May 29; and (c) 2003 October 24.
Table 1 lists the relevant properties of 43 modern Japanese auroral observations acquired during the interval 1957–2004. The most important scientific properties of these observa-tions are the date and time of onset of each auroral display. Solar images are examined for an interval extending from 1 to 6 days before the onset of each Japanese auroral observa-tion. Sunspots or sunspot groups that are within±4 days (or ±50◦ of heliographic longitude) of the central solar merid-ian are compared with the threshold areas for the detection of sunspots with the unaided eye. This comparison is performed for both “average” and “experienced” sunspot observers. It is inferred from the reconstructed threshold sunspot areas shown in Fig. 1a and either the reconstructed or actual solar images presented in Figs. 2–11 that an “experienced” sunspot observer would have been able to detect at least one sunspot with the unaided eye before all but one of the 30 distinct Japanese auroral observations listed in Table 1, which rep-resents a 97% success rate. Even an “average” sunspot ob-server would have been able to detect at least one sunspot with the unaided eye before 24 of the 30 distinct Japanese auroral observations listed in Table 1, which represents an 80% success rate.
On the basis of the present study of modern sunspot and auroral observations, it is concluded that the technique de-veloped by Willis et al. (2005) for the identification of pos-sible historical occurrences of intense geomagnetic storms is valid, in the sense that essentially the same technique is certainly successful when applied to modern auroral obser-vations at low geomagnetic latitudes in Japan. This result is
important because the only historical observations that pro-vide many precise dates (year, month and day all recorded exactly) over a time interval extending back over millennia are unaided eye observations of sunspots and aurorae from East Asia. The radioisotopes14C and10Be, which are ex-tremely valuable in studies of long-term variations in solar activity, have a time resolution of at least several weeks and hence they cannot be used to identify individual geomagnetic storms.
Day -6 Day -5 Day -4 Day -3 Day -2 Day -1 Day 0
(a)
2003-
10-29
10:
20
SOHO 2003-10-23 11:12 SOHO 2003-10-24 11:12 SOHO 2003-10-25 11:12 SOHO 2003-10-26 11:12 SOHO 2003-10-27 11:12 SOHO 2003-10-28 11:12
(b)
2003-
11-20
18:
00
SOHO 2003-11-14 17:36 SOHO 2003-11-15 17:36 SOHO 2003-11-16 17:36 SOHO 2003-11-17 17:36 SOHO 2003-11-18 17:36 SOHO 2003-11-19 17:36
(c)
2004-
11-08
08:
30
SOHO 2004-11-02 11:12 SOHO 2004-11-03 11:12 SOHO 2004-11-04 09:36 SOHO 2004-11-05 09:36 SOHO 2004-11-06 11:26 SOHO 2004-11-07 11:26
Fig. 11. Same as Fig. 5 but for the Japanese auroral events on: (a) 2003 October 29; (b) 2003 November 20; and (c) 2004 November 08.
that sunspots cause mid-latitude auroral displays. However, sunspots that are in the vicinity of the central solar merid-ian and large enough to be seen with the unaided eye appear to indicate potential solar activity that is capable of produc-ing an intense geomagnetic storm and a concomitant auro-ral display at low geomagnetic latitudes. With our definition (Willis et al., 2005), the identification of an historical geo-magnetic storm depends on the approximate coincidence of a large sunspot and a conspicuous auroral display (both visible with the unaided eye). Therefore, large sunspots that are not associated with a geomagnetic storm and concomitant auro-ral display are never identified by the selection procedure.
In an attempt to identify the solar and interplanetary vari-ables that influence the magnitude of resulting geomagnetic storms, Srivastava (2005) has compared five geomagnetic super-storms (Dst<−300 nT) that have occurred during the
current solar cycle (which commenced in May 1996) and hence after the launch of the SOHO spacecraft. Four of these five super-storms, namely those on 2001 March 31, 2003 Oc-tober 29, 2003 OcOc-tober 30 and 2003 November 20, are in-cluded in the list of Japanese auroral observations presented in Table 1. Apparently, the super-storm on 2000 July 15 did not result in any recorded auroral displays in Japan. Srivas-tava (2005) concluded that the geomagnetic super-storms on 2001 March 31, 2003 October 29 and 2003 October 30 were associated with flares originating from large magnetic active regions located close to the central solar meridian at low he-liographic latitudes. For all three of these super-storms, there
was a very large and complex sunspot group near the central meridian immediately before the corresponding Japanese au-roral observations (see Figs. 8b and 11a), which is compat-ible with a large magnetic active region close to the central meridian. The super-storm of 2003 November 20, for which the corresponding sunspot group is appreciably smaller and essentially bipolar (see Fig. 11b), possibly owes its large magnitude to the length of time for which a strong inter-planetary magnetic field (∼50 nT) was directed southwards (Gopalswamy et al., 2005; Srivastava, 2005).
Acknowledgements. The authors thank H. E. Coffey, A. Fludra,
R. A. Harrison and K. Shiokawa for valuable advice. They are greatly indebted to T. Baranyi and J. R. Varsik, who kindly repro-cessed some of the solar images from the Debrecen Heliophysical Observatory and the Big Bear Solar Observatory, respectively, to ensure that all solar images in Figs. 5–11 have exactly the same orientation and almost the same diameter. SOHO is a project of in-ternational cooperation between ESA and NASA: the MDI images presented in this paper are from the publicly available archive at Stanford University. The authors also thank two referees for con-structive and helpful comments.
Topical Editor B. Forsyth thanks I. Richardson and another ref-eree for their help in evaluating this paper.
References
Brueckner, G. E., Delaboudiniere, J.-P., Howard, R. A., Paswaters, S. E., St. Cyr, O. C., Schwenn, R., Lamy, P., Simnett, G. M., Thompson, B., and Wang, D.: Geomagnetic storms caused by coronal mass ejections (CMEs): March 1996 through June 1997, Geophys. Res. Lett., 25, 3019–3022, 1998.
Cane, H. V., Richardson, I. G., and St. Cyr, O. C.: Coronal mass ejections, interplanetary ejecta and geomagnetic storms, Geo-phys. Res. Lett., 27, 3591–3594, 2000.
Carrington, R. C.: Description of a singular appearance seen in the Sun on September 1, 1859, M. N. R. A. S., 20, 13–15, 1860. Cox, A. N. (Ed.): Allen’s Astrophysical Quantities, Fourth Edition,
AIP Press, Springer-Verlag, New York, Berlin, Heidelberg, 2000. Crooker, N. U.: Solar and heliospheric geoeffective disturbances, J.
Atmos. Solar-Terr. Phys., 62, 1071–1085, 2000.
Crooker, N. U. and Cliver, E. W.: Postmodern view of M-regions, J. Geophys. Res., 99, 23 383–23 390, 1994.
Gonzalez, W. D., Tsurutani, B. T., and Cl´ua de Gonzalez, A. L.: Interplanetary origin of geomagnetic storms, Space Sci. Rev., 88, 529–562, 1999.
Gonzalez, W. D., Tsurutani, B. T., Lepping, R. P., and Schwenn, R.: Interplanetary phenomena associated with very intense geomag-netic storms, J. Atmos. Solar-Terr. Phys., 64, 173–181, 2002. Gonz´alez-Esparza, J. A., Lara, A., P´erez-Tijerina, E., Santill´an,
A., and Gopalswamy, N.: A numerical study on the ac-celeration and transit time of coronal mass ejections in the interplanetary medium, J. Geophys. Res., 108(A1), 1039, doi:10.1029/2001JA009186, 2003.
Gopalswamy, N., Lara, A., Lepping, R. P., Kaiser, M. L., Berdichevsky, D., and St. Cyr, O. C.: Interplanetary accelera-tion of coronal mass ejecaccelera-tions, Geophys. Res. Lett., 27, 145–148, 2000.
Gopalswamy, N., Yashiro, S., Michalek, G., Xie, H., Lepping, R. P., and Howard, R. A.: Solar sources of the largest geo-magnetic storm of cycle 23, Geophys. Res. Lett., 32, L12S09, doi:10.1029/2004GL021639, 2005.
Gosling, J. T., McComas, D. J., Phillips, J. L., and Bame, S. J.: Geo-magnetic activity associated with Earth passage of interplanetary shock disturbances and coronal mass ejections, J. Geophys. Res., 96, 7831–7839, 1991.
Gy˝ori, L., Baranyi, T., Murak¨ozy, J., and Ludm´any, A.: Recent ad-vances in the Debrecen sunspot catalogues, Memorie della So-ciet`a Astronomica Italiana, 76, 981–984, 2005.
Hikosaka, T.: On the great enhancement of the line [OI] 6300 in the aurora at Niigata on February 11, 1958, Rep. Ionos. Res. Jpn., 12, 469–471, 1958.
Hodgson, R.: On a curious appearance seen in the Sun, M. N. R. A. S., 20, 15–16, 1860.
Howse, H. D.: Greenwich Observatory: The Royal Observatory at Greenwich and Herstmonceux 1675–1976, Volume 3: Buildings and Instruments, Taylor and Francis, London, 1975.
Huruhata, M.: Aurora and airglow observations on February 11, 1958, Rep. Ionos. Res. Jpn., 12, 40–41, 1958.
Huruhata, M.: IV. Aurora and airglow, in Japanese Contribu-tion to the InternaContribu-tional Geophysical Year 1957/8, Vol. II, Na-tional Committee for the InternaNa-tional Geophysical Year, Science Council of Japan, Ueno Park, Tokyo, Japan, 44–54, 1960. Kakioka Magnetic Observatory: Report of the auroras observed at
Memambetsu through 1958 and 1960, Report of the geomagnetic and geoelectric observations, No. 8, 109–130, 1967, 1969. Klein, L. W. and Burlaga, L. F.: Interplanetary magnetic clouds at
1 AU, J. Geophys. Res., 87, 613–624, 1982.
Miyaoka, H., Hirasawa, T., Yumoto, K., and Tanaka, Y.: Low lat-itude aurorae on October 21, 1989. I, Proc. Jpn. Acad. (Ser. B) 66, 47–51, 1990.
Nakazawa, Y., Okada, T., and Shiokawa, K.: Understanding the “SEKKI” phenomena in Japanese historical literatures based on the modern science of low-latitude aurora, Earth Planets Space, 56, e41–e44, 2004.
Newton, H. W.: The Face of the Sun, Penguin Books Ltd, Har-mondsworth, Middlesex, 1958.
Plunkett, S. P., Thompson, B. J., St. Cyr, O. C., and Howard, R. A.: Solar source regions of coronal mass ejections and their geomag-netic effects, J. Atmos. Solar-Terr. Phys., 63, 389–402, 2001. Richardson, I. G., Cliver, E. W., and Cane, H. V.: Sources of
ge-omagnetic storms for solar minimum and maximum conditions during 1972–2000, Geophys. Res. Lett., 28, 2569–2572, 2001. Royal Greenwich Observatory: Sunspot and Geomagnetic-Storm
Data Derived from Greenwich Observations, 1874–1954, H. M. Stationery Office, London, 1955.
Saito, B., Kiyama, Y., and Takahasi, T.: Spectral characteristics of low-latitude auroras observed from Japan on February 11, 1958 and on May 10, 1992, J. Geomag. Geoelectr. 46, 253–262, 1994. Sheeley Jr., N. R., Harvey, J. W., and Feldman, W. C.: Coro-nal holes, solar wind streams, and recurrent geomagnetic distur-bances: 1973–1976, Solar Physics, 49, 271–278, 1976.
Shiokawa, K., Yumoto, K., Tanaka, Y., Oguti, T., and Kiyama, Y.: Low-latitude auroras observed at Moshiri and Rikubetsu (L=1.6) during magnetic storms on February 26, 27, 29, and May 10, 1992, J. Geomagn. Geoelectr., 46, 231–252, 1994.
Shiokawa, K., Yumoto, K., Tanaka, Y., Kiyama, Y., Kamide, Y., and Tokumaru, M.: A low-latitude aurora observed at Rikubetsu (L=1.6) during the magnetic storm of September 13, 1993, Proc. NIPR Symp. Upper Atmos. Phys., 8, 17–23, 1995.
Shiokawa, K., Ogawa, T., Oya, H., Rich, F. J., and Yumoto, K.: A stable auroral red arc observed over Japan after an interval of very weak solar wind, J. Geophys. Res., 106, 26 091–26 101, 2001.
Shiokawa, K., Ogawa, T., and Kamide, Y.: Low-latitude auroras observed in Japan: 1999–2004, J. Geophys Res., 110, A05202, doi:10.1029/2004JA010706, 2005.
with other great auroras, Adv. Space Res., in press, 2006. Srivastava, N.: Predicting the occurrence of super-storms, Ann.
Geophys., 23, 2989–2995, 2005,
http://www.ann-geophys.net/23/2989/2005/.
Srivastava, N. and Venkatakrishnan, P.: Solar and interplanetary sources of major geomagnetic storms during 1996–2002, J. Geo-phys. Res., 109, A10103, doi:10.1029/2003JA010175, 2004. Tsurutani, B. T. and Gonzalez, W. D.: The interplanetary causes
of magnetic storms: a review, in: Magnetic Storms, edited by: Tsurutani, B. T., Gonzalez, W. D., Kamide, Y., and Arballo, J. K., Geophysical Monograph 98, American Geophysical Union, Washington, D.C., USA, 77–89, 1997.
Vestine, E. H.: The geographic incidence of aurora and magnetic disturbance, northern hemisphere, Terr. Magn. Atmosph. Electr., 49, 77–102, 1944.
Vilmer, N., Pick, M., Schwenn, R., Ballatore, P., and Villain, J. P.: On the solar origin of interplanetary disturbances observed in the vicinity of the Earth, Ann. Geophys., 21, 847–862, 2003, http://www.ann-geophys.net/21/847/2003/.
Wang, Y. M., Ye, P. Z., Wang, S., Zhou, G. P., and Wang, J. X.: A statistical study on the geoeffectiveness of Earth-directed coronal mass ejections from March 1997 to December 2000, J. Geophys. Res., 107 (A11), 1340, doi:10.1029/2002JA009244, 2002. Webb, D. F., Cliver, E. W., Crooker, N. U., St. Cyr, O. C., and
Thompson, B. J.: Relationship of halo coronal mass ejections, magnetic clouds, and magnetic storms, J. Geophys. Res., 105, 7491–7508, 2000.
Webb, D. F., Crooker, N. U., Plunkett, S. P., and St. Cyr, O. C.: The solar sources of geoeffective structures, in: Space Weather, edited by: Song, P., Singer, H. J., and Siscoe, G. L., Geophysi-cal Monograph 125, American GeophysiGeophysi-cal Union, Washington, D.C., USA, 123–141, 2001.
Willis, D. M. and Stephenson, F. R.: Simultaneous auroral obser-vations described in the historical records of China, Japan and Korea from ancient times to AD 1700, Ann. Geophys., 18, 1–10, 2000,
http://www.ann-geophys.net/18/1/2000/.
Willis, D. M., Davda, V. N., and Stephenson, F. R.: Comparison between oriental and occidental sunspot observations, Q. J. R. Astron. Soc., 37, 189–229, 1996.
Willis, D. M., Armstrong, G. M., Ault, C. E., and Stephenson, F. R.: Identification of possible intense historical geomagnetic storms using combined sunspot and auroral observations from East Asia, Ann. Geophys., 23, 945–971, 2005,
http://www.ann-geophys.net/23/945/2005/.
Xie, H., Gopalswamy, N., Manoharan, P. K., Lara, A., Yashiro, S., and Lepri, S.: Long-lived geomagnetic storms and coronal mass ejections, J. Geophys. Res., 111, A01103, doi:10.1029/2005JA011287, 2006.