Science Reports
IODP Expedition 328: Early Results of Cascadia
Subduction Zone ACORK Observatory
by Earl Davis, Martin Heesemann, and the IODP Expedition 328
Scientists and Engineers
doi:10.2204/iodp.sd.13.02.2011Science Reports
Abstract
Integrated Ocean Drilling Program (IODP) Expedition 328 was devoted to the installation of an “Advanced CORK” (Circulation Obviation Retroit Kit) in the Cascadia subduc-tion zone accresubduc-tionary prism to observe the physical state and properties of the formation as they are inluenced by long-term and episodic deformation and by gas hydrate ac- cumulation. Pressures are monitored at four levels on the outside of a standard 10¾-inch casing string, two above and two below the base of the gas-hydrate stability zone at 230 mbsf (m below sealoor). The casing was sealed at the bottom, leaving the inside open down to 302 mbsf for instal-lation of a tilt meter, seismometer, and thermistor cable (scheduled for 2013). The initial data, recovered in July 2011, document an initially smooth recovery from the drill-ing perturbation followed by what may be a sequence of hole-collapse events. Pressure at the deepest screen is roughly 40 kPa above hydrostatic; higher pressures (80 kPa)
are observed at the two screens close to the level of hydrate stability. Tidal variations at the deepest screen are in phase with ocean tides, and deine a loading eficiency of 0.6, which is reasonable in light of the consolidation state of the for-mation (porosity ~0.5). Tidal signals near the level of gas hydrate stability display large phase lags, probably as a consequence of hydraulic diffusion stimulated by the large contrast in interstitial luid compressibility at the gas-hydrate boundary. The degree of isolation among the screens, the anticipated good coupling, and the estimated strain-to-pressure conversion eficiency (~5 kPa μstrain-1)
indicate that this installation will serve well to host a variety of hydrologic, seismic, and geodynamic experiments.
Introduction
Operations carried out during IODP Expedition 328 were devoted to the installation of a borehole hydrologic observa-tory near ODP Site 889, the location chosen for one of the irst CORK observatories during ODP Leg 146 in 1992
(Westbrook et al., 1994; Davis et al., 1995). In that early attempt, the relatively unstable sediments of the formation intruded rapidly through the perforations and bottom of an open-ended casing liner and prevented proper sealing of the hole. The new installa-tion utilized the ACORK design, developed initially for installations at the Nankai sub-duction zone during ODP Leg 196 to permit pressure monitoring at multiple formation levels on the outside of a 10¾-inch casing string. The casing is sealed at the bottom, leaving the inside fully isolated from the for-mation but available for future installations of additional monitoring instruments.
A broad range of objectives will be ad-dressed with monitoring over the decades to come, some the same as those to have been addressed by the original CORK installa-tion in Hole 889C including documenting the average state of pressure and constrain-ing the vertical component of luid low from the consolidating sediments in the frontal part of the Cascadia accretionary prism, and investigating the mode of formation of gas hydrates. Other objectives have been added
Science Reports
Science Reports
Science Reports
igneous crustal topography of the Juan de Fuca Ridge. At the accretionary prism toe (also referred to as the deformation front, where the seawardmost thrust fault of the accretionary complex intersects the sealoor), the sediments that bury the eastern Juan de Fuca Ridge lank are approximately 2.7 km thick. At Site U1364 the accreted sedimentary section is nearly doubled to a thickness of approximately 5 km (Yuan et al., 1994). With tectonic thickening and compaction, pore luids are expelled, and gas—primarily biogenic methane— is transported upward to contribute to the formation of gas hydrates in the upper few hundred meters of the sediment section (Davis et al., 1990; Hyndman and Davis, 1992; Haacke et al., 2007; Riedel et al., 2010).
The location for Site U1364 was chosen for the same rea-sons as Site 889. It lies at a position landward of the prism toe where the luid expulsion rate, estimated on the basis of the rates of compaction and vertical growth of the prism, reach-es a cross-margin maximum, and where a clearly developed bottom simulating relector marks the base of the gas hydrate stability ield (Davis et al., 1990). Other holes drilled earlier during ODP Leg 146 and IODP Expedition 311 (Westbrook et al., 1994; Riedel et al., 2010) have documented the nature of the incoming undeformed sediments, the com-paction history during accretion, the details of the lithology, and the distribution and composition of gas hydrates across the area. This information, along with detailed site survey studies (Scherwath et al., 2006; Riedel et al., 2010), provided an excellent basis for planning the depth, location, and other details of the ACORK installation at Site U1364 and estab-lished a valuable context for ACORK observations.
Instrumentation
Hole U1364A was drilled to a total depth of 336 mbsf through roughly 90 m of gently deformed slope-basin depos-its and underlying sediments of the accretionary prism that subsequently as a result of the multiple discrete monitoring
levels provided by the ACORK coniguration, advances in measurement resolution and sampling frequency, and knowledge gained from other monitoring experiments. These include determining the inluence of gas hydrates and free gas on the mechanical properties of their host lithology, the response of the formation to seismic ground motion, and the magnitude of strain at the site caused by any episodic seismic or aseismic slip in this subduction setting. Instrumentation deployed at the time of drilling includes autonomously recording sealoor and formation pressure and sealoor temperature sensors. Sensors planned for deployment inside the sealed casing at a later date will measure temperature, tilt, and seismic ground motion. In 2013, all instruments will be connected to the NEPTUNE Canada iber-optic cable for power and real-time communi-cations. This will provide a greater sampling rate, time accu-racy, and monitoring lifetime than what is possible with au-tonomous operations using battery power and local data storage.
Geologic Setting
As shown in Fig. 1, IODP Site U1364 lies 18 km landward of the toe of the Cascadia subduction zone accretionary prism, where much of the thick section of turbidite and hemi-pelagic sediments deposited on the eastern lank of the Juan de Fuca Ridge are scraped off the underthrusting oceanic crust (Davis and Hyndman, 1989; Hyndman et al., 1990; Westbrook et al., 1994). Convergence of the Juan de Fuca oceanic plate relative to the North American continental plate occurs in a direction roughly normal to the continental margin and at a rate of roughly 42 mm y-1 (DeMets et al.,
1990). A topographic trench at this subduction zone is absent as a consequence of the extremely high rate of glacial sedi-ment supply from the continent during the Pleistocene. The majority of the supply has been impounded by the elevated
Science Reports
are folded and faulted on a scale too small to be resolved in seismic relection proiles (Fig. 2). The coniguration of the ACORK, constructed around solid 10¾-inch casing and installed immediately after drilling, is shown schematically in Fig. 3b. Formation luid pressures are transmitted to sensors at the wellhead (inset Fig. 3a) via 2.03-m-long cir- cumferential sand-packed ilter screens and 3-mm-diameter (1/8-inch i.d.) stainless steel hydraulic tubing mounted on the outside of the casing. The solid casing is open at the sea-loor but sealed at the bottom with a bridge plug backed with cement, leaving the interior open to a depth of 302 mbsf for instruments requiring thermal or mechanical—but not direct—contact with the formation. Screens (numbered S1 to S4 from bottom to top) are positioned at depths of 304 mbsf, 244 mbsf, 203 mbsf, and 156 mbsf. The middle two pressure monitoring screens of the ACORK system (S2, S3) were positioned 14 m below and 27 m above the limit of gas hydrate stability at 230 mbsf to observe the effects of free gas and gas hydrate in the sediment matrix, and diffusive signals originating at the hydrate-gas boundary. The lowermost and uppermost screens (S1, S4) were placed 74 m below and above the boundary, a distance that was anticipated to be suf-icient to avoid hydrologic complications originating at the boundary.
Instrumentation installed with the ACORK included ive pressure sensors, four plumbed to be switchable between the formation screens and the ocean and the ifth plumbed permanently to the ocean, and a platinum thermometer sensing ocean temperature at the wellhead. Frequency out-put of the pressure sensors is measured with a low-power, high-precision (1 ppb) period counter. Data are stored in lash memory, and passed through to a communications port (i.e., to fiber-optic cable when connected). Under battery power, data are logged at one-minute intervals (program-mable); under cable power, data are recorded at one sample per second. An on-board voltage detector automatically switches between the two modes. Calibration among sen-sors was done at the sealoor during deployment before the screens entered the hole, and will be done periodically to check for sensor drift though the use of three-way valves that can close the formation lines and connect the formation sensors to the open ocean. Temperature at the wellhead is determined with a highly stable platinum thermometer inside the instrument pressure case, and with one of the pressure sensors that contains a temperature-sensitive quartz oscillator. Further details about the instrumentation, the ACORK hardware, and the geologic setting are provided in Davis et al. (2010).
Early Data
Connection of the instrumentation at Hole U1364A to the NEPTUNE Canada iber-optic cable system is planned for 2013; in the meantime, data are being logged autonomously using on-board battery power. The site was irst visited with the remotely operated vehicle ROPOS in 2011 July (dive
Science Reports
Figure 3. [A] The photograph of the reentry cone and ACORK wellhead (inset) was taken during the July NEPTUNE Canada servicing trip by the ROV ROPOS. The secondary cone seen lying on the seafloor to the left of the wellhead was intended to guide reentry into the casing for the bridge plug and cement installation, but it failed to land properly. Reentry was accomplished through the 24-inch diameter of the uppermost part of the ACORK structure. [B] Schematic illustration of the ACORK system installed in Hole U1364A, with component depths given in meters above and below seafloor (masf, mbsf).
"
A
a diffusive signal generated by the large contrast in luid and possibly matrix compressibilities at the gas/gas-hydrate boundary (Wang and Davis, 1996; Wang et al., 1998). Lack of a phase difference at screens S1 and S4 relative to the sea-loor loading suggests that they are suficiently far from the gas/gas-hydrate boundary for diffusive effects to be absent. The scale over which this is true depends on the period of the loading signal and the hydraulic diffusivity (permeabi-lity and storage compressibi(permeabi-lity) of the formation. A full analysis of the nature of loading will be done once high-sampling-rate data are available via the connection to the NEPTUNE Canada cable system, and an examination over a broad frequency band (e.g., ranging from microseis-mic to seasonal) is possible.
R1430) as part of a NEPTUNE Canada service cruise. The early portion of the downloaded record (with the full length of the ACORK assem-bly in the water column) is shown in Fig. 4. The 1-minute-interval data record of the deployment shows a highly aliased view of the effects of heave resulting from both depth variations and accelera-tion of the water in the hydraulic tubing. The latter produced sys-tematically increasing amplitudes from the uppermost to lowermost screens. Average values of the pressure difference between the various screens and the sealoor (SF) allow correc-tion for inaccuracy of the sensor calibracorrec-tions (see Fig. 4).
Pressures recorded during the ACORK entry and installation (Fig. 5) show growing offsets and modest overpressures as the screens enter the hole. Peak pressures exceeded those that would be produced by the drilling mud used to prevent pre-mature hole collapse (ρ=10.4 lb gal-1=1200 kg m-3)
by 50%–80%. This may be a result of charging of the formation by water and mud pumped during drilling and casing installation. Pressure varia-tions present during the early installation phase abated when the drill string was disconnected, and briely returned after reentry for the bridge plug and cement installations. The drop in pressure at the time of cementing at screen S2, and to a lesser extent at screen S3, may have been caused by the temporary cooling effects of circulating drill mud during that operation, possibly with free gas being driven into solution.
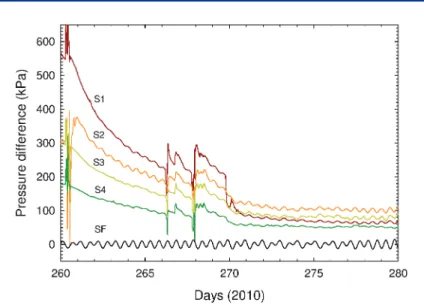
After completion of the installation, pressures began a relatively smooth decay for roughly one week, then showed multiple, generally sympathet-ic perturbations (tentatively inferred to be the con-sequence of hole collapse) before entering a period of relative stability (Fig. 6). Hydrologic isolation between adjacent screens and between screens and the sealoor is apparent from the attenuation of
the tidal load at the sealoor. Ratios of the formation to seaf-loor signal amplitudes, referred to as the tidal loading efici-ency, were roughly 0.7, 0.5, 0.6, and 0.9 at screens S1–S4, respectively, early in the recording period (Fig. 7), and decli-ned to roughly 0.6, 0.3, 0.4, and 0.7 by the end of the recor-ding period. The value for screen S1 at 304 mbsf is compa-rable to values observed elsewhere in sediments of equivalent porosity (~50%; Davis and Villinger, 2006; Davis et al., 2009)
The greater degree of attenuation and phase lag of the signal at screen S2 relative to the loading at the sealoor is indicative of free gas in the sediments below the level of gas hydrate stability. Attenuated amplitude would result from the high compressibility of gas-bearing water in the sedi-ment pore volume, and a change of phase would result from
Figure 5. Record of pressure variations (screen pressures relative to seafloor, seafloor pressure absolute) measured during the Site U1364 ACORK installation, annotated with operational events.
Science Reports
affect all hydraulic lines equally. Fortunately, towards the end of the initial 160-day recording period, pressures settled to levels similar to those prior to the irst major perturba-tions, although an elevated level of “noise” persists, most notably at the upper two screens. Highest average pressures are present at the two screens immediately above and below the base of the gas-hydrate stability ield, and lowest at the uppermost screen.
On 21 February (day 417 on plot), the sealoor pressure sensor suffered a failure possibly caused by crevice corro-sion penetrating beneath the O-ring seal of its electrical con-nector. Excess current to the sealoor sensor was detected by the instrument, current was limited, and the problem was lagged in the stored data, but after roughly thirty minutes the leakage produced a short circuit, leav-ing all channels dysfunctional. On 24 July (ROPOS
dive R1452) the cable to the faulty sensor was cut, which restored the system functionality. A brief interval of on-site logging showed the remaining sensors to be fully opera-tional and the formation pressure state to be similar to that seen in February.
Temperatures were measured throughout the history of the recording period with the temperature-dependent oscillator in the sealoor pressure sensor and with the platinum thermo- meter (Fig. 8b). Absolute accuracy is limited to a few tenths of a degree Celsius; calibration will be improved by comparing values to an accurately calibrated conductivity-temperature-depth (CTD) sensor during the next ROPOS visit. Precision of both sensors is much better than the accuracy; variations in the two records follow one another within a few milliKelvin. Small differences are pri-marily the consequence of the thermal time con-stant of the pressure sensor being longer than that of the platinum thermometer. Temporal variations are seen from diurnal to seasonal periods.
Summary and Discussion
Data from the irst ive months of sealoor and formation pressure recording at Hole U1364A at the toe of the Cascadia subduction zone accre- tionary prism have demonstrated that the IODP ACORK multi-level hydrologic monitoring system will provide well isolated hydrologic observations in the sedimentary formation via hole closure around external casing screens at relatively shallow levels (~300 mbsf). However, persistent noise, par-ticularly at the uppermost screen (156 mbsf), sug-gests variable leakage in the annulus outside the casing. Borehole temperature monitoring, plan- ned with other instrument installations inside the casing in 2013, will provide a sensitive test for any long-term or episodic vertical low.
The full history (Fig. 8a) reveals complexities that are currently not understood. During the irst eighty days of the recording period, pressures varied over days to weeks. Variations are largest at the uppermost screen (S4) and smallest at the lowermost (S1), and variations at the lower three screens mirror those at the uppermost. Thermal per-turbations that might be caused by vertical low in the annu-lus outside the casing (warm water transported up, cool solids down) could produce this difference (i.e., with sedi-ment settling into the lower part of the hole causing cooling and a temporary decline in pressure arising from thermal contraction of the luid in the screens and hydraulic tubing, and expelled water warming the uppermost interval), although any heating above the uppermost screen would
Science Reports
Figure 7. Three-day record of absolute seafloor and screen pressures, showing the dominant tidal component of variation. Differences in amplitudes and phases of pressure variations in the formation relative to pressure at the seafloor are discussed in the text. Lines at times of seafloor tidal peaks highlight the large phase lag of the signal at screen S2.
personnel and the crew on D/V JOIDES Resolution, led by Mitch Malone, Bill Rhinehart, and Bob Aduddell. Michael Riedel provided invaluable information about local seismic and lithologic structure. Zest was added to the short cruise by the energetic leaders and participants of the IODP School of Rock. Data downloading operations and remediation of the problem created by the sealoor pressure sensor failure were carried out by the crew of the remotely operated vehicle
ROPOS, led by Keith Shepherd and assisted by Martin Scherwath and Reece Hasanen of NEPTUNE Canada. Support for the design and construction of the wellhead instrumentation prior to the expedition was provided by Robert Macdonald, Robert Meldrum, James Guenther, John Bennest, Jonathan Schmidt, and David Miles. Pressure sen-sors, sensor frequency counters, and the NEPTUNE-compatible data logger were provided by Paroscientiic Inc., Bennest Enterprises Ltd., and Minerva Technologies Ltd., respectively.
Formation pressures measured at the moni-toring screens range from 40 kPa to 80 kPa above hydrostatic. These are signiicant but not high, i.e., a small fraction of the lithostatic potential at the deepest screen of roughly 2 MPa. High pres-sures are not expected at this relatively shallow level in the prism, given the relatively high forma-tion permeability and the long time that has elapsed (~300 years) since the last large subduction earth-quake when large contractional strain may have been produced in the outermost part of the prism. Highest pressures are observed at the screens immediately above and below the level of gas hydrate stability (marked both at this location and regionally by a clear bottom simulating seismic relector). This may be a consequence of ongoing gas production.
While information about dynamic response to sealoor loading over a broad range of frequencies will not be available until the instrumentation is connected to the NEPTUNE Canada power and communications cable, variations in the amplitude and phase of loading at tidal frequencies provide some preliminary insights. There is a general decline in the tidal amplitude at all screens with time, suggesting a progressive increase in the degree of closure of the formation around the casing with time. At the deepest screen, formation pressure variations are in phase with the sealoor load throughout the record, demonstrating that there is no signiicant hydrologic diffusion or leakage at this level. The tidal loading eficiency (formation/sealoor = 0.6 late in the record) is con-sistent with observations in other sedimentary sec-tions with similar porosity, and suggests that the formation is suficiently rigid for volumetric strain to be detected with pressure (i.e., with a conversion eficiency of roughly 5 kPa µstrain-1; Davis et al.,
2009).
The tidal signal at the screen just below the hydrate stability boundary (S2) is anomalously low in amplitude (formation/sealoor = ~0.3 late in the record) and lags the sealoor load by roughly two hours. The low amplitude is probably the consequence of the high compressibility of interstitial free gas, and the large phase lag is likely the consequence of a diffusive signal propagating from the gas/gas-hydrate boundary, where there may be a sharp contrast in both matrix and interstitial luid compressibili-ties.
Acknowledgments
Installation of the CORK observatory at Hole U1364A seemed like a routine operation as a result of the skilled help of IODP shipboard technical, operations, and engineering
Science Reports
The IODP Expedition 328 Scientists and
School of Rock Educators
E. Davis, M. Malone, M. Heesemann, M. Riedel, D. Divins, J. Collins, K. Ludwig, S. Hovan, M. Reagan, and S. Slough
References
Davis, E., Becker, K., Wang, K., and Kinoshita, M., 2009. Co-seismic and post-seismic pore-luid pressure changes in the Philippine Sea plate and Nankai decollement in response to a seismogenic strain event off Kii Peninsula, Japan. Earth Planets Space, 61:649–657.
Davis, E.E., and Hyndman, R.D., 1989. Accretion and recent deforma-tion of sediments along the Cascadia subducdeforma-tion zone.
Geol. Soc. Am. Bull., 101:1465–1480. doi:10.1130/0016-7606 (1989)101%3C1465:A ARDOS%3E2.3.CO;2
Davis, E.E., and Villinger, H., 2006. Transient formation luid pres-sures and temperatures in the Costa Rica forearc prism and subducting oceanic basement: CORK monitoring at ODP sites 1253 and 1255. Earth Planet. Sci. Lett., 245:232–244. Davis, E.E., Becker, K., Wang, K., and Carson, B., 1995. Long-term
observations of pressure and temperature in Hole 892B, Cascadia accretionary prism. In Carson, B., Westbrook, G.K., Musgrave, R.J., and Suess, E. (Eds.), Proc. ODP, Sci. Results, 146 (Pt. 1): College Station, TX (Ocean Drilling Program), 299–311. doi:10.2973/odp.proc.sr.146-1.219.1995 Davis, E.E., Hyndman, R.D., and Villinger, H., 1990. Rates of luid
expulsion across the northern Cascadia accretionary prism: Constraints from new heat low and multichannel seismic relection data. J. Geophys. Res., 95:8869–8889. doi:10.1029/ JB095iB06p08869
Davis, E.E., Malone, M.J., and the Expedition 328 Scientists and Engineers, 2010. Integrated Ocean Drilling Program Expedition 328 Preliminary Report: Cascadia subduction zone ACORK observatory. IODP Prel. Rept., 328. doi:10.2204/iodp.pr.328.2010
DeMets, C., Gordon, R.G., Argus, D.F., and Stein, S., 1990. Current plate motions. Geophys. J. Int., 101:425–478. doi:10.1111/ j.1365-246X.1990.tb06579.x
Haacke, R.R., Westbrook, G.K., and Hyndman, R.D., 2007. Gas hydrate, luid low and free gas: Formation of the bottom-simulating relector. Earth Planet. Sci. Lett., 261:407–420. doi:10.1016/j.epsl.2007.07.008
Hyndman, R.D., and Davis, E.E., 1992. A mechanism for the forma-tion of methane hydrate and sealoor bottom-simulating relectors by vertical luid expulsion. J. Geophys. Res., 97:7025–7041. doi:10.1029/91JB03061
Hyndman, R.D., Yorath, C.J., Clowes, R.M., and Davis, E.E., 1990. The northern Cascadia subduction zone at Vancouver Island: Seismic structure and tectonic history. Can. J. Earth Sci., 27:313–319. doi:10.1139/e90-030
Riedel, M., Collett, T.S., and Malone, M., 2010. Expedition 311 synthe-sis: Scientiic indings. In Riedel, M., Collett, T.S., Malone, M.J., and the Expedition 311 Scientists, Proc. IODP, 311: Washington, DC (Integrated Ocean Drilling Program
Management International, Inc.). doi:10.2204/iodp.proc. 311.213.2010
Scherwath, M., Riedel, M., Spence, G.D., and Hyndman, R.D., 2006. Data report: Seismic structure beneath the north Cascadia drilling transect of IODP Expedition 311. In Riedel, M., Collett, T.S., Malone, M.J., and the Expedition 311 Scientists, Proc. IODP, 311: Washington, DC (Integrated Ocean Drilling Program Management International, Inc.). doi:10.2204/iodp.proc.311.110.2006
Wang, K., and Davis, E.E., 1996. Theory for the propagation of tidally induced pore pressure variations in layered subsealoor for-mations. J. Geophys. Res., 101:11483–11495. doi:10.1029/ 96JB00641
Wang, K., Davis, E.E., and van der Kamp, G., 1998. Theory for the effects of free gas in subsea formations on tidal pore pres-sure variations and sealoor displacements. J. Geophys. Res., 103:12339–12354. doi:10.1029/98JB00952
Westbrook, G.K., Carson, B., Musgrave, R.J., et al., 1994. Proc. ODP, Init. Repts., 146 (Pt. 1): College Station, TX (Ocean Drilling Program). doi:10.2973/odp.proc.ir.146-1.1994
Yuan, T., Spence, G.D., and Hyndman, R.D., 1994. Seismic velocities and inferred porosities in the accretionary wedge sedi-ments at the Cascadia margin. J. Geophys. Res., 99:4413–4427. doi:10.1029/93JB03203
Authors
Earl Davis, Pacific Geoscience Centre, Geological Survey
of Canada, 9860 West Saanich Road, Sidney, BC V8L 4B2, Canada, e-mail: [email protected].
Martin Heesemann, NEPTUNE-Canada, University of
Victoria, P.O. Box 1700 Stn CSC, Victoria, BC V8W 2Y2, Canada, e-mail: [email protected].
![Figure 1. [A] Regional map of East Pacific near Vancouver Island and [B] topographic/](https://thumb-eu.123doks.com/thumbv2/123dok_br/16466872.198731/1.892.65.547.686.1060/figure-regional-east-pacific-near-vancouver-island-topographic.webp)

![Figure 3. [A] The photograph of the reentry cone and ACORK wellhead (inset) was taken during the July NEPTUNE Canada servicing trip by the ROV ROPOS](https://thumb-eu.123doks.com/thumbv2/123dok_br/16466872.198731/3.892.68.425.108.1002/figure-photograph-reentry-acork-wellhead-neptune-canada-servicing.webp)

![Figure 8. Full history of [A] seafloor (tides filtered) and relative formation pressures and [B] seafloor temperature observed prior to failure of the seafloor pressure sensor on 21 February 2011 (day 417)](https://thumb-eu.123doks.com/thumbv2/123dok_br/16466872.198731/6.892.396.824.100.684/seafloor-filtered-relative-formation-pressures-temperature-pressure-february.webp)
