Biomarker for Parkinson’s Disease
Jose A. Santiago1, Clemens R. Scherzer2, Judith A. Potashkin1*
1The Cellular and Molecular Pharmacology Department, The Chicago Medical School, Rosalind Franklin University of Medicine and Science, North Chicago, Illinois, United States of America,2The Neurogenomics Laboratory, Harvard Medical School and Brigham and Women’s Hospital, Cambridge, Massachusetts, United States of America
Abstract
Increasing evidence indicates that Parkinson’s disease (PD) and type 2 diabetes (T2DM) share dysregulated molecular networks. We identified 84 genes shared between PD and T2DM from curated disease-gene databases. Nitric oxide biosynthesis, lipid and carbohydrate metabolism, insulin secretion and inflammation were identified as common dysregulated pathways. A network prioritization approach was implemented to rank genes according to their distance to seed genes and their involvement in common biological pathways. Quantitative polymerase chain reaction assays revealed that a highly ranked gene, superoxide dismutase 2 (SOD2), is upregulated in PD patients compared to healthy controls in 192 whole blood samples from two independent clinical trials, the Harvard Biomarker Study (HBS) and the Diagnostic and Prognostic Biomarkers in Parkinson’s disease (PROBE). The results from this study reinforce the idea that shared molecular networks between PD and T2DM provides an additional source of biologically meaningful biomarkers. Evaluation of this biomarker inde novoPD patients and in a larger prospective longitudinal study is warranted.
Citation:Santiago JA, Scherzer CR, Potashkin JA (2014) Network Analysis IdentifiesSOD2mRNA as a Potential Biomarker for Parkinson’s Disease. PLoS ONE 9(10): e109042. doi:10.1371/journal.pone.0109042
Editor:Peter Csermely, Semmelweis University, Hungary
ReceivedJune 3, 2014;AcceptedSeptember 5, 2014;PublishedOctober 3, 2014
Copyright:ß2014 Santiago et al. This is an open-access article distributed under the terms of the Creative Commons Attribution License, which permits unrestricted use, distribution, and reproduction in any medium, provided the original author and source are credited.
Data Availability:The authors confirm that all data underlying the findings are fully available without restriction. All relevant data are within the paper and its Supporting Information files.
Funding:This study was funded by the U.S. Army Medical Research and Materiel Command under award numbers W81XWH-09-0708 and W81XWH13-1-0025 to J.A.P. C.R.S. is funded by National Institutes of Health (NIH) grants R01 NS064155, R01 AG044113, U01 NS082157, U01 AT000613, P01 NS058793, the Harvard NeuroDiscovery Center, the Michael J. Fox Foundation, and the M.E.M.O. Hoffman Foundation. The Harvard Biomarker Study is supported by the Harvard NeuroDiscovery Center (HNDC), the Parkinson’s Disease Biomarkers Program (PDBP) grant U01 NS082157 of the National Institute of Neurological Disorders and Stroke (NINDS), and the Massachusetts Alzheimer’s Disease Research Center (ADRC) P50 AG005134 grant of the National Institute on Aging. C.R.S. has collaborated with DiaGenic, Pfizer, Opko, and Proteome Sciences. Opinions, conclusions, interpretations and recommendations are those of the authors and are not necessarily endorsed by the U.S. Army. The funders had no role in study design, data collection and analysis, decision to publish, or preparation of the manuscript.
Competing Interests:C.R.S. has collaborated with DiaGenic, Pfizer, Opko, and Proteome Sciences. This does not alter the authors’ adherence to PLOS ONE policies on sharing data and materials.
* Email: [email protected]
Introduction
Accumulating epidemiological evidence suggests a risk of PD among patients with T2DM [1–3], reviewed in [4,5]. However, there remains conflict among some studies. For example, several groups suggest an inverse association between PD and T2DM [6,7] and other studies have not found a significant association [8,9]. Despite this discrepancy, T2DM is associated with more severe symptoms in PD. T2DM contributes to postural instability and gait difficulty in PD [10] and insulin resistance is associated with an increased risk of dementia in PD [11]. Besides insulin resistance, dysregulation in other shared biological pathways including mitochondrial dysfunction, endoplasmic reticulum (ER) stress and inflammation may be a plausible explanation for the coexistence of both aging diseases [4,12].
Both PD and T2DM are considered idiopathic diseases in which a combination of genetic and environmental factors are likely to be involved in the disease pathogenesis. In fact, genetic risk factors identified by genome-wide association studies (GWAS) accounts for approximately 5–10% of the PD and T2DM cases [4,5]. Several system-biology approaches including animal models and network analysis have been used to understand the molecular
mechanisms underlying the linkage between PD and T2DM [5,13,14]. For example, diabetic mice treated with 1-methyl-4-phenyl-1,2,3,6-tetrahydropyridine (MPTP) displayed an exacer-bated neurodegeneration accompanied by inflammation and ER-stress [13]. In parallel, an integrative network-based approach restricted to data from only GWAS was used to investigate the potential molecular framework linking PD and T2DM and to identify potential biomarkers with clinical applicability. Results from these studies identified the amyloid precursor protein (APP) mRNA as a biomarker for PD [15]. Similarly, a network approach identifiedPTPN1mRNA as a diagnostic biomarker in progressive supranuclear palsy, an atypical parkinsonian disorder sometimes misdiagnosed as PD [16].
disease associations identified through studies that tested environ-mental factors such as toxin. Our systematic network approach is illustrated in Figure 1. Briefly, genes shared between PD and T2DM were collected from several databases and mapped into the human functional linkage network (FLN). We implemented a random walk algorithm with restart (RWR) to rank the group of genes shared between PD and T2DM. We further evaluated the applicability of the network prioritization approach by testing the most highly ranked gene as a potential diagnostic biomarker for PD. In this study we identifySOD2mRNA as a potential blood biomarker that can be used to identify patients with PD.
Methods
Database mining and network analysis
We queried the DisGeNET database [17] that integrates information from four respositories: Online Medelian Inheritance in Man (OMIM), UniProt/SwissProte (UNIPROT), Pharmaco-genomics Knowledge Base (PHARMGKB), and Comparative Toxicogenomics Database (CTD). DisGeNET can be accessed through the Cytoscape 2.8.3, a platform for complex network analysis [18]. Search disease terms used in DisGeNET were the following: Parkinson Disease (umls:C0030567), Diabetes Mellitus,
Type 2 (umls:C0011860). Disease-gene networks were retrieved for PD and T2DM independently. Using the advanced network merge option in Cytoscape, both PD and T2DM gene networks were merged using gene ID as a matching attribute. Only shared genes between both diseases were collected for further analysis.
The Disease and Gene Annotations database (DGA) [19] was accessed through the web (http://dga.nubic.northwestern.edu/ pages/search.php). We searched for gene annotations shared between PD and T2DM. Search disease terms in DGA were the following: Parkinson’s disease, type 2 diabetes mellitus. Similarly, we explored Human Experimental/Functional Mapper (HE-FalMp) using the web-interface (http://hefalmp.princeton.edu/) to investigate genetic associations between PD and T2DM [20]. Search disease terms used in HEFalMp were: Parkinson disease, Diabetes Mellitus. A significance score of 1025was used as a cut-off value for inclusion in the list of candidate genes. The Integrated Complex Traits Networks interface (iCTNet), can be accessed through the Cytoscape plugin [21]. This database allows the automated construction of disease networks and integrates phenotype-SNP, protein-protein interaction, disease-tissue, tissue-gene and drug-tissue-gene interactions. Search disease terms were: Parkinson’s disease, Diabetes Mellitus. We queried the disease-gene networks associated with PD and T2DM using a cutoff
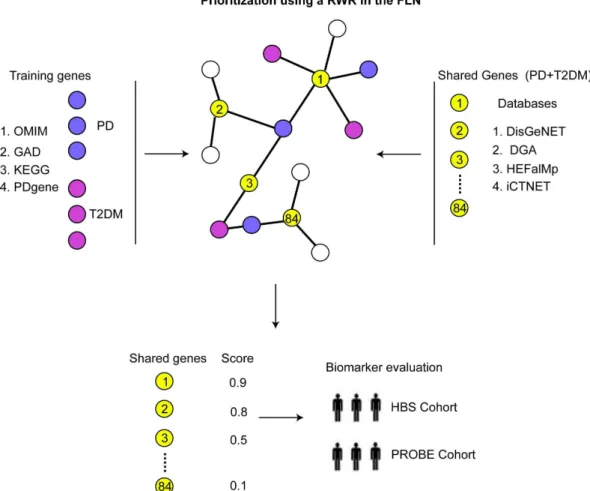
p-Figure 1. Integrative network approach.Well-characterized genes associated with PD (purple circles) and T2DM (magenta circles) were mapped to the FLN and specified as training set. Shared genes between PD and T2DM (yellow circles) were collected from multiple databases and mapped to the human FLN (black). A random walk algorithm with restart (RWR) was implemented to prioritize the list of shared genes between PD and T2DM according to their distance to known disease genes and in terms of biological pathways involved. A highly ranked gene was evaluated as diagnostic biomarker for PD on RNA samples from whole blood obtained from two independent clinical trials.
value of 10-5. Unlike DisGeNET, disease-gene networks are merged automatically in iCTNet. Like in previous steps, only shared genes between PD and T2DM were collected for further analysis. A total of 84 genes shared between PD and T2DM were
collected from the aforementioned databases. Genetic associations were manually curated after searching the literature in Pubmed. Functional and gene ontology analysis was performed using GENEMANIA plugin in Cytoscape [22]. In GENEMANIA, we Figure 2. Biological functional analysis of candidate genes.Network of interactions among PD and T2DM shared genes, as retrieved by GeneMANIA. Shared genes between PD and T2DM are displayed in yellow circles and other genes with the greatest number of interactions with shared genes are displayed in gray circles. The size of the gray nodes represents the degree of association with the input genes (i.e., smaller size represents low connectivity). The most represented pathways retrieved by GeneMANIA are displayed using GO annotations and Q-values of significance.
used the default settings of 20, which are the genes that have the greatest number of interactions, and advanced settings to include physical, predicted, and genetic interactions, and interconnected pathways.
Gene prioritization methods and cross-validation analysis
The list of 84 genes shared between PD and T2DM collected from the databases was used for subsequent analysis using GPEC, a Cytoscape 2.8.3 plugin that performs a RWR algorithm [23]. We used the default, weighted and undirected human FLN for this analysis that contains 14,230 nodes and 263,884 links. Nodes represent genes and each link represents the likelihood that the connected genes participate in common biological processes. In order to perform the gene prioritization in GPEC, we first collected a list of well-characterized genes associated with PD and T2DM and genes involved in the PD and T2DM KEGG pathways (Table S2). Well-characterized genes known to be associated with PD and T2DM were retrieved from the OMIM (http://www.ncbi.nlm.nih.gov/omim), the Genetic association database (GAD) (http://geneticassociationdb.nih.gov/) and PDgene (http://www.pdgene.org/) (Table S2). Genes involved in the PD and T2DM signaling pathways were retrieved from the KEGG database (http://www.genome.jp/kegg/pathway.html). As a first step in the prioritization, the list of well-characterized genes associated with PD and the PD KEGG pathway was used as a training set. The test set included the 84 genes shared between both diseases and genes associated with T2DM and its associated KEGG pathway. The training set was manually curated to ensure that there was no overlap with any of the genes contained in the test set. To perform the RWR, we set back-probability to 0.5 and candidate genes were scored and ranked. As a second step, we performed a series of prioritization steps with respect to the most
significant biological pathways retrieved by GENEMANIA. These prioritization steps were performed for each individual pathway independently. To this end, we collected the set of genes curated for each biological pathway from the Broad Institute’s Molecular Signatures Database (MSigDB) 3.0 [24] (Table S2). Here, the training set consisted of genes curated for each pathway and the test set consisted of the 84 genes shared between PD and T2DM. In GPEC, we evaluated the performance of each prioritization with a leave-one-out cross-validation (LOOCV) strategy where the number of training genes is equal to the number of cross-validation trials and one of the genes in the test set is held out during each trial. As a result, a ROC curve of sensitivity versus 1-specificity is built by the software. Since all the scores were determined by the RWR algorithm, the final score for each gene was defined as the sum of all individual scores obtained from each prioritization as previously demonstrated using similar analyses [15,16,25]. The overall workflow is presented in Figure 1.
Information about HBS and PROBE study participants
The Institutional Review Boards of Rosalind Franklin Univer-sity of Medicine and Science approved the study protocol. Written informed consent was received from all participants. We used 96 individuals including 50 PD patients (31 men, 19 women; Hoehn and Yahr scale 1.9760.62; mean age at enrollment 63.1268.96; mean age at onset 58.75610.17) and 46 healthy age-matched controls (HC) (26 men, 20 women; mean age at enrollment 64.28610.42) enrolled in the HBS. Other clinical information is reported in [15]. There were 5 PD and 5 HC patients with T2DM. Details of patient and controls recruitment, clinical assessments, and biobanking in the HBS study population have been reported in part elsewhere [26] and http://www. neurodiscovery.harvard.edu/research/biomarkers.html. As an
in-Table 1.Highly ranked RWR score-based genes.
Rank Gene Symbol Gene Name Score
1 SOD2 Superoxide dismutase 2 3.08E-03
2 MT-ND1 Mitochondrially encoded NADH dehydrogenase 1 2.93E-03
3 IFNG Interferon, gamma 2.90E-03
4 TNF Tumor necrosis factor 2.39E-03
5 TP53 Tumor protein p53 2.36E-03
6 IL6 Interleukin 6 2.16E-03
7 AKT1 V-akt murine thymoma viral oncogene homolog 1 1.96E-03
8 HNF4A Hepatocyte nuclear factor 4, alpha 1.80E-03
9 HMOX1 Heme oxygenase (decycling) 1 1.77E-03
10 FAS Fas (TNF receptor superfamily, member 6) 1.53E-03
11 APP Amyloid beta (A4) precursor protein 1.34E-03
12 CYP17A1 Cytochrome P450, family 17, subfamily A, polypeptide 1 1.23E-03
13 IGF1 Insulin-like growth factor 1 1.03E-03
14 PTGS2 Prostaglandin-endoperoxide synthase 2 1.02E-03
15 SOD1 Superoxide dismutase 1, soluble 9.80E-04
16 BDNF Brain-derived neurotrophic factor 8.46E-04
17 NOS2 Nitric oxide synthase 2 8.34E-04
18 TGM2 Transglutaminase 2 6.86E-04
19 GCH1 GTP cyclohydrolase 1 6.66E-04
20 UCHL1 Ubiquitin carboxyl-terminal esterase L1 6.60E-04
dependent replication set, we used 51 PD patients (29 men, 22 women; mean age at enrollment 63.1666.42; Hoehn and Yahr scale 260.28) and 45 HC (24 male, 21 women; mean age at enrollment 65.1268.60) enrolled in the PROBE Study
(#NCT00653783). There was one HC patient with T2DM. Clinical diagnosis of PD was based on the United Kingdom Parkinson’s Disease Society Brain Bank criteria. Healthy controls had no history of neurological disease and a Mini-Mental State Examination (MMSE) test score higher than 27. Inclusion and exclusion criteria for patients enrolled in the PROBE study are reported elsewhere in [27].
RNA isolation and real time polymerase chain reactions
Blood was collected and prepared as described using the PAXgene Blood RNA system (Qiagen,Valencia, CA, USA)[28]. Samples with RNA integrity values.7.0 and ratio of absorbances at 260/280 nm between 1.7 and 2.4 were used in the current study. Primer Express software (Life Technologies, Carlsbad, CA, USA) was used to design the primers. The High Capacity RNA transcription kit (Life Technologies, Carlsbad, CA, USA) was used to reverse transcribe 1mg of total RNA according to the manufacturer’s protocol. The DNA engine Opticon 2 Analyzer (Bio-Rad Life Sciences, Hercules, CA, USA) was used for the qPCR reactions. Each 25ml reaction contained Power SYBR (Life Technologies, Carlsbad, CA, USA) and primers at a concentration of 5mM. Primer sequences used in qPCR assays are as follows: GAPDH; forward: 59- CAACGGATTTGGTCGTATTGG-39; reverse: 59- TGATGGCAACAATATCCACTTTACC-39, SOD2; forward: 59- GTTCAATGGTGGTGGTCATATCA-39; reverse: 59- GCAACTCCCCTTTGGGTTCT-39. Amplification conditions and detailed description of qPCR experiments is described in [15].
Statistical analysis
All analyses were performed with Prism4.0 (GraphPad, La Jolla, CA, USA) and Statistica 8.0 (Statsoft, OK, Tulsa, USA). A student t-test (two-tailed) was used to estimate the significance between PD cases and controls for numerical variables. Linear regression and Pearson correlation analysis was used to determine statistical significance for the prospective biomarker adjusting for sex, age, Hoehn & Yahr scale in both cohorts of patients and body mass index (BMI) in the HBS study. A ROC curve analysis was used to evaluate the diagnostic accuracy. A p-value less than 0.05 was regarded statistically significant.
Results
Identification of shared genes between PD and T2DM from disease-gene databases
We explored the DisGeNET database, a comprehensive database of the human genetic associations related to disease [17]. In DISGENET, the central node represents the disease and the nodes linked to the central node represent genes that have been associated to the queried disease. We queried the disease-gene networks associated with both PD and T2DM. Analysis of the merged network revealed a cluster consisting of 53 shared genes between PD and T2DM (Table S1, Methods).
We next explored the DGA interface [19] and found 42 overlapping genes with the gene set collected in DisGeNET and 8 additional genes shared between PD and T2DM (Table S1). We next interrogated the HEFalMp interface [20]. Similarly to DGA and DisGeNET, we collected the shared genes between PD and T2DM. The most significant genes in T2DM associated to PD wereHNF4A, PDX1, SLC2A4, and ABCC8 (Q,10205)(Table S1). Finally, we interrogated the iCTNet interface [21] that contains results from 118 GWAS published studies and data from the GWAS catalog. In iCTNet, we found 20 genes shared between both diseases (Table S1). A total of 84 genes shared between PD Figure 3. Evaluation ofSOD2as a potential biomarker for PD.
A.Relative abundance ofSOD2mRNA in blood of PD patients (black circles) compared to healthy controls (white circles) in samples from the HBS cohort.B.Replication of biomarker expression in an independent set of samples from patients enrolled in the PROBE study. Relative abundance of each biomarker was calculated using GAPDH as a
reference gene and healthy controls as calibrator. Error bars represent standard error. C. ROC curve analysis to evaluate the diagnostic accuracy ofSOD2.
and T2DM were collected from the aforementioned databases and used for further analysis.
To further identify the potential functional implications in the cluster of genes shared between PD and T2DM, we imported all 84 genes into GeneMANIA [22]. Analysis of the 84 shared genes identified the most overrepresented pathways including nitric oxide biosynthetic processing, carbohydrate and lipid metabolic processing, insulin secretion, regulation of glucose, and inflamma-tion (Figure 2).
Gene prioritization and experimental validation
Given the numerous molecular links between PD and T2DM, we investigated the extent to which genes identified as shared between PD and T2DM can be used to classify patients with PD. This idea is particularly salient in light of the recent finding that revealed that genes identified in shared molecular networks between PD and T2DM may improve the clinical diagnosis of PD. Accordingly, APP was identified in a functional network shared between well-characterized genes associated with PD and T2DM. APP mRNA was capable to distinguish PD patients from HC with 80% accuracy [15], a diagnostic capacity that extends beyond the one afforded by the current clinical diagnostic criteria [29,30].
We implemented a candidate prioritization approach using a RWR algorithm within the human the FLN described previously [15,16,25,31]. This algorithm measures the closeness of potentially candidate genes to confirmed genes within the FLN or protein-protein interaction network. We used GPEC, a cytoscape plugin for RWR-based gene prioritization [23] to rank 84 candidates collected from the curated databases (Table S1). In the RWR algorithm, the known disease genes are mapped to the FLN and specified as ‘‘training set’’ and the ‘‘test set’’ containing potential candidates can be ranked according to their closeness to the training genes within the FLN (See Methods). The training set consisted of well-characterized genes associated with PD and its KEGG associated pathway. The test set included the list of 84 shared genes and well-characterized genes associated with T2DM and its KEGG associated pathway. RWR score-based genes are listed in Table S3. Further, we evaluated the performance of the gene prioritization using a LOOCV strategy (see Methods). LOOCV represented in terms of receiver operating characteristic curve (ROC) resulted in an area under curve AUCPD-T2DMvalue of 0.85 (Figure S1A).
As a second step, we prioritized the list of 84 shared genes with respect to the most significant biological pathways determined by GeneMania (see Methods). We collected the set of genes curated for each biological pathway from the Broad Institute’s Molecular Signatures Database 3.0 (MSigDB) [24] (Table S2). These gene sets were used as training sets during each prioritization. Gene prioritization was performed in GPEC for each individual pathway independently (Methods, Table S3). LOOCV performed for each prioritization resulted in AUC values ranging from 0.90– 0.99 (Figure S1B-E). The top RWR score-based genes are listed in Table 1. The complete list of RWR score-based candidate genes according to each prioritization step is provided in (Table S3).
In order to validate the results obtained from the network analysis we evaluated the most highly ranked gene, SOD2, as a potential biomarker for PD. Relative abundance ofSOD2mRNA was measured in whole blood of PD patients compared to HC from samples obtained from two independent clinical trials, HBS and PROBE. Quantitative PCR assays revealed that SOD2 mRNA is significantly upregulated in blood of PD patients compared to HC in both cohorts of study participants, although significant overlap in expression levels was observed between PD
and controls (Figure 3A and B). To evaluate the diagnostic accuracy ofSOD2in distinguishing PD patients from HC, ROC curve analysis was performed. As shown in Figure 3C, the AUC values forSOD2was 0.69.
Pearson correlation analysis demonstrated that relative abun-dance ofSOD2was independent of other covariates including age (r =20.13, p = 0.40), and sex (r =20.03, p = 0.79) in both cohorts of patients and BMI (r = 0.18, p = 0.21) in the HBS cohort. Correlation analysis ofSOD2mRNA expression and Hoehn and Yahr stage was not significant (r = 0.04, p = 0.73). Correlation with medication was not determined since most of the patients with PD were medicated with several drugs and the number of untreated patients was too small to reliably detect a significant change.
Discussion
We have recently demonstrated that shared molecular networks between PD and T2DM can be exploited to identify highly accurate biomarkers for PD [15]. This result along with other studies investigating the relationship between PD and T2DM suggested that a system-level understanding of the comorbidity between both diseases might improve the clinical management of PD and may elucidate potential therapeutic targets [5,13].
In our previous study the network analysis was restricted to the intersection of genes between PD and T2DM identified by GWAS. However, this approach is limited given that a large number of genes fail to exceed the genome-wide statistical threshold of significance and are therefore neglected. One example was the failure to recognize the association of a polymorphism in PPARG in T2DM by other studies because of its modest effect on susceptibility for T2DM [34]. In addition, very few causative genes of disease have been proven to be useful for clinical diagnosis [35]. For example, mutations inLRRK2and DJ-1are implicated in hereditary PD, but changes in their mRNA or protein expression levels in blood may not be useful diagnostic biomarkers for early stage PD [36,37]. Here we expanded our analysis to integrate data from publicly available databases that includes a wide range of experimental designs including but not limited to pharmacogenomics, toxicogenomics, and other exper-iments in addition to GWAS.
We further evaluated a highly ranked gene,SOD2in blood of patients with PD from two independent cohorts of study participants. Relative abundance of SOD2 was upregulated in blood of PD patients compared to healthy individuals.SOD2is a mitochondrial enzyme that protects against oxidative stress by converting superoxide radicals to molecular oxygen and hydrogen peroxide. Given its antioxidant capacity, it has been implicated in the pathogenesis of PD. For example, inactivation of SOD2 increases mitochondrial ROS production inin vitromodels of PD [45]. Moreover, SOD2 protein levels are increased in the frontal cortex of PD patients [46]. In the context of diabetes, increased levels of SOD2 mRNA have been found in skeletal muscle of patients with T2DM [47]. In addition, SOD2 has been associated to be involved in inflammation [48], insulin signaling and glucose metabolism[49,50], and lipid metabolism and peroxidation [51], processes that were identified dysregulated in the network analysis. Therefore, it is not surprising that SOD2 was the most highly ranked gene by the prioritization method.
Recently, drugs to treat diabetic patients, metformin-sulfonyl-urea and exenatide have shown promise in PD patients [52,53]. In fact, improvement of motor and cognitive functions persists one year after the treatment with exenatide [54]. Interestingly, diabetic drugs are known to interact with SOD2. For example, metformin treatment results in an increased expression ofSOD2mRNA in human endothelial cells [55]. Troglitazone treatment, another anti-diabetic and anti-inflammatory drug, results in decreased expression of SOD2 mRNAs in cellular models [56,57]. In addition, gliclazide treatment, an oral sulfonylurea hypoglycemic agent, results in decreased protein expression of SOD2 [58], and rosiglitazone, an insulin sensitizer, increased SOD2 protein expression in retinal cells from mice [59]. Based on these observations, expression of SOD2 in blood may be useful to evaluate the therapeutic effect of anti-diabetic drugs in PD patients.
This study has several strengths and limitations. Biomarkers obtained from microarray studies may be data set specific and not indicative of the underlying disease pathology. In this context, our integrated network approach provides a framework to identify and prioritize PD biomarkers involved in common dysregulated pathways. Another strength is the replication of this biomarker in two independent cohorts of patients. However, there are several limitations and potential confounding factors. For example, although we have found that GAPDH mRNA expression in blood is stable in previous studies [15,16,27,60], replication of this biomarker using several reference genes for normalization is desirable [61]. In addition, differences in blood counts and PD medications may bias gene expression results. Thus, evaluation of SOD2 mRNA in drug-naı¨ve PD patients and in a large well-characterized prospective study will be important to determine its clinical utility.
In summary, our study demonstrates that integration of shared molecular networks provides a useful framework to prioritize candidate biomarkers in a biologically relevant context.
Remark-ably, we demonstrate that expression of a highly ranked gene identified within shared dysregulated pathways can be used as diagnostic marker for PD. We foresee integrated network approaches will provide a better understanding of the underlying disease mechanism and facilitate the discovery of accurate biomarkers and therapeutic targets. In this regard, a network-based approach was useful to identify a neuroprotective agent, alvespimycin (17-DMAG), in PD [25]. Although the prioritization method presented in this study has been evaluated in the specific case of PD-T2DM, other disease-disease associations may be studied following this protocol. For instance, the construction of shared genes and protein networks have facilitated the under-standing of other disease-disease associations such as asthma and tuberculosis [32] and artherosclerosis-induced ocular diseases [33]. Thus, network analysis of disease comorbidities may reveal novel diagnostic biomarkers and therapeutic strategies.
Future studies will be aimed to replicate these findings in samples from non-medicated and patients at risk of PD and to evaluate other potential candidate biomarkers found in this study.
Supporting Information
Figure S1 Validation of each prioritization step. The performance of each prioritization step was validated by computing values for ROC and AUC through the leave-one-out validation method using GPEC.
(TIF)
Table S1 PD and T2DM shared cluster of genes. 84 shared genes between PD and T2DM and the corre-sponding databases from which each gene was collected. (DOC)
Table S2 Curated gene sets used for RWR prioritiza-tion.
(DOC)
Table S3 RWR-based scores for each prioritization within the functional linkage network. Score PD-T2DM is the score for the disease prioritization, p1 is insulin signaling pathway, p2 is nitric oxide biosynthesis, p3 is glucose metabolism, p4 is inflammation, p5 is lipid metabolism and c is the cumulative score.
(DOC)
Acknowledgments
We are grateful to the individuals and researchers who participated in the PROBE and HBS studies.
Author Contributions
Conceived and designed the experiments: JAP JAS. Performed the experiments: JAS. Analyzed the data: JAP JAS. Contributed reagents/ materials/analysis tools: CRS. Wrote the paper: JAP JAS. Reviewed manuscript: CRS.
References
1. Scheele C, Nielsen AR, Walden TB, Sewell DA, Fischer CP, et al. (2007) Altered regulation of the PINK1 locus: a link between type 2 diabetes and neurodegeneration? FASEB journal: official publication of the Federation of American Societies for Experimental Biology 21: 3653–3665.
2. Cereda E, Barichella M, Pedrolli C, Klersy C, Cassani E, et al. (2011) Diabetes and risk of Parkinson’s disease: a systematic review and meta-analysis. Diabetes care 34: 2614–2623.
3. Cereda E, Barichella M, Pedrolli C, Klersy C, Cassani E, et al. (2013) Diabetes and risk of Parkinson’s disease. Movement disorders: official journal of the Movement Disorder Society 28: 257.
4. Santiago JA, Potashkin JA (2013) Shared dysregulated pathways lead to Parkinson’s disease and diabetes. Trends in molecular medicine 19: 176–186. 5. Santiago JA, Potashkin JA (2014) System-based approaches to decode the
6. D’Amelio M, Ragonese P, Callari G, Di Benedetto N, Palmeri B, et al. (2009) Diabetes preceding Parkinson’s disease onset. A case-control study. Parkinson-ism & related disorders 15: 660–664.
7. Lu L, Fu DL, Li HQ, Liu AJ, Li JH, et al. (2014) Diabetes and risk of Parkinson’s disease: an updated meta-analysis of case-control studies. PloS one 9: e85781. 8. Palacios N, Gao X, McCullough ML, Jacobs EJ, Patel AV, et al. (2011) Obesity,
diabetes, and risk of Parkinson’s disease. Movement disorders: official journal of the Movement Disorder Society 26: 2253–2259.
9. Noyce AJ, Bestwick JP, Silveira-Moriyama L, Hawkes CH, Giovannoni G, et al. (2012) Meta-analysis of early nonmotor features and risk factors for Parkinson disease. Annals of neurology 72: 893–901.
10. Kotagal V, Albin RL, Muller ML, Koeppe RA, Frey KA, et al. (2013) Diabetes is associated with postural instability and gait difficulty in Parkinson disease. Parkinsonism & related disorders 19: 522–526.
11. Bosco D, Plastino M, Cristiano D, Colica C, Ermio C, et al. (2012) Dementia is associated with Insulin Resistance in patients with Parkinson’s disease. Journal of the neurological sciences 315: 39–43.
12. Aviles-Olmos I, Limousin P, Lees A, Foltynie T (2013) Parkinson’s disease, insulin resistance and novel agents of neuroprotection. Brain: a journal of neurology 136: 374–384.
13. Wang L, Zhai YQ, Xu LL, Qiao C, Sun XL, et al. (2014) Metabolic inflammation exacerbates dopaminergic neuronal degeneration in response to acute MPTP challenge in type 2 diabetes mice. Experimental neurology 251: 22–29.
14. Santos RX, Correia SC, Alves MG, Oliveira PF, Cardoso S, et al. (2014) Mitochondrial quality control systems sustain brain mitochondrial bioenergetics in early stages of type 2 diabetes. Molecular and cellular biochemistry. 15. Santiago JA, Potashkin JA (2013) Integrative network analysis unveils convergent
molecular pathways in Parkinson’s disease and diabetes. PloS one 8: e83940. 16. Santiago JA, Potashkin JA (2014) A network approach to diagnostic biomarkers
in progressive supranuclear palsy. Movement disorders: official journal of the Movement Disorder Society 29: 550–555.
17. Bauer-Mehren A, Bundschus M, Rautschka M, Mayer MA, Sanz F, et al. (2011) Gene-disease network analysis reveals functional modules in mendelian, complex and environmental diseases. PloS one 6: e20284.
18. Shannon P, Markiel A, Ozier O, Baliga NS, Wang JT, et al. (2003) Cytoscape: a software environment for integrated models of biomolecular interaction networks. Genome research 13: 2498–2504.
19. Peng K, Xu W, Zheng J, Huang K, Wang H, et al. (2013) The Disease and Gene Annotations (DGA): an annotation resource for human disease. Nucleic acids research 41: D553–560.
20. Huttenhower C, Haley EM, Hibbs MA, Dumeaux V, Barrett DR, et al. (2009) Exploring the human genome with functional maps. Genome research 19: 1093–1106.
21. Wang L, Khankhanian P, Baranzini SE, Mousavi P (2011) iCTNet: a Cytoscape plugin to produce and analyze integrative complex traits networks. BMC bioinformatics 12: 380.
22. Montojo J, Zuberi K, Rodriguez H, Kazi F, Wright G, et al. (2010) GeneMANIA Cytoscape plugin: fast gene function predictions on the desktop. Bioinformatics 26: 2927–2928.
23. Le DH, Kwon YK (2012) GPEC: a Cytoscape plug-in for random walk-based gene prioritization and biomedical evidence collection. Computational biology and chemistry 37: 17–23.
24. Subramanian A, Tamayo P, Mootha VK, Mukherjee S, Ebert BL, et al. (2005) Gene set enrichment analysis: a knowledge-based approach for interpreting genome-wide expression profiles. Proceedings of the National Academy of Sciences of the United States of America 102: 15545–15550.
25. Gao L, Zhao G, Fang JS, Yuan TY, Liu AL, et al. (2013) Discovery of the neuroprotective effects of alvespimycin by computational prioritization of potential anti-parkinson agents. The FEBS journal.
26. Ding H, Sarokhan AK, Roderick SS, Bakshi R, Maher NE, et al. (2011) Association of SNCA with Parkinson: replication in the Harvard NeuroDiscov-ery Center Biomarker Study. Movement disorders: official journal of the Movement Disorder Society 26: 2283–2286.
27. Potashkin JA, Santiago JA, Ravina BM, Watts A, Leontovich AA (2012) Biosignatures for Parkinson’s disease and atypical parkinsonian disorders patients. PloS one 7: e43595.
28. Scherzer CR, Eklund AC, Morse LJ, Liao Z, Locascio JJ, et al. (2007) Molecular markers of early Parkinson’s disease based on gene expression in blood. Proceedings of the National Academy of Sciences of the United States of America 104: 955–960.
29. Adler CH, Beach TG, Hentz JG, Shill HA, Caviness JN, et al. (2014) Low clinical diagnostic accuracy of early vs advanced Parkinson disease: Clinico-pathologic study. Neurology.
30. Rajput AH, Rajput A (2014) Accuracy of Parkinson disease diagnosis unchanged in 2 decades. Neurology.
31. Kohler S, Bauer S, Horn D, Robinson PN (2008) Walking the interactome for prioritization of candidate disease genes. American journal of human genetics 82: 949–958.
32. Bragina EY, Tiys ES, Freidin MB, Koneva LA, Demenkov PS, et al. (2014) Insights into pathophysiology of dystropy through the analysis of gene networks: an example of bronchial asthma and tuberculosis. Immunogenetics 66: 457–465. 33. Gupta A, Mohanty P, Bhatnagar S (2014) Integrative analysis of ocular complications in atherosclerosis unveils pathway convergence and crosstalk. Journal of receptor and signal transduction research: 1–16.
34. Altshuler D, Hirschhorn JN, Klannemark M, Lindgren CM, Vohl MC, et al. (2000) The common PPARgamma Pro12Ala polymorphism is associated with decreased risk of type 2 diabetes. Nature genetics 26: 76–80.
35. Novelli G, Ciccacci C, Borgiani P, Papaluca Amati M, Abadie E (2008) Genetic tests and genomic biomarkers: regulation, qualification and validation. Clinical cases in mineral and bone metabolism: the official journal of the Italian Society of Osteoporosis, Mineral Metabolism, and Skeletal Diseases 5: 149–154. 36. Dzamko N, Chua G, Ranola M, Rowe DB, Halliday GM (2013) Measurement
of LRRK2 and Ser910/935 phosphorylated LRRK2 in peripheral blood mononuclear cells from idiopathic Parkinson’s disease patients. Journal of Parkinson’s disease 3: 145–152.
37. Lin X, Cook TJ, Zabetian CP, Leverenz JB, Peskind ER, et al. (2012) DJ-1 isoforms in whole blood as potential biomarkers of Parkinson disease. Scientific reports 2: 954.
38. Levine AJ, Feng Z, Mak TW, You H, Jin S (2006) Coordination and communication between the p53 and IGF-1-AKT-TOR signal transduction pathways. Genes & development 20: 267–275.
39. Maddocks OD, Vousden KH (2011) Metabolic regulation by p53. Journal of molecular medicine 89: 237–245.
40. Dunn L, Allen GF, Mamais A, Ling H, Li A, et al. (2014) Dysregulation of glucose metabolism is an early event in sporadic Parkinson’s disease. Neurobiology of aging 35: 1111–1115.
41. Przedborski S (2010) Inflammation and Parkinson’s disease pathogenesis. Movement disorders: official journal of the Movement Disorder Society 25 Suppl 1: S55–57.
42. Nolan YM, Sullivan AM, Toulouse A (2013) Parkinson’s disease in the nuclear age of neuroinflammation. Trends in molecular medicine 19: 187–196. 43. Marcil V, Seidman E, Sinnett D, Boudreau F, Gendron FP, et al. (2010)
Modification in oxidative stress, inflammation, and lipoprotein assembly in response to hepatocyte nuclear factor 4alpha knockdown in intestinal epithelial cells. The Journal of biological chemistry 285: 40448–40460.
44. Menon R, Farina C (2011) Shared molecular and functional frameworks among five complex human disorders: a comparative study on interactomes linked to susceptibility genes. PloS one 6: e18660.
45. Belluzzi E, Bisaglia M, Lazzarini E, Tabares LC, Beltramini M, et al. (2012) Human SOD2 modification by dopamine quinones affects enzymatic activity by promoting its aggregation: possible implications for Parkinson’s disease. PloS one 7: e38026.
46. Ferrer I, Perez E, Dalfo E, Barrachina M (2007) Abnormal levels of prohibitin and ATP synthase in the substantia nigra and frontal cortex in Parkinson’s disease. Neuroscience letters 415: 205–209.
47. Reyna SM, Ghosh S, Tantiwong P, Meka CS, Eagan P, et al. (2008) Elevated toll-like receptor 4 expression and signaling in muscle from insulin-resistant subjects. Diabetes 57: 2595–2602.
48. Schramm F, Kern A, Barthel C, Nadaud S, Meyer N, et al. (2012) Microarray analyses of inflammation response of human dermal fibroblasts to different strains of Borrelia burgdorferi sensu stricto. PloS one 7: e40046.
49. Soderberg JA, Birse RT, Nassel DR (2011) Insulin production and signaling in renal tubules of Drosophila is under control of tachykinin-related peptide and regulates stress resistance. PloS one 6: e19866.
50. Kang L, Dai C, Lustig ME, Bonner JS, Mayes WH, et al. (2014) Heterozygous SOD2 Deletion Impairs Glucose-Stimulated Insulin Secretion, but not Insulin Action in High Fat-Fed Mice. Diabetes.
51. Singh BK, Kumar A, Ahmad I, Kumar V, Patel DK, et al. (2011) Oxidative stress in zinc-induced dopaminergic neurodegeneration: implications of superoxide dismutase and heme oxygenase-1. Free radical research 45: 1207– 1222.
52. Aviles-Olmos I, Dickson J, Kefalopoulou Z, Djamshidian A, Ell P, et al. (2013) Exenatide and the treatment of patients with Parkinson’s disease. The Journal of clinical investigation 123: 2730–2736.
53. Wahlqvist ML, Lee MS, Hsu CC, Chuang SY, Lee JT, et al. (2012) Metformin-inclusive sulfonylurea therapy reduces the risk of Parkinson’s disease occurring with Type 2 diabetes in a Taiwanese population cohort. Parkinsonism & related disorders 18: 753–758.
54. Aviles-Olmos I, Dickson J, Kefalopoulou Z, Djamshidian A, Kahan J, et al. (2014) Motor and Cognitive Advantages Persist 12 Months After Exenatide Exposure in Parkinson’s Disease. Journal of Parkinson’s disease.
55. Kukidome D, Nishikawa T, Sonoda K, Imoto K, Fujisawa K, et al. (2006) Activation of AMP-activated protein kinase reduces hyperglycemia-induced mitochondrial reactive oxygen species production and promotes mitochondrial biogenesis in human umbilical vein endothelial cells. Diabetes 55: 120–127. 56. Lauer B, Tuschl G, Kling M, Mueller SO (2009) Species-specific toxicity of
57. Ruan H, Pownall HJ, Lodish HF (2003) Troglitazone antagonizes tumor necrosis factor-alpha-induced reprogramming of adipocyte gene expression by inhibiting the transcriptional regulatory functions of NF-kappaB. The Journal of biological chemistry 278: 28181–28192.
58. Onozato ML, Tojo A, Goto A, Fujita T (2004) Radical scavenging effect of gliclazide in diabetic rats fed with a high cholesterol diet. Kidney international 65: 951–960.
59. Doonan F, Wallace DM, O’Driscoll C, Cotter TG (2009) Rosiglitazone acts as a neuroprotectant in retinal cells via up-regulation of sestrin-1 and SOD-2. Journal of neurochemistry 109: 631–643.
60. Santiago JA, Scherzer CR, Potashkin JA (2013) Specific splice variants are associated with Parkinson’s disease. Movement disorders: official journal of the Movement Disorder Society 28: 1724–1727.