Distinguishing between Incomplete Lineage Sorting
Allospecific Mitochondrial DNA in a Sexually
Reproducing Fish (
Cobitis
; Teleostei), despite Clonal
Reproduction of Hybrids
Lukas Choleva1,2*, Zuzana Musilova1,3,4, Alena Kohoutova-Sediva1,5, Jan Paces1,6, Petr Rab1, Karel Janko1,7
1Laboratory of Fish Genetics, Institute of Animal Physiology and Genetics, AS CR, v.v.i., Libechov, Czech Republic,2Ecological Genetics Research Unit, Department of Biosciences, University of Helsinki, Helsinki, Finland,3Zoological Institute, Evolutionary Biology, University of Basel, Basel, Switzerland,4Department of Zoology, Faculty of Science, Charles University in Prague, Prague, Czech Republic,5Institute of Zoology, Slovak Academy of Sciences, Bratislava, Slovakia,6Laboratory of Genomics and Bioinformatics, Institute of Molecular Genetics of the ASCR, v.v.i., Prague, Czech Republic,7Life Science Research Centre, Department of Biology and Ecology, Faculty of Natural Sciences, University of Ostrava, Ostrava, Czech Republic
Abstract
Distinguishing between hybrid introgression and incomplete lineage sorting causing incongruence among gene trees in that they exhibit topological differences requires application of statistical approaches that are based on biologically relevant models. Such study is especially challenging in hybrid systems, where usual vectors mediating interspecific gene transfers -hybrids with Mendelian heredity - are absent or unknown. Here we study a complex of hybridizing species, which are known to produce clonal hybrids, to discover how one of the species,Cobitis tanaitica, has achieved a pattern of mito-nuclear mosaic genome over the whole geographic range. We appplied three distinct methods, including the method using solely the information on gene tree topologies, and found that the contrasting mito-nuclear signal might not have resulted from the retention of ancestral polymorphism. Instead, we found two signs of hybridization events related toC. tanaitica; one concerning nuclear gene flow and the other suggested mitochondrial capture. Interestingly, clonal inheritance (gynogenesis) of contemporary hybrids prevents genomic introgressions and non-clonal hybrids are either absent or too rare to be detected among EuropeanCobitis. Our analyses therefore suggest that introgressive hybridizations are rather old episodes, mediated by previously existing hybrids whose inheritance was not entirely clonal.Cobitiscomplex thus supports the view that the type of resulting hybrids depends on a level of genomic divergence between sexual species.
Citation:Choleva L, Musilova Z, Kohoutova-Sediva A, Paces J, Rab P, et al. (2014) Distinguishing between Incomplete Lineage Sorting and Genomic Introgressions: Complete Fixation of Allospecific Mitochondrial DNA in a Sexually Reproducing Fish (Cobitis; Teleostei), despite Clonal Reproduction of Hybrids. PLoS ONE 9(6): e80641. doi:10.1371/journal.pone.0080641
Editor:Norman Johnson, University of Massachusetts, United States of America
ReceivedOctober 13, 2012;AcceptedOctober 15, 2013;PublishedJune 27, 2014
Copyright:ß2014 Choleva et al. This is an open-access article distributed under the terms of the Creative Commons Attribution License, which permits unrestricted use, distribution, and reproduction in any medium, provided the original author and source are credited.
Funding:The authors gratefully acknowledge the grant support no. P506/10/1155 to LC, PR and KJ provided by the Czech Science Foundation (www.gacr.cz). Further support was provided by the Academy of Sciences of the Czech Republic (ASCR) (www.cas.cz) by the Grant No. RVO 67985904 and by the Project No. M200451271 to LC within the Program for internal support of projects of international cooperation ASCR. LC is also profoundly grateful for the financial support (No. ES-TAF-169) from the European Community’s Programme ‘‘Structuring the European Research Area’’ under Synthesys (www.synthesys.info), hosted by I. Doadrio at the Museo Nacional de Ciencias Naturales CSIC and to the Czech Science Foundation (www.gacr.cz) by grant no. P506/12/P857. The funders had no role in study design, data collection and analysis, decision to publish, or preparation of the manuscript. The funders had no role in study design, data collection and analysis, decision to publish, or preparation of the manuscript.
Competing Interests:The authors have declared that no competing interests exist. * Email: choleva@iapg.cas.cz
Introduction
Interspecific genetic exchange has long been recognized as an important feature in the evolution of plants, but a growing amount of recent studies suggest that hybridization may be potentially important in animal evolution as well, as it can occasionally lead to the formation of new species [1–5]. Hybridization is often inferred from topological incongruence between gene trees. A major problem in correctly detecting hybridization lies in the fact that conflicting phylogenetic signals among loci may also be caused by other processes, namely incomplete lineage sorting. Traditional phylogenetic approaches based on independent inspection of
several loci and comparison of the geographic distribution of different lineages may help to identify potential cases of discordant evolution [6–8]; however, they cannot rigorously test the two processes that result in discordant genealogies.
Although distinguishing hybrid introgression from incomplete lineage sorting remains a critical task in evolutionary studies, yet no effective and widely applicable approach exists for distinguish-ing these processes [9]. However, recent methodological advances in the development of so called ‘coalescent genealogy samplers’ [3,10] have greatly facilitated the use of multiple loci as the basis for estimating the sizes of diverging populations, time since their
PLOS ONE | www.plosone.org 1 June 2014 | Volume 9 | Issue 6 | e80641
divergence, and immigration rates in a statistical framework [3,11–14]. Nevertheless, each statistical method is based on some simplifying assumptions (e.g. constant population size, marker neutrality, constant immigration rate through time) that may in fact be violated, making the biologically relevant interpretation of obtained results challenging. Therefore, knowledge of the studied organism is essential in understanding how differences between the real population and its simplified representation can affect the results of the analysis [3,10], e.g. in order to make a proper assessment of the origin, extent and evolutionary significance of hybrid introgression.
Introgressive hybridization arises if two species that come into contact – either throughout the process of speciation [2,15,16] or by secondary contact [8] – are not completely reproductively isolated. Here, the asymmetry in levels of genetic introgression between hybridizing species appears to be the rule rather than exception. The phenomenon is caused by the fact that the permeability of interspecific barriers differs among genomic regions. In particular, mtDNA is known to easily introgress into allospecific gene pools. This behavior may be explained by an interplay of selection [17–19] and hereditary characteristics; specifically, the maternal inheritance and smaller effective population size of mtDNA suggest that a recipient population may receive foreign mtDNA more easily than nuclear genes [20–23]. On some occasions, ancestral mtDNA haplotypes may even be completely replaced by the introgressed ones in the apparent absence of nuclear introgression [24–26]. On the other hand, contrasting cases have documented the presence of nuclear gene flow with no mitochondrial introgressions [27]. In addition, many hybrid species carry mosaic genotypes in nuclear DNA while their mtDNA is derived from one or both parental taxa [1,4,28,29]. This ultimately leads to the realization that a single gene tree genealogy may or may not reflect the true history of a species (tree). Hence, combining multiple independent nuclear DNA and mtDNA markers, along with incorporating intraspecific sampling of several individuals [30] coupled with good geographical coverage of the species of interest, improves the power to detect the genetic pattern in current species and to test for hybridization in the presence of coalescence.
Model-based inferences of historical gene flow among sexually reproducing species are greatly enhanced by direct evidence for hybridizations. Such hybrids have usually achieved the indepen-dent segregation of parental chromosomes during meiosis. Their ongoing hybridizations result in various types of hybrid introgres-sions in populations [31]. Therefore, fertile, sexually reproducing hybrids are usually assumed as key players in genomic introgres-sions (e.g. [5,32]), because they backcross to sexual species and thus mediate a ‘‘bridge’’ for DNA introgression from one species to another. However, instances of conflicting gene genealogies have also been detected in animal systems where sexual species produce hybrids that lack regular meiotic cycles and whose reproduction deviates from the canonical rules of heredity [33–40]. Clonal reproduction, either in the absence of fertilization (parthenogen-esis) or syngamy (gynogenesis; e.g. the sperm is only used to trigger the egg development), maintains hybrids in a permanent F1state,
thereby preventing gene introgression into sexual species. When genetic interaction with sexual species occurs, it is known to involve either true fertilization that increases the ploidy level of the hybrid lineage [41], or incorporations of parts of the sperm genome persisting as microchromosomes [42]. Nonetheless, some animals combine clonally and sexually transmitted genomes using so-called ‘quasi-sexual reproductive modes’ – e.g. hybridogenesis [41], meiotic hybridogenesis [37,37,43–45], kleptogenesis [46], or pre-equalizing hybrid meiosis [47]. For instance, hybridogenetic hybrids can mediate rapid introgression of mtDNA or nuclear
genome en bloc from one species to another without meiotic admixture of parental genomes (nuclear hybridity), producing a clear mito-nuclear mosaic genome [37]. Hence, investigations of animals displaying both sexual and non-sexual heredity could provide important insights into unknown processes of reticulate evolution, and identify potential drivers of reticulate events [48]. Here we focus on a freshwater fish of the genus Cobitis, and document the existence of one of the most geographically widespread examples of mito-nuclear mosaic genome among animals, and further investigate its origin.
The so-called ‘Cobitis taenia hybrid complex’ comprises several sexual species having a parapatric distribution, of which three species show closely adjacent ranges in non-Mediterranean Europe: C. elongatoides, C. tanaitica, and C. taenia (Figure 1A–G).
C. elongatoides(diploid chromosome number 2n = 50) andC. taenia
(2n = 48) are well defined by karyotype (Figure 1D,F) and mito-nuclear markers [49–51]. The third sexual species, C. tanaitica, (2n = 50) is well distinguishable from the other two species by karyotype (Figure 1B,D,F; [50]).
We showed previously [52] that primary hybridizations take place between the species C. elongatoides and C. taenia in narrow hybrid zones in the upper Elbe, Odra Rivers and in the northern Black Sea shelf. Population genetic analyses of the Odra R. hybrid zone revealed fixed heterozygotes as the only form of hybrids [53]. Laboratory crossing experiments confirmed strictly clonal gynoge-netic reproduction of hybrid females, while hybrid males were infertile [54,55]. Paternal leakage of subgenomic amounts has never been observed, but incorporations of entire chromosome sets into diploid or triploid eggs result in the formation of a new polyploid gynogenetic lineage [54,55]. Clonal hybrids are now distributed throughout most of Europe, including most of the distribution ranges of the parental taxa – even in allopatric areas. Hybrids betweenC. elongatoidesandC. tanaiticaare also known to occur as fixed clonal heterozygotes appearing as di, tri- and tetraploids. They have arisen in the lower Danube and spread over most of the Balkan Peninsula and Central Europe [50,56,57]. Hence, speciation between sexual species of spined loaches seems virtually complete despite their reproductive contact during the Pleistocene/Holocene era, because their diploid and polyploid hybrids are permanent F1
heterozygotes and reproduce clonally via gynogenesis
[49,50,54,55,57–60]. Clonal heredity of hybrids should therefore prevent any introgressive hybridization. However, recent findings suggest that one of the parental species, C. tanaitica, is a genetic mosaic because its mtDNA clusters exclusively withC. elongatoidesin the whole distribution range including distant allopatric regions [49], see also Figure 1G) but its nuclear allozymic markers are almost indistinguishable from those ofC. taenia[48].
Results
Sequence Variability, Neutrality Tests, Structure, and Divergence
The levels of nuclear DNA and mtDNA sequence polymor-phism inCobitis species are summarized in Table 1. Overall, the
nucleotide variation in nuclear gene markers was much lower compared to the mitochondrialcytblocus. Tajima’s relative rate test for all species pairs versus outgroup comparisons did not reject the null hypothesis of equal rates in all loci (p.0.15]. TheRpS7
andRAG1genes were inferred to have up to three recombination Figure 1. Photographs, karyotypes and Europe-wide distribution of spined loach sexual species (Cobitis) from this study.(A,C,E) Photographs (scale bar = 1 cm) and (B,D,F) respective karyotypes of three widespreadCobitisspecies. Karyograms with diploid chromosome number (2n), metacentric (m), submetacentric (sm), subtelocentric (st), and acrocentric chromosomes (a) were modified after Janko et al. [50]; (G) Sampling localities ofCobitis taenia(light gray squares; 1–10),C. elongatoides (dark gray squares; 11–20),C. tanaitica(black squares; 21–30),C. paludica
(checkered square; 31),C. fahirae(spotted square; 32), andC. vardarensis(reticulated square; 33). Insets show European species distribution with respective markings as given in squares. Note that locality no. 1 is situated more eastward, as marked by the arrow.
doi:10.1371/journal.pone.0080641.g001
Hybrid Introgressions and Barriers to Gene Flow
events and hence only the largest non-recombinant blocks of both loci were selected for the coalescence-based analyses.
The Hudson-Kreitman-Aguade test for the nuclear dataset alone was insignificant, but inclusion of thecytbsequences resulted in a significant outcome (p= 0.006). Thecytblocus exhibited high intraspecific and low interspecific variability. Tachida’sZwas not significant for any coding nuclear loci, but was significantly negative forcytb, suggesting the presence of purifying selection. As noted, e.g., by Nadachowska and Babik [61], directional and balancing selection is likely to invalidate the analyses of interspecific gene flow, whereas purifying selection only decreases the overall mutation rate. Therefore, we assume that our data are suitable for subsequent analyses, because we observed no evidence of balancing or directional selection.
Studying the level of intraspecific variation, we found thatCobitis
individuals shared a number of dominant haplotypes of nuclear sequence markers across the geographic distribution of the particular species (Table 2). At the level of interspecific relation-ships, several haplotypes were shared between C. taenia and C. tanaiticain the nuclear 28S, ACT-2,AtpB, N2, N6, and Rhod loci (Table 2). At the mitochondrialcytblocus we obtained 23 unique species-specific haplotypes, which clustered in two main lineages that differed by 4.18% net sequence divergence: one included only
C. taenia and second encompassed C. elongatoides and C. tanaitica
(Figure 2). Deeper geographic structuring of mtDNA was found in
C. tanaitica with two well-supported clades, the eastern clade (haplotypes H17–19; 0.93 posterior probabilities) from the Azov region and the western clade (haplotypes H8, H16–17, and H21– 23; 0.99 posterior probabilities) from the Delta of Danube River and Odra River basin. The two clades differed by 0.89% net sequence divergence. C. tanaitica appeared paraphyletic to C. elongatoides: we found thatC. elongatoidesformed a sister clade to the western lineage of C. tanaitica with the net sequence divergence equal to 0.48%. The divergence between the eastern clade ofC. tanaiticaandC. elongatoideswas 0.71%.
Phylogeny of the Gene Trees and the Species Tree Estimation
Nuclear data provided strong support for the sister position ofC. taenia and C. tanaitica; eight of nine nuclear loci consistently supported (C. taenia,C. tanaitica) monophyly, while one locus (Rag1) did not resolve the relationship between the two species. No locus significantly contradicted the sister relationship betweenC. taenia,
C. tanaitica. In contrast, the mitochondrial cytb gene strongly supported the sister position of (C. elongatoides,C. tanaitica), withC. tanaiticabeing paraphyletic toC. elongatoides. Hence, we observed strong mito-nuclear conflict that was fixed over the entire distribution range ofC. tanaitica.
The relationships among C. elongatoides C. fahirae, and C. vardarensis appeared unresolved from patterns in gene tree topologies across mito-nuclear markers (Figures 2).
We applied the Bayesian estimation of species trees (BEST; [62]) that allows for stochastic differences of topology of individual gene trees resulting from lack of gene lineage coalescence between speciation events. BEST was run in two parallel analyses, either with nuclear markers only or in combination with mitochondrial data. Both analyses consistently identified (C. taenia, C. tanaitica) monophyly with high posterior probability (,1, Figure S1). However, the tree topology was not fully resolved with respect toC. elongatoides,C. fahiraeandC. vardarensisbranching.C. vardarensis
was either positioned at the basal species of theC. sensu stricto(nine nuclear loci data, Figure S1A), or the polytomy was present in the consensus species tree (combined nuclear and mitochondrial data, Figure S1B).
Testing of Incomplete Lineage Sorting ofC. tanaitica
mtdna vs. Hybridization Scenarios
We employed three methodologically distinct approaches to discern whether the contrasting mito-nuclear signal may result
Table 1.Summary of nucleotide variation.
Locusa L h S Indels Haplotype diversity
6SD Nucleotide diversity6SD
28S 280 1, 1, 1, 2 0, 0, 0, 1 0 0.00060.000, 0.00060.000, 0.00060.000, 0.45260.042
0.00060.000, 0.00060.000, 0.00060.000, 0.00260.001
Act-2 306–330 3, 3, 2, 7 2, 3, 2, 7 0, 2, 0, 2 0.62660.104, 0.53060.136, 0.55660.075,
0.80260.042
0.00360.001, 0.00260.002, 0.00360.002, 0.00560.002
Atp-B 206–212 1, 5, 2, 7 0, 4, 2, 8 1, 0, 1, 1 0.00060.000, 0.63260.088, 0.18960.108,
0.56360.065
0.00060.000, 0.00660.003, 0.00260.002, 0.00960.003
N2 435–514 1, 5,1, 6 0, 7,0, 10 0, 2, 0, 2 0.00060.000, 0.75860.077, 0.00060.000, 0.53360.071
0.00060.000, 0.00360.001, 0.00060.000, 0.00860.001
N4 278–648 1, 3, 1, 5 0, 2, 0, 15 1, 1, 1, 2 0.00060.000, 1.00060.272, 0.00060.000, 1.00060.126
0.00060.000, 0.00260.001, 0.00060.000, 0.01460.003
N6 548–567 3, 2, 4, 7 2, 2, 3, 13 1, 0, 1, 1 0.58260.142, 0.20060.154, 0.77360.083, 0.80160.037
0.00260:001, 0.00160.001, 0.00260.001, 0.00860.001
Rag1 653 5, 6, 2, 13 3, 7, 7,11 0 0.71160.085, 0.83760.047, 0.83760.047, 0.82060.032
0.00160.001, 0.00560.001, 0.00560.001, 0.00560.001
Rhod 507–515 1, 2, 1, 3 0, 1, 0, 7 0 0.00060.000, 0.10060.088, 0.00060.000, 0.46360.047
0.00060.000, 0.00060.000, 0.00060.000, 0.00560.001
RpS7 575–592 7, 3, 3, 13 4, 3, 4, 29 1, 4, 3, 6 1.00060.076, 1.00060.272, 1.00060.177, 1.00060.027
0.00360.001, 0.00360.002, 0.00460.002, 0.01960.003
cytb 1088 5, 10, 8, 23 9, 19, 20, 78 0 1.00060.126, 1.00060.045, 1.00060.063, 1.00060.013
0.00360.001, 0.00560.001, 0.00760.002, 0.02160:002
aData are in the order forC. taenia;C. elongatoides;C. tanaitica; and all three species.Cobitis fahirae,C. vardarensisandC. paludicawere sequenced as one individual per species per locus and not summarised.L, sequence length (bp);h, number of haplotypes;S, number of polymorphic sites.
Hybrid Introgressions and Barriers to Gene Flow
from the retention of ancestral polymorphism or indicates some hybridization events.
A) Topology-Based Tests Of Mito-Nuclear
Discordance. To understand a cause of mito-nuclear conflict inC. tanaitica, we first performed a purely theoretical test taking into account only the topological information suggesting that eight out of nine nuclear loci supported (C. taenia, C. tanaitica) monophyly, while mtDNA indicated a ((C. elongatoides,C. tanaitica)
C. taenia) tree topology. Assuming that true species tree is ((C. taenia,
C. tanaitica) C. elongatoides) as indicated by BEST, we used coalescence simulation to evaluate the probability of retention of mitochondrial ancestral polymorphism as a function of the length of (C. taenia, C. tanaitica) internode. We assumed that studied loci represent a random sample from the entireCobitisgenome and we simplistically modeled single sample per species. This was because Rosenberg [21] showed that with multiple samples per species, the probability of topological gene tree concordance in a three-species model is a complicated function of not only the sample numbers but also of actual population sizes and speciation times, for which we do not have independent estimates.
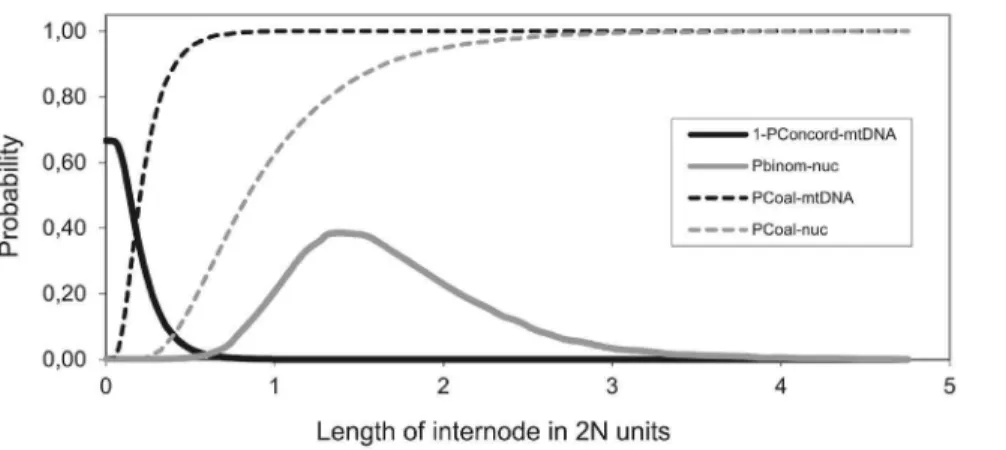
Figure 3 demonstrates that the probability of a deep coalescence pre-dating the split between C. elongatoides and (C. taenia, C. tanaitica) ancestor depends on the length of interval between the speciation events. When the interval is short, there is high probability of observing a topologically discordant mtDNA gene tree due to incomplete lineage sorting (if the interval equals zero, the probability is 2/3). In such case, however, there is a negligible chance to sample simultaneously eight out of nine nuclear loci with identical topology. On the other hand, when the internode length increases, the proportion of topologically concordant nuclear loci grows due to coalescences occurring in the (C. taenia,C. tanaitica) ancestral population, but the probability of observing a topolog-ically discordant mtDNA gene tree rapidly decreases. Further-more, when the internode length is high, it becomes unlikely to find any locus with discordant topology.
As apparent from the Figure 3, it is unlikely under any simulated length of the internode to observe the retention of mtDNA ancestral polymorphism when eight out of nine nuclear loci indicate identical topology. The overall probability of observed mito-nuclear conflict due to incomplete lineage sorting was negligible (p= 0.009).
B) Test Using Sequence Variability Based On Isolation Model (Speciation With No Gene Flow). In a second approach, we used nuclear sequences to estimate the population sizes and speciation times of studied species and their ancestral taxa assuming both species tree topologies provided by BEST (Figure S1). Such estimates served to evaluate the probability that the (C. taenia,C. tanaitica) internode was short enough and/or the ancestral population large enough to allow the retention of mtDNA ancestral polymorphism. Population sizes and internode lengths were estimated with the BPP [12,63] program Version 2.2 and final parameter estimates (Table 3 and Figure 4) were substituted into equation 5 by Rosenberg [21] to calculate the probability of topological discordance of the mtDNA gene tree. We found negligible probability that the mtDNA incongruence is caused by incomplete lineage sorting under both assayed species tree topologies (p#0.002).
C) Test of Gene Flow Among Spined Loaches. In a third approach, we applied an isolation with migration model using the two-population IM [64,65] and multi-population IMa 2.0 [14,66] programs for studying the divergence ofCobitisspecies including a parameter of gene flow (Figure 4).
Both programs were applied to nuclear and mtDNA data separately and IMa2 was also applied on a combined dataset (Figures 5A–H and 6A–F). Whether or not we separated mitochondrial and nuclear data, the power to resolve migration varied under different model assumptions in IM versus IMa2, but signals suggesting migration events between species-pairs were more or less consistent (Figures 5B,F–H and 6B, E–F, Tables S1 and S2). The resulting signal for a gene flow amongCobitisspecies was mostly related to significant signatures of nuclear gene flow betweenC. taeniaandC. tanaitica, which was supported by both IM and IMa2 programs. Consistently with this result, the investigation of the distribution of the number of migration events in the sampled gene genealogies separately for each locus found 20 migration events from C. taenia to C. tanaitica and 3 migration events for the opposite direction (combined Ima2 data), all related to nuclear loci. The inference of mtDNA gene flow was more complicated. For analysis of solely mtDNA data in the IM, we performed two types of IM runs. First, we treated allC. tanaitica
samples as single population. Second, given its clear separation into western and eastern mtDNA phylogroup, we also analysed the gene flow betweenC. elongatoidesand either eastern or westernC. tanaiticaclade to ensure the homogeneity of the study population in the model. Significant and unidirectional mitochondrial gene flow was observed only fromC. elongatoides to the eastern C. tanaitica. When analyzing C. elongatoides and either all individuals of C. tanaitica, or only the western C. tanaitica sub-dataset, the IM provided bimodal posterior distribution for migration and for the split time (t) parameters. While one peak in posteriors for the migration (MLE) was always greater than zero, the second peak was located at zero (Figure S2). The program was apparently not able to distinguish between scenarios of recent split with no migration and older split with higher migration. Similarly, combined nuclear and mtDNA data in IMa2 analysis indicated possible migration from C. elongatoides to C. tanaitica, which was insignificant, however. We therefore made an investigation of the distribution of the number of migration events in the sampled gene genealogies and found 2 migration events related to the gene flow fromC. elongatoidestoC. tanaiticaat the mtDNA locus. A detailed description of the results for the two-population IM model and three-population IMa2 model are given in Text S1.
Discussion
Discordance between mtDNA and Nuclear DNA INC. tanaitica
C. taeniaandC. elongatoidesrepresent well-defined, non-sister taxa based on the phylogeny of both mtDNA and nuclear markers. In contrast,C. tanaiticaclusters withC. elongatoidesin mtDNA, while it appears as the closest relative toC. taeniain the nuclear genes, even sharing some haplotypes at six nuclear loci (Figure 2 and Table 2). The mito-nuclear discordance was fixed across the whole range of
C. tanaitica(Table 2) including regions, where it occurs in distant allopatry from both other species. This finding is in agreement Figure 2. Phylogenetic comparison of gene trees constructed from nuclear and mitochondrial gene markers and mito-nuclear discordance.Bayesian DNA gene trees constructed from nine nuclear gene markers and one mitochondrialcytbgene marker were rooted with sequences from C. paludica. Haplotype numbers correspond to Table 2. Bar represents 0.1 substitution/site. The schematic tree shows the phylogenetic conflict ofC. tanaiticatopology between mitochondrial and nuclear gene markers.
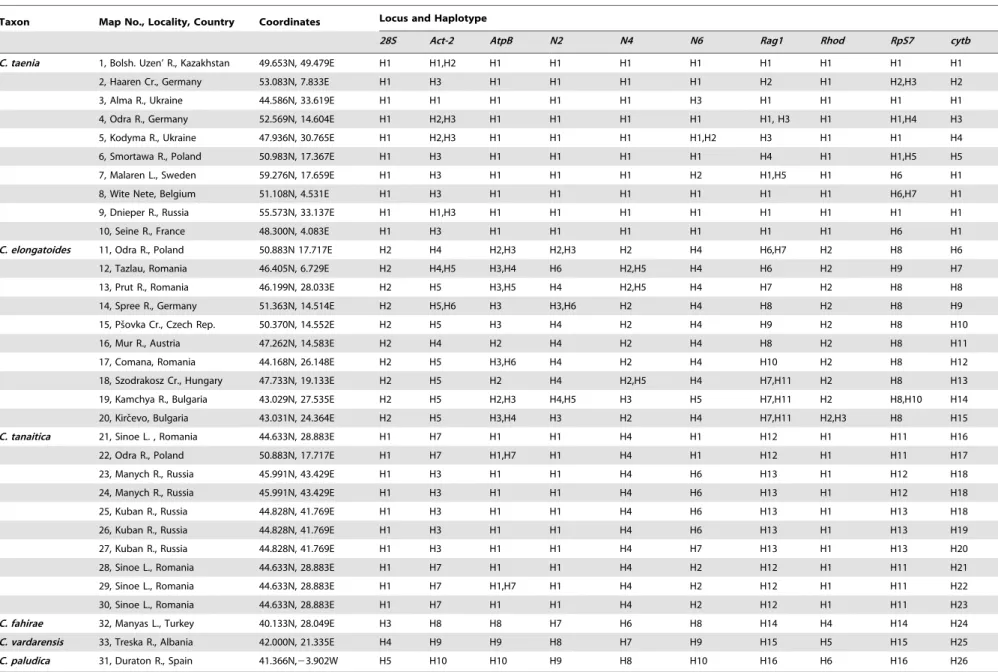
Table 2.Spined loaches (Cobitis) used in this study.
Taxon Map No., Locality, Country Coordinates Locus and Haplotype
28S Act-2 AtpB N2 N4 N6 Rag1 Rhod RpS7 cytb
C. taenia 1, Bolsh. Uzen’ R., Kazakhstan 49.653N, 49.479E H1 H1,H2 H1 H1 H1 H1 H1 H1 H1 H1
2, Haaren Cr., Germany 53.083N, 7.833E H1 H3 H1 H1 H1 H1 H2 H1 H2,H3 H2
3, Alma R., Ukraine 44.586N, 33.619E H1 H1 H1 H1 H1 H3 H1 H1 H1 H1
4, Odra R., Germany 52.569N, 14.604E H1 H2,H3 H1 H1 H1 H1 H1, H3 H1 H1,H4 H3
5, Kodyma R., Ukraine 47.936N, 30.765E H1 H2,H3 H1 H1 H1 H1,H2 H3 H1 H1 H4
6, Smortawa R., Poland 50.983N, 17.367E H1 H3 H1 H1 H1 H1 H4 H1 H1,H5 H5
7, Malaren L., Sweden 59.276N, 17.659E H1 H3 H1 H1 H1 H2 H1,H5 H1 H6 H1
8, Wite Nete, Belgium 51.108N, 4.531E H1 H3 H1 H1 H1 H1 H1 H1 H6,H7 H1
9, Dnieper R., Russia 55.573N, 33.137E H1 H1,H3 H1 H1 H1 H1 H1 H1 H1 H1
10, Seine R., France 48.300N, 4.083E H1 H3 H1 H1 H1 H1 H1 H1 H6 H1
C. elongatoides 11, Odra R., Poland 50.883N 17.717E H2 H4 H2,H3 H2,H3 H2 H4 H6,H7 H2 H8 H6
12, Tazlau, Romania 46.405N, 6.729E H2 H4,H5 H3,H4 H6 H2,H5 H4 H6 H2 H9 H7
13, Prut R., Romania 46.199N, 28.033E H2 H5 H3,H5 H4 H2,H5 H4 H7 H2 H8 H8
14, Spree R., Germany 51.363N, 14.514E H2 H5,H6 H3 H3,H6 H2 H4 H8 H2 H8 H9
15, Psˇovka Cr., Czech Rep. 50.370N, 14.552E H2 H5 H3 H4 H2 H4 H9 H2 H8 H10
16, Mur R., Austria 47.262N, 14.583E H2 H4 H2 H4 H2 H4 H8 H2 H8 H11
17, Comana, Romania 44.168N, 26.148E H2 H5 H3,H6 H4 H2 H4 H10 H2 H8 H12
18, Szodrakosz Cr., Hungary 47.733N, 19.133E H2 H5 H2 H4 H2,H5 H4 H7,H11 H2 H8 H13
19, Kamchya R., Bulgaria 43.029N, 27.535E H2 H5 H2,H3 H4,H5 H3 H5 H7,H11 H2 H8,H10 H14
20, Kircˇevo, Bulgaria 43.031N, 24.364E H2 H5 H3,H4 H3 H2 H4 H7,H11 H2,H3 H8 H15
C. tanaitica 21, Sinoe L. , Romania 44.633N, 28.883E H1 H7 H1 H1 H4 H1 H12 H1 H11 H16
22, Odra R., Poland 50.883N, 17.717E H1 H7 H1,H7 H1 H4 H1 H12 H1 H11 H17
23, Manych R., Russia 45.991N, 43.429E H1 H3 H1 H1 H4 H6 H13 H1 H12 H18
24, Manych R., Russia 45.991N, 43.429E H1 H3 H1 H1 H4 H6 H13 H1 H12 H18
25, Kuban R., Russia 44.828N, 41.769E H1 H3 H1 H1 H4 H6 H13 H1 H13 H18
26, Kuban R., Russia 44.828N, 41.769E H1 H3 H1 H1 H4 H6 H13 H1 H13 H19
27, Kuban R., Russia 44.828N, 41.769E H1 H3 H1 H1 H4 H7 H13 H1 H13 H20
28, Sinoe L., Romania 44.633N, 28.883E H1 H7 H1 H1 H4 H2 H12 H1 H11 H21
29, Sinoe L., Romania 44.633N, 28.883E H1 H7 H1,H7 H1 H4 H2 H12 H1 H11 H22
30, Sinoe L., Romania 44.633N, 28.883E H1 H7 H1 H1 H4 H2 H12 H1 H11 H23
C. fahirae 32, Manyas L., Turkey 40.133N, 28.049E H3 H8 H8 H7 H6 H8 H14 H4 H14 H24
C. vardarensis 33, Treska R., Albania 42.000N, 21.335E H4 H9 H9 H8 H7 H9 H15 H5 H15 H25
C. paludica 31, Duraton R., Spain 41.366N,23.902W H5 H10 H10 H9 H8 H10 H16 H6 H16 H26
doi:10.1371/journal.pone.0080641.t002
Hybrid
Introgressio
ns
and
Barriers
to
Gene
Flow
PLOS
ONE
|
www.ploson
e.org
7
June
2014
|
Volume
9
|
Issue
6
|
with previous investigations of six diagnostic species-specific allozyme loci of 58C. tanaiticaspecimens [50].
Sharing of similar alleles by two animal taxa has been documented in various cases that differ in the geographic extent of such event and in frequency of shared haplotypes e.g. [22,23]. Toews and Brelsford [48] review number of cases, when mito-nuclear discordance has achieved near fixation (greater than 95%). However, only in few such cases the mito-nuclear discordance has achieved 100% fixation in 100% geographic extent as in C. tanaitica. To our knowledge, all previously reported cases are distributed on a rather small biogeographic scale (e.g., [24–26,67], while C. tanaitica range spans over Eastern and Central Europe (Figure 1G). C. tanaitica thus represents a rare example among vertebrates, where mito-nuclear discordance has been fixed on a large geographic scale including distant allopatric regions.
Incomplete Lineage Sorting or Hybrid Introgression?
Known examples of mito-nuclear discordance, reviewed in [22,23,48], have often been attributed to introgressive hybridiza-tion but the presence of incomplete lineage sorting were rarely explicitly tested statistically [68]. Given that all statistical tests are necessarily based on simplifying assumptions, which may be violated in the real world, present study applied two methodolog-ically different approaches to evaluate the role of incomplete lineage sorting and an additional approach to detect signs of a possible gene flow among species. We are aware that our conclusions may be affected by sample size and strategy because missing a basal genealogical lineage would artefactually decrease the estimates of h and lead to overconfidence in the tests of incomplete lineage sorting. However, we sampled all phylogeo-graphic lineages identified in previous studies (Figure 1G). Moreover, because all topologies of coalescent trees are equiprob-able [69], the probability that additional samples would represent a new root to sampled intraspecific variability is only (2/(k*(k+1))) (kstands for number of sampled lineages) [70]. Assuming a more or less homogeneous population structure, our sample size of 20 chromosomes per species implies only ,1% probability that we missed the true root, suggesting that our sampling scheme adequate for the question at hand.
Both tests of incomplete lineage sorting also relied on the choice of implemented species tree. Although the monophyly of C. tanaiticaandC. taeniawas strongly supported, the relevance of other possible topologies should be discussed. Species trees assuming (C. elongatoides,C. tanaitica) or (C. elongatoides,C. taenia) sister positions would imply that C. taenia and C. tanaiticahave largely retained ancestral polymorphism (even sharing haplotypes at six out of nine nuclear markers), while C. elongatoides diverged rapidly from its putative sister species in all nuclear markers. Given that we found no evidence for rate heterogeneity in any locus, we consider these scenarios unlikely. The topology assuming a hard (C. taenia, C. tanaitica, C. elongatoides) polytomy may also be rejected because it predicts mosaic phylogenetic patterns in mtDNA and nuclear markers due to stochastic loss of alleles over time [71,72], which has not been observed inC. taeniaandC. elongatoides.
Altogether, both the topology-based test and the test based on isolation model rejected the possibility that C. tanaitica gained reciprocally monophyly to C. elongatoides in the nucleus while retaining the mtDNA lineage from the common ancestor. It strongly suggests that hybridization must be assumed to explain the observed mito-nuclear discordance. On the other hand, our tests do not rule out the persistence of incomplete lineage sorting among nuclear genes of C. tanaitica and C. taenia, because discriminating between introgression and incomplete lineage sorting is notoriously difficult when loci have not had enough
time to diverge [40]. Despite this, we show in concordance with previous multilocus studies [9,73] that even a small number of loci can be used to effectively detect hybridization.
Results from IM and IMa2 provided some general suggestions about possible directions of gene flow among species. While nuclear gene flow betweenC. tanaiticaandC. taeniawas significant, potential mtDNA gene flow from C. elongatoides to C. tanaitica
(Figure 5B and 6B) was indicated by nonzero peaks (Figure 5F,G and H) as well as by inferred mtDNA migration events, which were, nonetheless, mostly insignificant.
We are aware that the failure to reveal significant traces of migration might have been caused by some limiting assumptions of IM/IMa2 analyses that are not fully compatible with our population dataset (IM may be compromised by the existence of ‘ghost populations’ [74]; IMa2 relies on a defined species tree and a high number of loci, as the more populations and parameters require more data to obtain useful parameter estimates [14]; Both methods are appropriate for the analysis of recently separated populations with ongoing gene flow [65], so a greater phylogenetic distance between (C. taenia, C. tanaitica) clade and C. elongatoides
might have caused problems of recovering signal of older mitochondrial introgression events (see further in the text); Also, IM considers only two populations, leaving us with two options how to treat apparent phylogeographic structuring (western and eastern) of C. tanaitica mtDNA: (1) keeping the both sub-populations as a single population, which violates the assumption of panmixia, or (2) treating each population in separate analyses, which violates the assumption of no gene flow with other populations). Together, these circumstances might have caused analytical difficulties for IM in recovering signal of migration from
C. elongatoidestoC. tanaiticatreated as either single population, or considering only its western clade (Figures 2, S1, 5F and 5H). Bimodal posterior distributions for migration and split time (t) parameters (Figure S2), most likely reflected two attractors (J. Hey, pers. comm.), suggesting either the scenario of recent population split betweenC. elongatoidesandC. tanaiticawith zero migration into
C. tanaitica, or older split with strong migration intoC. tanaitica. We therefore consider IM and IMa2 results only as supplementary analysis in order to get a basic idea about directions of gene flow.
Origin ofc. tanaiticaMosaicism
The consensus of all applied methods suggests that mito-nuclear genomic mosaicism of C. tanaitica may not be explained by the retention of ancestral polymorphism, but most likely resulted from interspecific gene flow, which concerned nuclear gene flow betweenC. taenia andC. tanaitica, and a parallel mtDNA transfer likely fromC. elongatoides.
Further support for the hypothesis of ancient gene flow between
C. tanaitica and other two species comes from the fact that the mtDNA variation of contemporary C. elongatoides-tanaitica clonal hybrids is fully embedded within theC. elongatoidesmtDNA cluster (e.g., [57]), while C. tanaitica’s mitochondrion forms distinct clusters. Therefore, the mtDNA of C. tanaitica was probably inherited from C. elongatoides-like ancestor before Pleistocene/ Holocene origin of contemporary clonal hybrids. Given that the contemporary range overlap between spined loach species is very
limited (Figure 1G) and that C. elongatoides has not recently expanded to the Azov and Kuban regions [57], such introgression must have happened long enough ago to allow mtDNA divergence between western and eastern populations ofC. tanaitica. Similarly, the intensive nuclear gene flow betweenC. taenia(2n = 48) andC. tanaitica(2n = 50) suggested by the IM and Ima2 models must have occurred before chromosomal rearrangements had taken place between the two species.
Ideally, the hypothesis of rather older gene flow should be complemented by the estimates of times when inferred migration events took place and when species diverged [75]. However, we refrained from this approach for two reasons. First, we did not obtain reliable estimates oftandhAin some IM runs (Tables S1
and S2) suggesting that the data do not contain enough information for rigorous estimates of divergence times. Second, existing methods for estimating the number and times of migration events in separate loci [76] are limited by the fact that genealogies with different migration timing can have similar posterior probability [77]. The application of migration time estimates into studies of reticulate speciation is thus non-trivial, especially when gene flow has varied through time [76–78]. Instead, we combined biologically relevant data on chromosomal and genetic variability, phylogeography and reproductive modes of spined loach species and their hybrids to show that hybridization among the three species is an ongoing process (e.g., [53,55]) but any genomic replacements or introgressions into C. tanaitica most likely pre-dated the origin of contemporary clonal hybrids.
Identifying the proximate mechanisms of hybrid introgression and a type of hybrid mediators is more difficult. To understand the causal link between interspecific hybridization and asexual reproductive mode of hybrids, Moritz et al. formulated the ‘‘balance hypothesis’’ [79], which predicts that hybrids between closely related species usually retain meiosis. The growing divergence between parental species increases the proportion of hybrids with aberrant meiosis due to incompatibilities in the meiosis-regulating genes. This process may continue until even-tually the F1 hybrids produce entirely clonal gametes [79]. The balance hypothesis offers a possibility that fertile hybrids with Mendelian inheritance, which are virtually absent in the present, have been common in the past when the divergence betweenC.
Figure 3. Probability densities of four parameters in coalescence simulation as functions of length of internode. Graphical visualization in which (1–PConcord-mtDNA) denotes the probability density of observing discordant mtDNA phylo tree; (Pbinom-nuc) denotes the probability density of observing eight topologically concordant nuclear gene trees out nine studied nuclear loci in total; (PCoal-mtDNA) denotes the cumulative probability of mtDNA coalescence along the internode and (PCoal-nuc) denotes the cumulative probability of coalescence of nuclear locus along the internode. Note that there is very small intersection of probability densities allowing for observing eight out of nine topologically concordant nuclear loci while having discordant mtDNA tree (see the text for details).
doi:10.1371/journal.pone.0080641.g003
Figure 4. Parameters calculated from alternative tests using sequence data to explainC. tanaiticamito-nuclear discordance. Contemporary and ancestral population sizes are denoted by (hC.tae,
hC.tan,hC.elo,hC.tae,C.tan,hC.tae,C.tan,C.elo). Divergence times are denoted by
(tC.tae,C.tan and tC.tae,C.tan,C.elo), and interval between those times is
denoted by (c). Migration rates are denoted by (m) with relevant index. All parameters are scaled by mutation ratem, and can be converted to absolute values using the relations h= 4Nm (where N is effective population size),m= m/m(where m is gene-flow rates per gene copy per generation,t= tm(where t is a time of population splitting at t
generations in the past), and c= tm. Parameters estimated by BPP program are denoted by ($), those by IM by (#), and those by IMa2 by (@). The parameter c was calculated fromts given by BPP and ds programmes.C. taenia(C.tae),C. tanaitica(C. tan), andC. elongatoides
(C. elo).
doi:10.1371/journal.pone.0080641.g004
Hybrid Introgressions and Barriers to Gene Flow
tanaitica and C. elongatoides was lower. Such hybrids might have mediated directed backcrossing to sexual species inCobitis.
Alternatively, the transfer of a mitochondrial and/or complete nuclear genome might have been mediated by hybrids with non-Mendelian heredity, but not completely clonal, e.g. with hybridogenetic reproduction. Hybridogenetic hybrids are sperm-dependent parthenogens with hemiclonal gametogenesis that combine two genomes, e.g., one of speciesAand the other from species B. They usually discard the complete genome of one species (e.g.A) and clonally transmitting second parental genome (B). Mating with the speciesArestores the hybrid constitution of the progeny. However, there are cases of diploidABAor triploid
ABBA biotypes (hybrids with A-type mitochondrion) producing haploid BA gametes [33–38,80,81]. When such gametes are fertilized by a B-sperm, they give rise to mito-nuclear mosaic
BBA genome with normal Mendelian segregation (e.g.,
[37,38,82,83]). Therefore, such a mechanism of saltational evolution may easily supersede many unidirectional backcrosses to a sexual population through hybrids with Mendelian inheri-tance, and result in a homogeneous nuclear genome derived from only one parental species.
There is no indication of hybridogenesis in currently occurring European spined loaches despite intensive crossing experiments and oocyte electrophoreses. However, distantly related loaches from eastern Asian have the capability of hybridogenetic reproduction [37]. A simultaneous occurrence of clonal and non-clonal hybrid reproduction in some animal complexes, e.g.
Ambystoma[46],Squalius[33,80], suggest that more than one type of reproduction may occur at least at some point in evolution of these animal systems. It is interesting in this context that published data on life-bearing hybrid fish Poeciliopsis demonstrate that the switch from hybridogenesis to gynogenesis may be induced by polyploidization (2n hybrids are hemiclonal, while their 3n descendants are gynogenetic [84]. By analogy, it is possible that contemporary C. elongatoides-tanaitica hybrids, which occur as triploids, might have originated from diploid hybrid ancestors with different reproductive mode. When considering this possibil-ity in future research, it should be kept in mind, however, that both actual di- and triploid hybrids betweenC. elongatoidesandC. taeniaspecies-pair are gynogenetic [50,53–55,57–59].
Conclusions
Studies demonstrating secondary displacement of original markers across whole-ranges of allopatrically distributed species (see reviews in [5,22]) are usually complemented by evidence of hybrids with Mendelian heredity. Hybrid systems displaying non-sexual reproduction have traditionally been considered as an effective barrier to genomic introgression. Recently this view is changing (e.g., [85,86]).
Putting the data from European spined loaches together, the most parsimonious explanation of the observed mito-nuclear discordance suggest that hybrid drivers mediating interspecific gene flow through non-clonal reproduction have been common in the past but vanished as parental taxa diverged and clonally reproducing hybrids began to appear. If so, spined loaches would constitute one of the strongest support of the ‘‘balance hypothesis’’ [79]. Although we were unable to distinguish, whether proximate drivers of introgression into C. tanaitica were hybrids with Mendelian inheritance or hybrids with inheritance not entirely clonal, e.g. [85,86], our study demonstrates that massive introgression may be detected even in the apparent dominance of clonal hybrids in contemporary populations - an important finding in its own right that extends our knowledge about the stability of reproductive barriers and reproductive modes in animals.
The reticulate evolution of the C. taenia hybrid complex demonstrates that evolutionary histories of organismal groups combining sexual and non-sexual reproductive modes may be complex. It follows that analytical tools to reconstruct their histories should be adequately complex. These should combine fine-scale geographical sampling and crossing experiments with modern analytical tools allowing more complex models, which assume that gene flow between diverging populations may vary in time, or even among genomic regions.
Materials and Methods
Ethics Statement
‘Valid Animal Use Protocols’ CZ 00221 issued by Ministry of Agriculture of the Czech Republic (CR) were in force at IAPG AS CR, Libeˇchov. The DNA material preserved in 96% ethanol (a piece of fin clipped from the specimens) was obtained by exchange between collaborating teams between 1989 and 2009. Where Table 3.Prior and posterior distributions of parameters in the BPP Bayesian analysis of the nine nuclear loci.
Parameter Gamma prior Prior Posterior
(a,b) Mean (95% interval) Mean (95% interval)
hC.tae (2, 617)a 0.003240 (0.000390, 0.009030) 0.004711 (0.001715, 0.010027)
hC.tan 0.003240 (0.000390, 0.009030) 0.002253 (0.000542, 0.006071)
hC.elo 0.003240 (0.000390, 0.009030) 0.004988 (0.002547, 0.008695)
hC.tae, C.tan 0.003240 (0.000390, 0.009030) 0.002799 (0.000694, 0.005922)
hC.tae, C.tan, C.elo 0.003240 (0.000390, 0.009030) 0.003333 (0.000439, 0.008074)
tC.tae, C.tan, C.elo (2, 167.8)a 0.011920 (0.001440, 0.033200) 0.005595 (0.003016, 0.007991)
tC.tae,C.tan from analysisb 0.001573 (0.000628, 0.002936)
aPriors set withNe= 225,000 covering Watterson’s [91]hestimate (h
W= 0.002,Ne =138,889) and from branching event t = 3.31 Mya between European closely related
Cobitisspecies [104]. Relatively fast autosomal mutation rate (m) of 3.661029estimated in vertebrates [105] was used to transform prior expectations ofhandtfrom absolute estimates ofNeand t. Bothtandhare measured as the expected number of mutations per site.
bPrior for the node age was generated from the Dirichlet distribution ([63]: equation 2).
C. tae=C. taenia,C. tan=C. tanaitica,C. elo=C. elongatoides.
applicable, fishing and tissue collection were carried out with appropriate permissions from local authorities to the external collaborators. The photos of spined loaches were taken under the permissions of the Polish Government No.
DLOPiK-op/ogiz-4200/V-13/4443/06/aj, DLOPiK-op/ogiz-4200/V-11/7656,
9940/07/08/łw and No. DOPozgiz-4200/V-27/1612/09ls. Fish for photographing were handled by LC who has Certificate of competency according to117 of the CR Act No. 246/1992 coll. on the Protection of Animals against Cruelty (Reg. no: CZU 955/
06), provided by Central Commission for Animal Welfare, which authorizes animal experiments in the CR.
Sample and Data Collection
Spined loaches were sampled from 33 localities across the species geographical range. To consider hybridization and incomplete lineage sorting in a phylogenetic framework, several individuals are sampled from each species of interest [9,30,73]. We therefore used ten individuals each ofC. taenia,C. tanaitica, andC. elongatoides to cover complete geographic variability for the Figure 5. Posterior probability distributions for migration rates from two-population IM analysis. Coalescent-based estimates of migration rates (scaled by mutation rate) for three studied species inferred separately from (A–C) nuclear sequence data that included nine nuclear markers, and from (D–H) one mitochondrial marker gene.
doi:10.1371/journal.pone.0080641.g005
Hybrid Introgressions and Barriers to Gene Flow
sequencing analyses (Figure 1G; Table 2). In addition, we included one specimen from two non-MediterraneanC. sensu strictospecies that are not involved in hybridization but belong to the same phylogenetic clade, namely C. fahirae and C. vardarensis. A single individual Iberian spined loach, C. paludica, was used as the outgroup in the phylogenetic reconstructions (Figure 2).
Because different regions of the genome are expected to coalesce and introgress at different rates due to the action of selection and drift and because mtDNA is only maternally inherited compared to the common biparental heredity of the nucleus, we sampled genetic data from across the genome. We sequenced the mitochondrial cytochrome b gene (cytb) together with nine nuclear loci: the ribosomal RNA gene (28S); parts of the coding regions of the recombination activating (Rag1) and rhodopsin (Rhod) genes; intron 2 and partial cds of the actin gene (Act-2); intron and partial cds of the adenosine triphosphate
synthase beta subunit gene (Atp-B); intron of the S7 ribosomal protein gene (RpS7); three anonymous noncoding genomic DNA fragments (abbreviated asN2,N4, andN6); see Table 2 and Tables S3, S4, and S5 for details of laboratory procedures; Table S6 summarizes GenBank accessions both for sequences correspond-ing with the previously published haplotypes, or new haplotypes.
DNA Sequence Polymorphism
Sequences were aligned in ClustalW [87], and manually edited in BioEdit 7.0.9.0 [88] and were then manually checked and edited. All nuclear sequence traces were inspected visually and haplotypes of heterozygote individuals were resolved using diploid homozygote sequence traces [89]. The amino acid translation of the coding sequences was examined for stop codons. We calculated haplotype diversity, nucleotide diversities [90],h[91], Figure 6. Posterior probability distributions for migration rates from three-population IMa2 analysis.Coalescent-based estimates of migration rates (scaled by mutation rate) for three studied species inferred from (A–C) nine nuclear markers and (D–F) combined mito-nuclear sequence data that included one mitochondrial marker gene and nine nuclear markers.
net sequence divergence between populations, and the number of replacement versus synonymous mutations using DnaSP 5.0 [92].
Assessment of Recombination and Selection
We evaluated the prevalence of historical recombination within gene sequences using the four-gamete test [93]. For all subsequent analyses that assumed no within-locus recombination, we discard-ed the sites left or right of the putative recombination events to retain the longest possible contiguous non-recombined sequence.
Because locus-specific selection might invalidated the inferences of applied analyses, we tested for the presence and type of locus-specific selection using the Hudson-Kreitman-Aguade test [94], (available at http://lifesci.rutgers.edu/,heylab), and compared the data against 10,000 neutral coalescent simulations assuming correlation between the number of polymorphisms and interspe-cific divergence at all loci. We further used theZsummary statistic [95] to compare the ratios of fixed replacement (FR) and fixed synonymous (FS) mutations to polymorphic replacement (PR) and polymorphic synonymous (PS) mutations, such asZ= log10((FR/
FS)/(PR/PS)). Z was expected to be negative under purifying selection, and the significance of deviations from neutrality was tested using a 2-by-2 contingency table [96].
Phylogeny of the Gene Trees and the Species Tree Estimation
ModelTest 3.7 [97] using the Akaike information criterion was used to select models of sequence evolution for individual loci. Under the parameters of the best-fit model, we constructed Bayesian gene trees using MrBayes 3.1 [98]. Each gene was analyzed separately using 107 generations, sampling every 100 trees and using two parallel runs each with four chains (one cold and three heated; the default temperature for the chains was fixed). The final tree with posterior probabilities of each bipartition was constructed by discarding 40% of the sampled trees as burn-in. Finally, we compared all species pairs ofC. elongatoides,C. taenia,C. tanaitica,C. fahiraeandC. vardarensisto the outgroup (C. paludica) in MEGA 4.0 [99] and used the relative rate test to identify the rate heterogeneity of all loci [100]. Trees were visualized with the Treeview 1.6.6. program (downloaded from taxonomy.zoology. gla.ac.uk/rod/treeview.html).
The impact of various evolutionary forces may cause that gene phylogenies differ from the overall species phylogeny, which represents the evolutionary relationships of the organism as a whole [30]. We used the BEST software [62], which evaluates the most probable gene trees and gives the set of possible species trees, allowing for stochastic differences of individual gene trees resulting from coalescence in ancestral populations. We analysed two data sets (nine nuclear loci and combined nuclear and mitochondrial data), each by two parallel runs with four chains for 80 million generations and sampled every 1000 trees. We used independent gamma distributions as the prior of h, setting the effective population sizes of uniparentally inherited and haploid mtDNA loci as one fourth that of autosomal markers following [101]. The stability of posterior probabilities for individual clades were analysed during the BEST runs. The trees then obtained were summarised in MrBayes software using the ‘sumt’ command. The burnin was always set to 10 million generations. The trees were viewed in the FigTree v1.4.0 (downloaded from http://tree.bio.ed.ac.uk).
Testing of Incomplete Lineage Sorting ofC. tanaitica
mtdna vs. Hybridization Scenarios
A) Topology-Based Tests of Mito-Nuclear
Discordance. Because we observed that eight out of nine
nuclear loci were topologically concordant with the reconstructed species tree ((T,N),E), while mtDNA suggested an alternative topology, we used coalescent simulation to evaluate the probability of observed mito-nuclear conflict. This test relied on following rationale. Given the true species tree, e.g., ((A,B),C) and a single sample per species, there would be approximately 1/3 of the loci topologically concordant with the species tree if the length of the internode was close to zero [70]. The probability of encountering a topologically concordant nuclear locus (PConcord-nuc) would rise with internode length due to the occurrence of interspecific coales-cences [21]. On the other hand, the probability of observing topologically discordant mtDNA gene tree would decrease faster due to its four times smaller effective population size. The task is to evaluate the likelihood of finding topologically discordant mtDNA gene tree given that 8 out of 9 nuclear loci support an alternative topology.
We used Mesquite software [102] to simulate large number of coalescence histories (104) representing independent nuclear loci of theCobitisgenome from which we randomly sampled nine for the present study. Each simulation modeled a population of N diploid individuals (i.e. 2N gene copies) corresponding to the (A, B) internode of a hypothetical species tree with three tips. We noted, per generation, the proportion of loci where all gene copies coalesced to a single MRCA (i.e. the most recent common ancestor of all 2N copies) and calculated the cumulative probability of coalescence of nuclear locus along the internode (PCoal-nuc). When the internode is of length 0,PConcord-nucequalsMbut as the internode length increases,PCoal-nucgrowths and enlargesPConcord-nucwith the coefficient2/3(i.e.,PConcord-nucdoes not change when the coalescence occurs in the one third of loci that were initially concordant). Hence, we might evaluate thePConcord-nucper generation as (M+O6PCoal-nuc). Therefore, the probability of observing eight topologically concor-dant loci out of nine loci studied in total is binomially distributed (hereafter denoted asPbinom-nuc) and depends on the proportion of topologically concordant loci -PConcord-nuc.
Subsequently, we performed an analogous simulation for mtDNA locus with N/4 gene copies assuming a four-fold smaller effective population size for mtDNA, and calculated the per-generation probability of observing a concordant mtDNA genetic tree (PConcord-mtDNA) (Figure 3). Finally, we determined the probability of observed mitonuclear discordance as the sum over all generations of the product (Pbinom-nuc6(12PConcord-mtDNA)).
The simulations were run with N = 1000 and N = 10,000 to check the stability of the result and the internode length was expressed in coalescence-time units (t/2N). Present simulation exactly holds only when assuming single sample per species but we found this simplification useful for the purely theoretical approach becauseC. taeniaandC. tanaiticaappear monophyletic relative toC. elongatoidesin eight out of nine nuclear loci (in contrast to mtDNA). Moreover, with more samples per species, calculating the probability of topological gene tree concordance requires the knowledge of actual population sizes and speciation times, which are not knowna prioriand must be estimated from the same data as the gene trees.
B) Test Using Sequence Variability Based on Isolation Model (Speciation with No Gene Flow). Before hybridization can be accepted as a reasonable explanation for the evolution of the data, incomplete lineage sorting as an alternative cause for the incongruence among gene trees and species tree has to be eliminated [9]. We adapted the approach of Joly et al. [9] for our multilocus data showing apparent mito-nuclear conflict in C. tanaitica. Assuming ((C. taenia,C. tanaitica,)C. elongatoides) species tree we tested whether mtDNA ofC. tanaiticamight be retained from the common ancestor ofC. tanaiticaandC. elongatoides.
Hybrid Introgressions and Barriers to Gene Flow
We first used nuclear loci to estimate ancestral population sizes, hC. taenia, C. elongatoides, C. tanaiticaandhC. taenia, C. tanaitica(h= 4Nem; where mwas the mutation rate in substitutions/site/generation), and species divergence timest. C. taenia, C. elongatoides, C. tanaiticaand
t. C. taenia, C. tanaitica(t=tm; Figure 4) with the Bayesian Markov
chain Monte Carlo (MCMC) algorithms implemented in BPP Version 2.2 [12,63]. This method accommodates the species phylogeny as well as lineage sorting due to ancestral polymor-phism and allows for the incorporation of relative mutation rates among loci. We analyzed either data from three (C. taenia, C. elongatoides,C. tanaitica) or all five (C. taenia,C. elongatoides,C. tanaitica,
C. fahirae,C. vardarensis) spined loach species with fixed (C. taenia,C. tanaitica) species tree monophyly. A broadcpriorG(2, 617) similar to [2,103] was used on the population size parameters (hs), covering the highest Watterson’s [91]hestimate (hW= 0.002) for
populations in the study. The age of the root in the species tree (t0) was assigned thecpriorG(2, 167), while the other divergence time parameters were assigned the Dirichlet prior [63]; equation 2). The cprior for t was calculated from the branching event (3.31 Mya) between closely related EuropeanCobitis species [104]. We assumed an autosomal mutation rate (m) of 3.661029
estimated in vertebrates [105]. Each analysis was run three times to confirm consistency. Posterior distributions of all parameters were gener-ated by the ds program in the BPP package. The program outputs summary statistics and the histogram indicating the probability with which any parameter estimate occurs within a specified bin of values. We calculated the internode length, (c; Figure 4), by subtracting all possible combinations oftC. taenia, C. tanaiticaandt C. taenia, C. tanaitica, C. elongatoidesbins weighted by the corresponding
posterior probabilities.
We subsequently tested the probability of mtDNA discordance inC. tanaiticadue to incomplete lineage sorting by substituting the estimated ancestral population parameters into equation 5 by Rosenberg [21]. The author showed that the probability of topological discordance of a gene tree may be calculated using the number of samples in each contemporary species and the ancestral population parameter, T, referring to the duration of phases between speciation events expressed in coalescence units (in diploidsT= t/2Ne, where ‘‘t’’ is the time in generations andNeis the effective haploid population size). In our case, there were two such phases, i.e., TC. taenia, C. tanaitica, C. elongatoides - C. taenia, C. tanaiticaandTC. taenia, C. tanaitica. Given thathandcare both scaled
by the mutation rate, which can be canceled out, and that his estimated from nuclear DNA, which has four time larger effective population size compared to mtDNA, both parameters may be substituted into Rosenberg’s equation 5 in the place ofT, i.e.,TC. taenia, C. tanaitica, C. elongatoides - C. taenia, C. tanaitica=c/0.125hC. taenia, C. tanaitica, C. elongatoidesandTC. taenia, C. tanaitica=tC. taenia, C. tanaitica/
0.125hC. taenia, C. tanaitica to calculate the probability of mtDNA
topological discordance. To be conservative, we used the larger value of ancestralh(hC. taenia, C. tanaitica, C. elongatoides). To obtain
the total probability of mtDNA discordance given the observed posterior distributions, we summed the discordance probabilities of all combinations of ancestral hand c bins weighted by their posterior probabilities.
C) Test of Gene Flow Among Spined Loaches. The two-population IM [64,65] and multi-two-population IMa 2.0 [14,66] programs were used to evaluate the level of gene flow amongC. taenia,C. elongatides, andC. tanaitica. The models assume dichotomous splits of ancestral populations t generations ago; since then, descendant populations may or may not continue with a gene exchange (Figure 4). We found important to analyze mtDNA and nuclear loci separately because distinct genomic regions may have
different histories [22,23], especially in hybrid systems with reproductive strategies other than sexual reproduction [46,81].
We ran the IM forC. taenia-C. elongatoides,C. taenia–C. tanaitica, and C. elongatoides - C. tanaitica species pairs first, for mtDNA sequences only and second, for nine nuclear loci. Due to the geographic structure ofC. tanaiticafor mtDNA (Figure 2), we further ran the IM analysis for twoC. tanaitica mtDNA subsamples (the eastern and western clade) to approximate single reproductive units. We ran IMa2 with a data from three species together, using first, mtDNA locus, second, nuclear data and third, combined dataset with mtDNA and nuclear data to maximize the number of loci. We included the known ((C. taenia,C. tanaitica)C. elongatoides) species tree into the model. Based on the Akaike information criterion, we applied the Hasegawa-Kishino-Yano mutation model for all but the
Atp-BandN6loci, where the infinite site mutation model was used. Each locus was assigned an inheritance scalar (i.e., modifier of effective population size: 1.0 for nuclear genes, 0.25 for mtDNA locus). We used uniform prior distributions of parameter ranges (IM) or calculated values for the upper bounds on prior distributions according to program Documentations, and then ran MCMC simulations. We checked that the posterior distributions fell completely within the bounds of the prior distribution. If distinct peaks and/or flat tails were observed in IM, we defined the upper bounds based on the results of previous runs, assuming that the ancestral population was not greater than the combined size of two daughter populations and taking into account the upper 95% highest posterior distribution for a given parameter. We performed several independent runs of up to eight chains (IM) and up to 80 chains (IMa2) under the Metropolis coupling with a geometric heating model to improve mixing. Each chain was initiated with a burn-in period of 100,000 updates. The total length of each analysis was at least 30 million (IM) and seven million (IMa2) updates. The final runs were repeated three times with different random seed numbers. The analyses were considered to have converged on a stationary distribution if the independent runs generated similar posterior distributions. To test whether the estimated migration rate is significantly different from zero, we used the LRT test to compare the differences between likelihoods of zero migration and the best migration rate estimates.
Supporting Information
Figure S1 BEST analyses trees. Bayesian species trees (BEST) calculated from data based on (A) nine nuclear loci and (B) combined data set of nine nuclear loci and one mitochondrial marker gene.
(TIF)
Figure S2 Posterior probability distributions for divergence times from two-population IM analysis. Coalescent-based esti-mates for divergence times (scaled by mutation rate) for a split betweenC. elongatoidesandC. tanaiticainferred from mitochondrial marker gene. (A)C. elongatoidesandC. tanaitica(all individuals), (B)
C. elongatoidesandC. tanaitica(eastern clade), (B)C. elongatoidesand
C. tanaitica(western clade). (TIF)
Table S1 Estimates of parameters from two-population IM analysis.
(DOC)
Table S2 Estimates of parameters from three-population IMa2 analysis.
(DOC)