BGD
9, 13053–13084, 2012
Interannual variability of surface and bottom sediment
transport
C. Wegner et al.
Title Page
Abstract Introduction
Conclusions References
Tables Figures
◭ ◮
◭ ◮
Back Close
Full Screen / Esc
Printer-friendly Version Interactive Discussion
Discussion
P
a
per
|
Dis
cussion
P
a
per
|
Discussion
P
a
per
|
Discussio
n
P
a
per
|
Biogeosciences Discuss., 9, 13053–13084, 2012 www.biogeosciences-discuss.net/9/13053/2012/ doi:10.5194/bgd-9-13053-2012
© Author(s) 2012. CC Attribution 3.0 License.
Biogeosciences Discussions
This discussion paper is/has been under review for the journal Biogeosciences (BG). Please refer to the corresponding final paper in BG if available.
Interannual variability of surface and
bottom sediment transport on the Laptev
Sea shelf during summer
C. Wegner1, D. Bauch1,2, J. A. H ¨olemann3, M. A. Janout3, B. Heim4, A. Novikhin5, S. Kirillov5, H. Kassens1, and L. Timokhov5
1
GEOMAR Helmholtz Centre for Ocean Research, Kiel, Germany
2
Akademie der Wissenschaften und der Literatur, Mainz, Germany
3
Alfred Wegener Institute for Polar and Marine Research, Bremerhaven, Germany
4
Alfred Wegener Institute for Polar and Marine Research, Potsdam, Germany
5
State Research Center – Arctic and Antarctic Research Institute, St. Petersburg, Russia
Received: 20 August 2012 – Accepted: 3 September 2012 – Published: 20 September 2012
Correspondence to: C. Wegner ([email protected])
BGD
9, 13053–13084, 2012
Interannual variability of surface and bottom sediment
transport
C. Wegner et al.
Title Page
Abstract Introduction
Conclusions References
Tables Figures
◭ ◮
◭ ◮
Back Close
Full Screen / Esc
Printer-friendly Version Interactive Discussion
Discussion
P
a
per
|
Dis
cussion
P
a
per
|
Discussion
P
a
per
|
Discussio
n
P
a
per
|
Abstract
Sediment transport dynamics were studied during ice-free conditions under different atmospheric circulation regimes on the Laptev Sea shelf (Siberian Arctic). To study the interannual variability of suspended particulate matter (SPM) dynamics and their cou-pling with the variability in surface river water distribution on the Laptev Sea detailed
5
oceanographic, optical (turbidity and Ocean Color satellite data), and hydrochemical (nutrients, SPM, stable oxygen isotopes) process studies were carried out continuously during the summers of 2007 and 2008. Thus, for the first time SPM and nutrient varia-tions on the Laptev Sea shelf under different atmospheric forcing and the implications for the turbidity and transparency of the water column can be presented.
10
The data indicate a clear link between different surface distributions of riverine wa-ters and the SPM transport dynamics within the entire water column. The summer of 2007 was dominated by shoreward winds and an eastward transport of riverine surface waters. The surface SPM concentration on the south-eastern inner shelf was elevated, which led to decreased transmissivity and increased light absorption.
Sur-15
face SPM concentrations in the Central and Northern Laptev Sea were comparatively low. However, the SPM transport and concentration within the bottom nepheloid layer increased considerably on the entire eastern shelf. The summer of 2008 was domi-nated by offshore-winds and northwards transport of the river plume. The surface SPM transport was enhanced and extended onto the mid-shelf whereas the bottom SPM
20
transport and concentration was diminished. This study suggests that the SPM concen-tration and transport in both, the surface and bottom nepheloid layers, are associated with the distribution of riverine surface waters which are linked to the atmospheric cir-culation patterns over the Laptev Sea and the adjacent Arctic Ocean during open water season. A continuing trend toward shoreward winds, weaker stratification and higher
25
BGD
9, 13053–13084, 2012
Interannual variability of surface and bottom sediment
transport
C. Wegner et al.
Title Page
Abstract Introduction
Conclusions References
Tables Figures
◭ ◮
◭ ◮
Back Close
Full Screen / Esc
Printer-friendly Version Interactive Discussion
Discussion
P
a
per
|
Dis
cussion
P
a
per
|
Discussion
P
a
per
|
Discussio
n
P
a
per
|
1 Introduction
The Arctic summer sea-ice cover is continuously decreasing as a result of climate change, accelerating in the record minimum in September 2007 and still not recovering (e.g. Serreze et al., 2007; Comiso et al., 2008; Kwok et al., 2009). Climate models employing medium future greenhouse-gas emissions predict that the Arctic Ocean will
5
be seasonally ice-free by the end of this century (e.g. Bo ´e et al., 2009; Tietsche et al., 2011). Larger open water areas due to reduced sea-ice cover on the vast Siberian continental shelves in summer are expected to lead to increased sediment resupension and coastal erosion due to larger wind fetch and wave heights (e.g. Eicken et al., 2005; Carmack et al., 2006). Additionally, annual Arctic river discharge may increase by 10–
10
20 % under a doubled CO2scenario (ACIA, 2005), accompanied by increased loads of
freshwater (Zhang et al., 2012) as well as suspended and dissolved matter to the Arctic ecosystem. The export of turbid waters from rivers and coastal regions could enhance the delivery of nutrients to microalgal populations, but could also impair photosynthesis by scattering and absorbing sunlight (Retamal et al., 2008). A detailed understanding
15
of the pathways of suspended particulate matter (SPM) is critical in order to draw the connection between sediment dynamics, optical properties and ecosystem dynamics under a changing climate.
In summer the Laptev Sea shelf hydrography is strongly dominated by river discharge from the River Lena, with an annual freshwater input of 600–700 km3(e.g. L ´etolle et al.,
20
1993; R-ArcticNET, 2011) and functions like an estuarine system that derives its wa-ter and mawa-terial from both wa-terrestrial and oceanic sources (e.g. Wegner et al., 2005). The spatial distribution of the Lena River freshwater plume shows a strong interannual variability, mainly associated with positive and negative phases of atmospheric vorticity over the adjacent Arctic Ocean in summer (Guay et al., 2001; Dmitrenko et al., 2005;
25
BGD
9, 13053–13084, 2012
Interannual variability of surface and bottom sediment
transport
C. Wegner et al.
Title Page
Abstract Introduction
Conclusions References
Tables Figures
◭ ◮
◭ ◮
Back Close
Full Screen / Esc
Printer-friendly Version Interactive Discussion
Discussion
P
a
per
|
Dis
cussion
P
a
per
|
Discussion
P
a
per
|
Discussio
n
P
a
per
|
et al., 2008). During positive vorticity anomalies and cyclonic atmospheric circulation, the riverine surface waters are transported eastward (Dmitrenko et al., 2008). It can be assumed that the surface distribution of SPM during open water season is closely connected to the distribution of the riverine surface waters. However, the relationship between SPM, nutrients and the distribution of riverine freshwater as well as the impact
5
of turbidity on the ecosystem has not yet been established.
Even though the Arctic shelf seas are important in the context of climate change, es-pecially regarding the increased export of turbid waters onto the shelves and their effect on primary productivity, there are only few field studies, which focused on optical prop-erties, mainly in the Canadian Arctic (e.g. Vasseur et al., 2003; Retamal et al., 2007,
10
2008), the Northern North-Atlantic and in the Greenland Sea (e.g. Stramska et al., 2003; Lund-Hansen et al., 2010). Historical measurements of SPM on the Laptev Sea shelf during the open water season are limited: Anoshkin et al. (1995) and Antonow et al. (1997) used hydro-optical measuring devices, which produced only relative val-ues of SPM concentration on the Laptev Sea shelf, since in situ calibration of the
hydro-15
optical data was not available at the time. These authors and others (Hoelemann et al., 1995; Burenkov et al., 1997; Lisitsin et al., 2000; Wegner et al., 2003, 2005) described the existence of two nepheloid layers, i.e. layers with increased SPM concentration. The formation and concentration of the surface nepheloid layer are mainly related to the abundance of phytoplankton and zooplankton (e.g. Abramova and Tuschling, 2005).
20
However, in the vicinity of the Lena Delta the surface SPM concentration is strongly de-pendent on river discharge (e.g. Burenkov et al., 1997; Wegner et al., 2003). Most of the sediment transport is taking place in the bottom nepheloid layer. It is permanently present during the open water season with decreasing SPM concentrations from south to north and particles are likely introduced by river input, coastal erosion or
resuspen-25
sion of bottom material (Burenkov et al., 1997; Lisitsin et al., 2000; Wegner et al., 2003, 2005).
BGD
9, 13053–13084, 2012
Interannual variability of surface and bottom sediment
transport
C. Wegner et al.
Title Page
Abstract Introduction
Conclusions References
Tables Figures
◭ ◮
◭ ◮
Back Close
Full Screen / Esc
Printer-friendly Version Interactive Discussion
Discussion
P
a
per
|
Dis
cussion
P
a
per
|
Discussion
P
a
per
|
Discussio
n
P
a
per
|
XII and XIV expeditions in the summers 2007 and 2008 within the Russian-German co-operation “Laptev Sea System”, (Kassens et al., 2010; Fig. 1). In addition, two year-long oceanographic moorings equipped with Acoustic Doppler Current Profilers (ADCP), as well as with temperature, salinity, and turbidity recorders were deployed north of the Lena Delta to study oceanographic processes in the frontal zone between the
river-5
and shelf-dominated waters (Fig. 1). For a better spatial resolution of transparency and attenuation in the water column, we employed Ocean Color satellite data (MERIS onboard ENVISAT).
Our field studies coincided first, with the anomalous sea ice extend (Stroeve et al., 2012) and maximum Siberian river discharge (Shiklomanov and Lammers, 2010) in
10
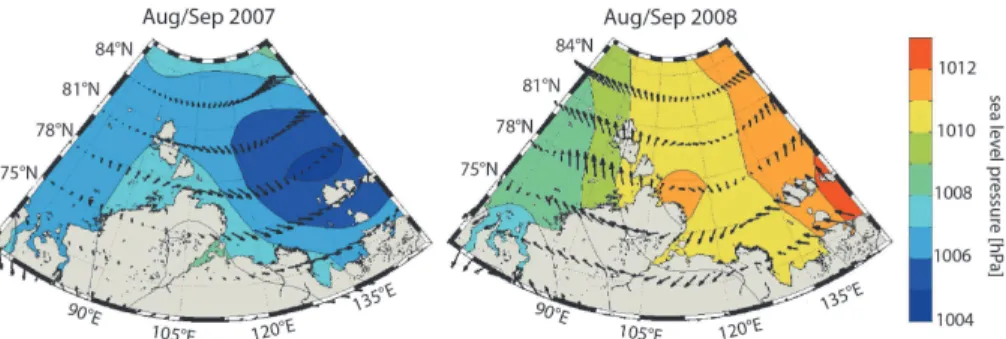
summer 2007, and second, covered two summers with opposite atmospheric circula-tion patterns over the Laptev Sea: cyclonic circulacircula-tion in summer 2007 and anticyclonic circulation in 2008 (Abrahamsen et al., 2009; Fig. 2). This unique data set enables us for the first time to analyze and discuss the interannual variations in SPM dynamics on the Laptev Sea shelf under different atmospheric forcing and their implication for
15
optical properties.
2 Material and Methods
2.1 Suspended matter and turbidity measurements
A SEAPOINT TURBIDITY METER connected to a CTD (Conductivity Temperature Depth Meter; SBE19plus, Seabird, USA) was used in order to collect water column
tur-20
bidity, salinity, and temperature measurements at a total of 177 stations during TRANS-DRIFT XII and XIV expeditions in August/September 2007 and 2008. The turbidity me-ter emits light of 880 nm wavelength with a sampling rate of 10 s−1. It detects light scattered by particles within the water column and generates an output voltage pro-portional to particles in the water column. The output is given in Formazine Turbidity
25
BGD
9, 13053–13084, 2012
Interannual variability of surface and bottom sediment
transport
C. Wegner et al.
Title Page
Abstract Introduction
Conclusions References
Tables Figures
◭ ◮
◭ ◮
Back Close
Full Screen / Esc
Printer-friendly Version Interactive Discussion
Discussion
P
a
per
|
Dis
cussion
P
a
per
|
Discussion
P
a
per
|
Discussio
n
P
a
per
|
samples within the upper 1.50 m may be biased by air bubbles (Johnson et al., 2000; Puleo et al., 2006) and were hence discarded.
A total of 434 water samples of 0.5 l each were collected from different water depths to obtain the SPM concentrations by using the traditional filtering and weighing proce-dures and to calibrate the optical backscatter. All SPM concentrations obtained from
5
water samples (SPMfilter)≤0.3 mg l −1
were set to 0.3 mg l−1, as the elutable portion of the used filters (MILLIPORE Durapore membrane filters 0.45 microns) is<0.3 mg l−1. All turbidity measurements were correlated with corresponding in situ water samples to obtain accuracy by taking the effects of different mineralogy, varying particle darkness, and salinity of ambient water on the response of the turbidity meter into account (Maa
10
et al., 1992; Sutherland et al., 2000).
Additionally the ADCP’s echo intensity of the bottom-mooring stations ANABAR and KHATANGA (see below) have been used as a relative measure for SPM concentration with increased echo intensity indicating increased SPM concentration (e.g. Gartner and Cheng, 2001; Wegner et al., 2006). As the intensity of the backscattered
acous-15
tic signal (echo intensity) provides information on particle concentration, ADCPs have gained increasing acceptance for the measurements of SPM transport dynamics (e.g. Holdaway et al., 1999; Rose and Thorne, 2001; Wegner et al., 2006).
2.2 Current measurements and the estimation of threshold current velocity
We analyzed current speed and direction for Septembers 2007 and 2008, obtained with
20
downward-looking ADCPs (WH-Sentinel 1200 kHz, RD-Instruments) at the bottom-mooring stations ANABAR and KHATANGA (Kassens at al., 2010). Current profiles were collected in 30 min intervals and a bin size of 0.2 m, and resolved the depths between 27.42–31.62 m (ANABAR) and 38.42–42.62 m (KHATANGA) in 2007 and be-tween 28.11–32.71 m (ANABAR) and 38.11–42.71 m (KHATANGA) in 2008. For a
de-25
BGD
9, 13053–13084, 2012
Interannual variability of surface and bottom sediment
transport
C. Wegner et al.
Title Page
Abstract Introduction
Conclusions References
Tables Figures
◭ ◮
◭ ◮
Back Close
Full Screen / Esc
Printer-friendly Version Interactive Discussion
Discussion
P
a
per
|
Dis
cussion
P
a
per
|
Discussion
P
a
per
|
Discussio
n
P
a
per
|
To examine the implications of currents for sediment transport the ADCP data of the long-term mooring stations ANABAR and KHATANGA respectively were used to estimate the threshold current velocity for incipient grain motion (ucr):
ucr=7
z
d50 1/7
(g(s−1)d50θcr)1/2
wherez is the depth of flow,d50 the median grain diameter,g the acceleration due to 5
gravity,sis the relative density, andθcrthe threshold shields parameter by Soulsby and
Whitehouse (1997). To estimateucr, grain-size characteristics of surface samples were
used (Table 1) according to Lindemann (1994).
2.3 Oxygen and silicate measurements
Water sampling for silicate (Si) and dissolved oxygen (DO) concentration was carried
10
out with Niskin bottles. During both expeditions water samples for DO concentration of 100 ml each were subsampled into glass bottles, fixed by sequential adding of 1 ml of manganese chloride and 1 ml of potassium iodide/sodium hydroxide solution. The sample was mixed until the evenly distributed precipitate was formed. After precipi-tating, it was dissolved by the addition of 2 ml of sulfuric acid. The DO content was
15
determined by titration with sodium thiosulphate using automatic burette ABU-80 fol-lowing the modified Winkler method (Oradovsky, 1993).
During TRANSDRIFT XII in summer 2007 water samples for silicate were subsam-pled in 50 ml plastic bottles, frozen under −20◦N and analyzed photometrical with
a SKALAR Sun Plus nutrient autoanalyzer (in range: 2–100 ppb) in the Otto-Schmidt
20
Laboratory, St. Petersburg, Russia, within one month. During TRANSDRIFT XIV sili-cate water samples were subsampled in 125-ml plastic bottles, added to Nessler cylin-ders at 35 ml for silicates analysis. In silicates samples 1 ml of mixed reagent was added first. After 10 min exposing 1 ml oxalic and 1 ml of ascorbic acid solution were added sequentially to the sample. Samples were analyzed after a 30 min exposure with
25
BGD
9, 13053–13084, 2012
Interannual variability of surface and bottom sediment
transport
C. Wegner et al.
Title Page
Abstract Introduction
Conclusions References
Tables Figures
◭ ◮
◭ ◮
Back Close
Full Screen / Esc
Printer-friendly Version Interactive Discussion
Discussion
P
a
per
|
Dis
cussion
P
a
per
|
Discussion
P
a
per
|
Discussio
n
P
a
per
|
2.4 Riverine fraction of sea water
Water sampling for stable oxygen isotope (δ18O) was conducted with Niskin bottles in parallel to hydrochemical sampling. Sampling procedure and data analysis are de-scribed in detail by Bauch et al. (2010, 2012). The combined interpretation of δ18O composition of the water and salinity allows quantifying the different freshwater
contri-5
butions in polar regions, i.e. river water and sea-ice (Bauch et al., 1995). Both δ18O and salinity are conservative tracers only altered by phase transitions. River water in the Arctic is highly depleted in its δ18O stable oxygen isotope composition (Cooper et al., 2008) relative to marine waters. The contribution of sea-ice processes can be separated from any mixture between marine and river water since it strongly influences
10
salinity whereas theδ18O signal remains nearly unaltered (Melling and Moore, 1995). The river water and sea-ice meltwater contributions can be quantified by applying a mass-balance calculation, which has been carried out in numerous studies in Arctic Ocean basins (e.g. ¨Ostlund and Hut, 1984; Bauch et al., 1995; Ekwurzel et al., 2001; Yamamoto-Kawai et al., 2008) and shelf regions (Macdonald et al., 1995; Cooper et al.,
15
1997; Bauch et al., 2005). Thereby it is assumed that each sample is a mixture between marine water (fmar), river-runoff(fr) and sea-ice meltwater (fi). Based on measurement
precision and range of endmember values calculated river water fractions are derived within±1 %. For further details on the method and selection of endmembers refer to
Bauch et al. (2010).
20
2.5 Ocean color satellite measurements
For summer 2007 and 2008 ENVISAT-MERIS data of areas with minimum cloud cov-erage were processed towards optical higher level parameters using Beam-Visat4.9© and the MERIS case2 regional processor (C2R). C2R uses neural network procedures for the retrieval of the atmospherically corrected water leaving reflectance and to derive
25
BGD
9, 13053–13084, 2012
Interannual variability of surface and bottom sediment
transport
C. Wegner et al.
Title Page
Abstract Introduction
Conclusions References
Tables Figures
◭ ◮
◭ ◮
Back Close
Full Screen / Esc
Printer-friendly Version Interactive Discussion
Discussion
P
a
per
|
Dis
cussion
P
a
per
|
Discussion
P
a
per
|
Discussio
n
P
a
per
|
dissolved organic matter). The calculated optical MERIS C2R parameters such as min-imum attenuation within the Photosynthetically Active Radiation (PAR), wavelength re-gion,kmin, and Z90, over which the seawater layer contributes 90 % of the radiant
en-ergy emerging from the sea (Gordon and MacCluney, 1975), are useful indicators for transmissivity. For a detailed description of the ocean color satellite measurements
5
refer to Heim et al. (2012).
3 Results
3.1 Distribution of the river plume and associated SPM and nutrient dispersion
The surface salinity of the Laptev Sea shelf is strongly influenced by the high
fresh-10
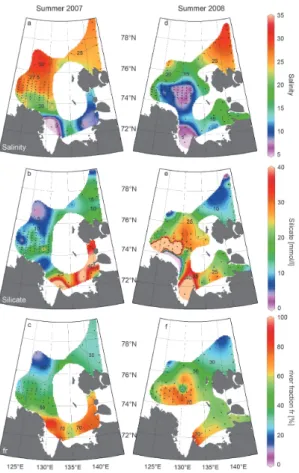
water discharge of the River Lena and therefore comparably low throughout the shelf. Surface silicate concentrations>10 µmol l−1are generally considered a good indicator for the distribution of riverine waters during ice free conditions (Rusanov et al., 1979; Pivovarov et al., 2004). According to the surface silicate distribution the river plume in 2007 was limited to latitudes between 75.5◦N on the eastern shelf and 74.3◦N north
15
of the Lena Delta (Fig. 3b). However, during summer 2008 surface silicate concen-trations >10 µmol l−1 were observed as far north as 77.5◦N on the Eastern Laptev Sea shelf and 76.5◦N on the shelf area north of the Lena Delta (Fig. 3e). As an al-ternative proxy for the identification of riverine waters in the Laptev Sea we applied theδ18O/salinity-based water mass analysis, a well-established method for the Laptev
20
Sea shelf (Bauch et al., 2005, 2009, 2010). A river water fraction of about 50 % in the surface waters marks the boundary between river- and shelf-dominated waters. Ac-cordingly Lena River waters spread no further than 74.3◦N in summer 2007 (Fig. 3c). In 2008 waters containing river water fractions<50 % spread up to 76.5◦N on the east-ern shelf and up to 75.3◦N in the Central Laptev Sea (Fig. 3f). Thus, silicate andδ18O
25
BGD
9, 13053–13084, 2012
Interannual variability of surface and bottom sediment
transport
C. Wegner et al.
Title Page
Abstract Introduction
Conclusions References
Tables Figures
◭ ◮
◭ ◮
Back Close
Full Screen / Esc
Printer-friendly Version Interactive Discussion
Discussion
P
a
per
|
Dis
cussion
P
a
per
|
Discussion
P
a
per
|
Discussio
n
P
a
per
|
with further northwards spreading of the river plume during summer 2008 compared to 2007.
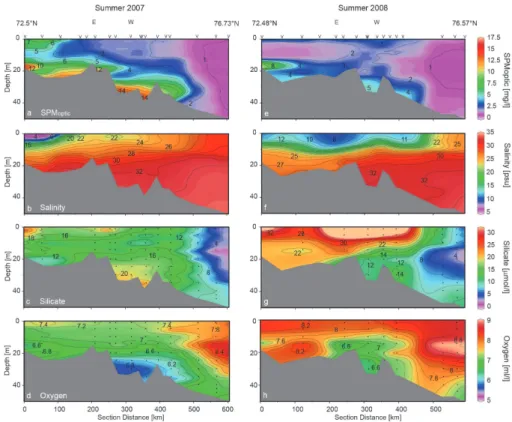
We used our vertically interpolated SPM concentration data to map the extent and thickness of the Lena river plume, characterized by SPM concentrations of>1 µmol l−1. In 2007, the turbid surface waters of the Lena river plume with a maximum SPM
con-5
centration of 9.1 mg l−1 showed a northwards extent to∼75◦N, with a 10.9 m surface nepheloid layer in the vicinity of the Lena Delta (Fig. 4a). In 2008, the turbid surface waters extended further north (76.8◦north of the Lena Delta and 77.8◦N on the eastern shelf), although the surface nepheloid layer was thinner (2.6 m) and SPM concentra-tions lower (4.2 mg l−1) than in 2007 (Fig. 4e).
10
The bottom nepheloid layer during summer 2007 was very prominent with a max-imum thickness of 11.4 m (Fig. 4a). On the eastern inner shelf maxmax-imum bottom SPM concentrations were 59 mg l−1 and coincided with a maximum Si concentration of 31.4 µmol l−1 and a minimum DO-concentration of 5 ml l−1(Fig. 4a, c, d). A second bottom SPM maximum with concentrations up to 17.2 mg l−1 was observed within the
15
frontal zone between the riverine surface waters and the shelf waters, coinciding with maximum in Si-concentration of 24.8 µmol l−1 and DO-minimum of 5.5 ml l−1 (Fig. 4a– d). During summer 2008, the bottom nepheloid layer reached a thickness of up to 10.6 m, although SPM concentrations were four times lower (Fig. 4e). The first maxi-mum of 12.2 mg l−1, coinciding with a maximum in Si-concentration of 32 µmol l−1 and
20
a minimum in DO-concentration of 5 ml l−1, was observed on the eastern inner shelf (Fig. 4e, g, h). A second bottom SPM maximum of 7.06 mg l−1, coinciding with max-imum Si-concentrations of 29 µmol l−1 and minimum DO-concentrations of 6.1 ml l−1 was measured beneath the riverine surface waters north of the Lena Delta (Fig. 4e–h).
3.2 Interannual variability of optical water column properties
25
BGD
9, 13053–13084, 2012
Interannual variability of surface and bottom sediment
transport
C. Wegner et al.
Title Page
Abstract Introduction
Conclusions References
Tables Figures
◭ ◮
◭ ◮
Back Close
Full Screen / Esc
Printer-friendly Version Interactive Discussion
Discussion
P
a
per
|
Dis
cussion
P
a
per
|
Discussion
P
a
per
|
Discussio
n
P
a
per
|
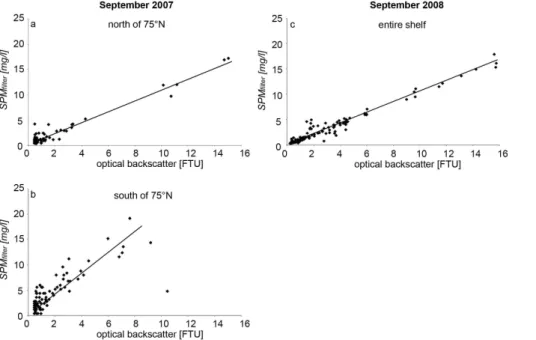
(Burenkov et al., 1997; Lisitsin et al., 2000; Wegner et al., 2003; Fig. 5). In summer 2008, the linear relation between the optical backscatter intensityIin SPM concentra-tion (SPMoptic) can be expressed as: SPMoptic=0.683+0.739I. This regression
cor-responds to measurements from summer 2000 (Wegner et al., 2003), a summer with prevailing southerly winds and a northward transport of the Lena freshwater plume
sim-5
ilar to 2008. However, during the cyclonic summer 2007 characterized by the eastward spreading of riverine waters the linear relation betweenI and SPMoptic concentration
was different for stations south and north of 75◦N (Fig. 5a, b): SPMoptic=0.456+0.867I
for stations north of 75◦N and SPMoptic=0.858+1.772Ifor stations south of 75 ◦
N. The slope of the correlation for stations south of 75◦N is two times steeper than the slope
10
of the correlation found north of 75◦N. In general, the intensity of the backscattered infrared light of the turbidity meter is primarily a function of SPM concentration in front of the sensor (e.g. Hatcher et al., 2000; Hatje et al., 2001). Besides SPM concentration sediment size has a secondary effect on the backscatter signal (e.g. Sutherland et al., 2000; Downing, 2006). For silty sediments, the optical backscatter is about one tenth
15
higher than for sandy sediments (Sutherland et al., 2000; Downing, 2006). The absorp-tion of light by colored dissolved organic matter (CDOM) might addiabsorp-tionally affect the measured voltage of the turbidity meters due to the reduced light energy incident on scattering particles as well as backscattered intensity (Downing, 2006). During sum-mer 2007, the turbid Lena River waters were spread only on the inner eastern shelf,
20
whereas in summer 2008 these waters were spread over a larger area (Fig. 4a, e). It can be assumed that the eastward transport of the turbid freshwater plume during summer 2007 lead to more turbid waters with potentially higher grain sizes and there-fore different optical properties on the inner shelf than on the shelf region north of 75◦N. This explains why it is necessary to apply two different algorithms for the
in-25
ner and outer shelf regions during cyclonic atmospheric conditions and an associated eastward transport of the freshwater plume.
BGD
9, 13053–13084, 2012
Interannual variability of surface and bottom sediment
transport
C. Wegner et al.
Title Page
Abstract Introduction
Conclusions References
Tables Figures
◭ ◮
◭ ◮
Back Close
Full Screen / Esc
Printer-friendly Version Interactive Discussion
Discussion
P
a
per
|
Dis
cussion
P
a
per
|
Discussion
P
a
per
|
Discussio
n
P
a
per
|
masses (kmin≤0.3 m −1
) and well-developed turbidity fringes around the Lena River delta and the shallows (Fig. 6a). In contrast, in 2008, the optical water masses in the whole Laptev Sea Region are considerably less transparent (kmin∼0.5 m
−1
; Fig. 6b).
3.3 Bottom currents and echo intensity
During September 2007, mooring ANABAR was located directly within the frontal zone
5
between river- and shelf-dominated waters, while in 2008 this region was entirely dom-inated by Lena River waters. Mooring KHATANGA was located west of the riverine surface waters during both years. Generally, peaks in echo intensity coincided with peaks in currents at both mooring stations. Current velocities and echo intensity at ANABAR were higher compared to KHATANGA as seen in both maximum and mean
10
values during both years (Table 2). During September 2007 currents and echo inten-sity were stronger than during 2008 (Table 2, Fig. 7). Maximum current speeds of 59.8 cm s−1were recorded simultaneously with maximum in echo intensity at ANABAR during September 2007 following a storm event (Fig. 7). This was the only period when currents exceeded critical shear stress velocity and therefore resuspension of bottom
15
material took place. Thus it can be assumed that sediment entrainment due to resus-pension of bottom material takes place mainly after storm events. The predominant mode of transport in this area is suspended load. Only at ANABAR in 2008 a peak in echo intensity was detected when bottom currents were low (Fig. 7b). Probably turbid bottom waters were advected from the inner shelf area causing higher SPM
concen-20
tration in the bottom nepheloid layer.
4 Discussion
During the summer 2007, the surface salinity over the Eastern Laptev Sea shelf ex-ceeded the mean by a factor of∼2 (Dmitrenko et al., 2010), likely associated with the eastward wind-forced diversion of the Lena River freshwater plume because of a low
BGD
9, 13053–13084, 2012
Interannual variability of surface and bottom sediment
transport
C. Wegner et al.
Title Page
Abstract Introduction
Conclusions References
Tables Figures
◭ ◮
◭ ◮
Back Close
Full Screen / Esc
Printer-friendly Version Interactive Discussion
Discussion
P
a
per
|
Dis
cussion
P
a
per
|
Discussion
P
a
per
|
Discussio
n
P
a
per
|
sea level-pressure cell centered over the Central Laptev Sea. The mean (0–15 m) salin-ity along the cross-shelf transect was 24.6 in 2007 and 17.9 in 2008 (Fig. 4), while the lower layer (>20 m) salinities were nearly similar, hence stratification in 2008 was far stronger than in 2007. As opposed to 2007, when only a small proportion of riverine waters was transported onto the mid- and outer shelf, much of the shelf was dominated
5
by the Lena River plume in summer 2008. This is consistent with statistical evaluations of historical ocean data by Dmitrenko et al. (2008) who suggest that approximately 500–600 km3 of freshwater is lost from the Eastern Siberian shelf towards the deep Arctic Ocean through the Northeastern Laptev Sea during anticyclonic summers. Dur-ing cyclonic summers it is assumed that the freshwater is equally distributed between
10
the Laptev and the East Siberian seas.
The transport of SPM in the upper water column is clearly linked to the distribution of the riverine surface waters. This is reflected in the overall SPM surface concentration of the surface nepheloid layer as well as in the spatial distribution of turbid waters. In general, the surface nepheloid layer on the Laptev Sea shelf is mainly related to the
15
abundance of phytoplankton and zooplankton (e.g. Abramova and Tuschling, 2005). However, in the river-dominated shelf region the surface layer is composed of both, SPM and algal material (Burenkov et al., 1997; Wegner et al., 2003). Direct (SPMfilter)
as well as indirect SPM measurements (SPMoptic) clearly reflect the same
concentra-tion and distribuconcentra-tion patterns. SPMoptic concentration in the surface layer (upper 12 m)
20
on the inner shelf was considerably higher in 2007 and exceeded the mean SPMoptic
concentration in 2008 by a factor of 2 (Fig. 4a, e). But on the other hand the surface nepheloid layer in the anticyclonic summer 2008 reached further north suggesting an increased surface SPM transport onto the mid-shelf (Fig. 4a, e).
Noticeably, maximum near bottom current speeds in 2007 were twice as high as in
25
2008 exceedingucrand causing resuspension of bottom material (Table 2, Fig. 2). The
mean SPMoptic concentration in the bottom nepheloid layer (the lowest 12 m) along the
BGD
9, 13053–13084, 2012
Interannual variability of surface and bottom sediment
transport
C. Wegner et al.
Title Page
Abstract Introduction
Conclusions References
Tables Figures
◭ ◮
◭ ◮
Back Close
Full Screen / Esc
Printer-friendly Version Interactive Discussion
Discussion
P
a
per
|
Dis
cussion
P
a
per
|
Discussion
P
a
per
|
Discussio
n
P
a
per
|
characteristic for resuspension of bottom material is taking place. Furthermore the time-series of echo intensity from the ADCPs show sudden increases in echo intensity when current velocities peak, which is most likely associated with the resuspension of bottom material. Thus it can be assumed that sediment entrainment due to resus-pension of bottom material takes place mainly after storm events. Additionally lateral
5
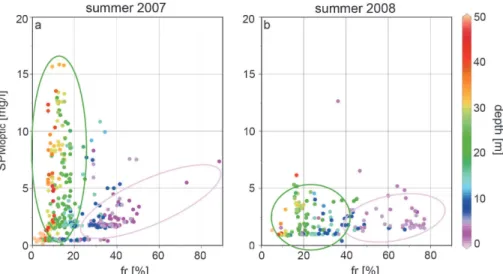
advection of turbid bottom waters from the inner shelf seems to increase the SPM con-centration within the bottom nepheloid layer as well. Furthermore, the overall proportion of resuspended material in the bottom layer was larger during 2007 compared to sum-mer 2008 as well as the maximum SPMoptic concentration, which exceeded the 2008
measurements with concentrations up to three times higher in 2007 (Fig. 8). Therefore
10
it appears likely that both the surface and the bottom SPM transport are tightly cou-pled to the surface distribution of riverine waters on the Laptev Sea shelf. During the cyclonic summer 2007, turbid mixing, resuspension and enhanced transport of bottom material took place associated to the eastwards spreading of the freshwater plume. During the anticyclonic summer 2008 the northwards spreading of riverine waters and
15
the resulting stronger stratification on the Central Laptev Sea shelf seem to prevent turbulent mixing and thus limits bottom SPM transport.
In general, the surface salinity east of the Lena Delta, is assumed to be relatively sta-ble with a standard deviation between 2 and 4 psu and invariant to atmospheric forcing and unaffected by river runoff on an annual basis (Dmitrenko et al., 2005). However
20
the surface SPM distribution and concentration show interannual variations also on the south eastern shelf: the surface SPMoptic concentrations are higher during the cyclonic
summer 2007 (Fig. 8). Nevertheless the difference in 2007 and 2008 in the SPM con-centration within both, the surface and the bottom nepheloid layers, are highest on the Central Laptev Sea shelf in terms of SPM concentration (Fig. 4a, e) coinciding with
25
BGD
9, 13053–13084, 2012
Interannual variability of surface and bottom sediment
transport
C. Wegner et al.
Title Page
Abstract Introduction
Conclusions References
Tables Figures
◭ ◮
◭ ◮
Back Close
Full Screen / Esc
Printer-friendly Version Interactive Discussion
Discussion
P
a
per
|
Dis
cussion
P
a
per
|
Discussion
P
a
per
|
Discussio
n
P
a
per
|
The different SPM transport dynamics have impact on the optical properties of the water column revealed in the turbidity measurements as well as in the Ocean Colour MERIS satellite data, with higher turbidity, less transmissivity and increased light ab-sorption on the eastern inner shelf during cyclonic summers. Future multi-disciplinary studies in combination with remote sensing will improve our knowledge on the impact
5
of the optical properties and improve the algorithms to translate remote sensing data in e.g. clorophyll SPM and CDOM (Colored Dissolved Organic Matter) concentrations (see also Heim et al., 2012).
Sediment trap studies in the Northern Laptev Sea (Lalande et al., 2009) showed that an input from the Lena River was negligible in 2007, while a Lena River signal was
de-10
tected in 2006, a summer with dominantly anticyclonic conditions. Lalande et al. (2009) suggest that the river signal could have been masked in 2007 by high POC fluxes as-sociated with ice melt and enhanced primary production. However, our data show that the general hydrographic situation on the shelf determines the distribution and poten-tial transport of river dominated water and SPM to the outer shelf. Thus it is probably
15
not only the variability in POC fluxes but rather the very limited northward transport of material onto the outer shelf due to the predominantly eastward transport during the cyclonic summer 2007 in contrast to a likely northward transport of material during the anticyclonic summer 2006. Sediment trap studies from the Lomonosov Ridge (Fahl and N ¨othig, 2007) during the anticyclonic summer of 1996 (Guay et al., 2001), also showed
20
a clear Lena River signal with a peak in August which supports the assumption that more SPM is carried in the surface nepheloid layer onto the mid- and outer shelf under anticyclonic atmospheric circulation patterns.
5 Summary
Sampling carried out during two Laptev Sea summer expeditions in 2007 and 2008
25
BGD
9, 13053–13084, 2012
Interannual variability of surface and bottom sediment
transport
C. Wegner et al.
Title Page
Abstract Introduction
Conclusions References
Tables Figures
◭ ◮
◭ ◮
Back Close
Full Screen / Esc
Printer-friendly Version Interactive Discussion
Discussion
P
a
per
|
Dis
cussion
P
a
per
|
Discussion
P
a
per
|
Discussio
n
P
a
per
|
years, with predominantly shoreward-directed winds (cyclonic) in 2007 and northwards winds (anticyclonic) in 2008, which had immediate consequences for the distribution of the Lena freshwater plume and the sediment dynamics in the surface and bottom nepheloid layers. During summers with cyclonic atmospheric circulation patterns and an eastward transport of the Lena freshwater plume it can be assumed that the surface
5
SPM concentration on the south-eastern shelf is increased, causing less transmissiv-ity and probably increased light absorption, while surface SPM soncentrations in the Central and Northern Laptev Sea are relatively low. Due to a weakly stratified water col-umn and higher bottom current velocities the bottom transport of SPM as well as the SPM concentration within the bottom nepheloid layer can be expected to be
consid-10
erably higher. During anticyclonic summers the surface SPM transport increased and reaches far out onto the middle-shelf, whereas the bottom transport and SPM concen-tration is diminished. Therefore we assume that the SPM dynamics in both, the surface and bottom nepheloid layers are associated with the distribution of river dominated sur-face waters and thus linked to the prevailing atmospheric circulation patterns over the
15
Laptev Sea and the adjacent Arctic Ocean during summer.
During the last two decades there is a positive trend in mean cyclone depth and radius over the Eurasian Basin (Simmonds and Keay, 2009), inducing cyclonic circula-tion patterns and an eastward transport of the riverine waters on the Laptev Sea shelf. A continuation of this trend might not only impact the sediment budget but could also
20
have negative consequences for the sensitive ecosystem on this shelf due to changes in nutrient availability and light penetration.
Acknowledgements. We thank the scientists, crew members and captains of R/VIvan Petrov
for their support during the expeditions. The study is part of the joint Russian-German project “Laptev Sea System”, financed by German and Russian ministries (BMBF and MINPROM-25
NAUKI).
The service charges for this open access publication have been covered by a Research Centre of the Helmholtz Association.
BGD
9, 13053–13084, 2012
Interannual variability of surface and bottom sediment
transport
C. Wegner et al.
Title Page
Abstract Introduction
Conclusions References
Tables Figures
◭ ◮
◭ ◮
Back Close
Full Screen / Esc
Printer-friendly Version Interactive Discussion
Discussion
P
a
per
|
Dis
cussion
P
a
per
|
Discussion
P
a
per
|
Discussio
n
P
a
per
|
References
Abrahamsen, E. P., Meredith, M. P., Falkner, K. K., Torres-Valdes, S., Leng, M. J., Alkire, M. B., Bacon, S., Laxon, S. W., Polyakov, I., and Ivanov, V.: Tracer-derived freshwater composition of the Siberian contintal shelf and slope following the extreme Arctic summer of 2007, Geophys. Res. Lett., 36, L07602, doi:10.1029/2009GL037341, 2009.
5
Abramova, E., and Tuschling, K.: A 12-yr study of the seasonal and interannual dynamics of mesozooplankton in the Laptev Sea: significance of salinity regime and life cycle patterns, Global Planet. Change, 48, 141–164, 2005.
ACIA: Arctic Climate Impact Assessment – Scientific Report, Cambridge University Press, Cambridge, 2005.
10
Anoshkin, A. F., Popov, I. K., Ushakov, I. E., and TRANSDRIFT II Shipboard Scientific Party: Hydro optical measurements in the Laptev Sea: spatial distributions of light attenuation and chlorophyll fluorescence, Rep. Pol. Res., 176, 178–186, 1995.
Antonow, M., F ¨urst, B., Haase, V., Strobl, C., and Thiede, J.: Multiprobe suspension and current speed measurements: aspects of sediment dynamics during free-up studies in the Laptev 15
Sea, Rep. Pol. Res., 248, 75–79, 1997.
Bauch, D., Schlosser, P., and Fairbanks, R. F.: Freshwater balance and the sources of deep and bottom waters in the Arctic Ocean inferred from the distribution of H218O, Progr. Ocean., 35, 53–80, 1995.
Bauch, D., Erlenkeuser, H., and Andersen, N.: Water mass processes on Arc-20
tic shelves as revealed from 18O of H2O, Global Planet. Change, 48, 165–174, doi:10.1016/j.gloplacha.2004.12.011, 2005.
Bauch, D., Dmitrenko, I. A., Wegner, C., Hoelemann, J. A., Kirillov, S. A., Timokhov, L. A., and Kassens, H.: Exchange of Laptev Sea and Arctic Ocean halocline waters in response to atmospheric forcing, J. Geophys. Res., 114, C05008, doi:10.1029/2008JC005062, 2009. 25
Bauch, D., Hoelemann, J. A., Willmes, S., Gr ¨oger, M., Novikhin, A., Nikulina, A., Kassens, H., and Timokhov, L.: Changes in distribution of brine waters on the Laptev Sea shelf in 2007, J. Geophys. Res., 115, C11008, doi:10.1029/2009GL042192, 2010.
Bauch, D., Hoelemann, J. A., Nikulina, A., Wegner, C., Janout, M., Timokhov, L., and Kassens, H.: Coupling of local sea-ice melting and river water on the Siberian shelves, in 30
BGD
9, 13053–13084, 2012
Interannual variability of surface and bottom sediment
transport
C. Wegner et al.
Title Page
Abstract Introduction
Conclusions References
Tables Figures
◭ ◮
◭ ◮
Back Close
Full Screen / Esc
Printer-friendly Version Interactive Discussion
Discussion
P
a
per
|
Dis
cussion
P
a
per
|
Discussion
P
a
per
|
Discussio
n
P
a
per
|
Bo ´e, J., Hall, A., and Qu, X.: September sea-ice cover in the Arctic Ocean projected to vanish by 2100, Nat. Geosci., 2, 341–343 doi:10.1038/ngeo467, 2009.
Burenkov, V. I., Kuptzov, V. M., Sivkov, V. V., and Shevchenko, V. P.: Spatial distribution and size composition of suspended matter in the Laptev Sea in August–September 1991, Ocean, 37, 6, 831–837, 1997.
5
Carmack, E. C., Barber, D., Christensen, J., Macdonald, R. W., Rudles, B., and Sakshaug, E.: Climate variability and physical forcing of the food webs and the carbon budget on panarctic shelves, Progr. Ocean. 71, 124–181; doi:10.1016/j.pocean.2006.10.005, 2006.
Comiso, J. C., Parkinson, C. L., Gersten, R., and Stock, L.: Accelerated decline in the Arctic sea ice cover, Geophys. Res. Lett., 35, L01703, doi:10.1029/2007GL031972, 2008.
10
Cooper, L. W., Whitledge, T. E., Grebmeier, J. M., and Weingartner, T.: The nutrient, salinity, and stable isotope composition of Bering and Chukchi seas waters in and near the Bering Strait, J. Geophys. Res., 102, 12563–12573, 1997.
Cooper, L. W., McClelland, J. W., Holmes, R. M., Raymond, P.A:, Gibson, J. J., Guay, C. K., and Peterson, B. J.: Flow-weighted values of runofftracers (δ18O, DOC, Ba, alkalinity) from 15
the six largest Arctic rivers, Geophys. Res. Lett., 35, L18606, doi:10.1029/2008GL035007, 2008.
Dmitrenko, I. A., Kirillov, S. A., Eicken, H., and Markova, N.: Wind-driven summer sur-face hydrography of the Eastern Siberian shelf, Geophys. Res. Lett., 32, L14613, doi:10.1029/2005GL023022, 2005.
20
Dmitrenko, I. A., Kirillov, S. A., and Tremblay, L. B.: The long-term and interannual variability of summer freshwater storage over the Eastern Siberian shelf: implication for climate change, J. Geophys. Res., 113, C03007, doi:10.1029/2007JC004304, 2008.
Dmitrenko, I. A., Kirillov, S. A., Krumpen, T., Makhotin, M., Abrahamsen, E. P., Willmes, S., Bloshkina, E., H ¨olemann, J. A., Kassens, H., and Wegner, C.: Wind-driven diversion of sum-25
mer river runoffpreconditions the Laptev Sea coastal polynya hydrography: evidence from summer-to winter hydrographic records of 2007–2009, Cont. Shelf Res., 30, 1656–1664, 2010.
Downing, J.: Twenty-five years with OBS sensors: the good, the bad, and the ugly, Cont. Shelf Res., 26, 2299–2318, doi:10.1016/j.csr.2006.07.018, 2006.
30
BGD
9, 13053–13084, 2012
Interannual variability of surface and bottom sediment
transport
C. Wegner et al.
Title Page
Abstract Introduction
Conclusions References
Tables Figures
◭ ◮
◭ ◮
Back Close
Full Screen / Esc
Printer-friendly Version Interactive Discussion
Discussion
P
a
per
|
Dis
cussion
P
a
per
|
Discussion
P
a
per
|
Discussio
n
P
a
per
|
Ekwurzel, B., Schlosser, P., Mortlock, R., and Fairbanks R.: River runoff, sea ice meltwater, and Pacific water distribution and mean residence times in the Arctic Ocean, J. Geophys. Res., 106, 9075–9092, 2001.
Fahl, K. and N ¨othig, E.-M.: Lithogenic and biogenic particle fluxes on the Lomonosov Ridge (Central Arctic Ocean) and their relevance for sediment accumulation: vertical vs. lateral 5
transport, Deep-Sea Res. I, 54, 1256–1272; doi:10.1016/j.dsr.2007.04.014, 2007.
Gartner, J. W. and Cheng, R. T.: The promises and pitfalls of estimating total suspended solids based on backscatter intensity from Acoustic Doppler Profilers, Fed. Interagency Sed. Conf., Reno, III-119-III-126, 2001.
Gordon, H. R. and McCluney, W. R.: Estimation of the depth of sunlight penetration in the sea 10
for remote sensing, Appl. Optics, 14, 413–416, 1975.
Guay, C. K., Falkner, R. D., Muench, R. D., Mensch, M., Frank, M., and Bayer, R.: Wind-driven transport pathways for Eurasian Arctic river discharge, J. Geophys. Res., 106, 11469–11480, 2001.
Hatcher, A., Hill, P., and Macpherson, P.: Spectral optical backscatter of sand in suspension: 15
effects of particle size, composition and color, Mar. Geol. 168, 115–128, 2000.
Hatje, V., Birch, G. F., and Hill, D. M.: Spatial and temporal variability of particulate trace metals in Port Jackson Estuary, Australia. Est. Coast. Shelf Science, 53, 63–77, 2001.
Heim, B., Doerffer, R., Overduin, P. P., Hoelemann, J. A., Wegner, C., Loginova, A., Abramova, E., Martynov, F., Gienther, F., and Lantuit, H.: Ocean Colour remote sensing 20
in the Laptev Sea: evaluation and application, Biogeosciences, this volume, in preparation, 2012.
Hoelemann, J. A., Schirmacher, M., and Prange, A.: Transport and distribution of trace elements in the Laptev Sea: first results of the TRANSDRIFT expeditions, Rep. Pol. Res., 176, 297– 302, 1995.
25
Hoelemann, J. A., Kirillov, S., Klagge, T., Novikhin, A., Kassens, H., and Timokhov, L.: Near bottom water warming in the Laptev Sea in response to atmospheric and sea-ice conditions in 2007, Pol. Res., 30, 6425, doi:10.3402/polar.v30i0.6425, 2011.
Holdaway, G. P., Thorne, P. D., Flatt, D., Jones, S. E., and Prandle, D.: Comparison between ADCP and transmissometer measurements of suspended sediment concentration, Cont. 30
Shelf Res., 19, 421–441, 1999.
BGD
9, 13053–13084, 2012
Interannual variability of surface and bottom sediment
transport
C. Wegner et al.
Title Page
Abstract Introduction
Conclusions References
Tables Figures
◭ ◮
◭ ◮
Back Close
Full Screen / Esc
Printer-friendly Version Interactive Discussion
Discussion
P
a
per
|
Dis
cussion
P
a
per
|
Discussion
P
a
per
|
Discussio
n
P
a
per
|
Johnson, D. R., Asper, V., McClimans, T., and Weidemann, A.: Optical properties of the Kara Sea, J. Geophys. Res., 105, C4, 8805–8811, 2000.
Kassens, H. and Karpiy, V.: Russian-German Cooperation: The TRANSDRIFT I expedition to the Laptev Sea, Rep. Pol. Res., 151, 168 pp., 1994.
Kassens, H., H ¨olemann, J., Klagge, T., and Novikhin, A.: Russian-German Cooperation Laptev 5
Sea: Expeditions TRANSDRIFT XII, XIV, XVI, Summer 2007, 2008, 2009, unpubl. cruise report, 138 pp., 2010.
Kwok, R., Cunningham, G. F., Wensnahan, M., Rigor, I., Zwally, H. J., and Yi, D.: Thinning and volume loss of the Arctic Ocean sea ice cover: 2003–2008, J. Geophys. Res., 114, C07005, doi:10.1029/2009JC005312, 2009.
10
Lalande, C., B ´elanger, S., and Fortier, L.: Impact of decreasing sea ice cover on the vertical export of particulate organic carbon in the Northern Laptev Sea, Siberian Arctic Ocean, Geophys. Res. Lett., 36, L21604, doi:10.1029/2009GL040570, 2009.
L ´etolle, R., Martin, J. M., Thomas, A. J., Gordeev, V. V., Gusarova, S., and Sidorov, I. S.:18O abundance and dissolved silicate in the Lena delta and Laptev Sea (Russia), Mar. Chem., 15
43, 47–64, 1993.
Lindemann, F.: Sonographische und sedimentologische Untersuchungen in der Laptev-See, sibirische Arktis, Diploma Thesis, University of Kiel, 75 pp., 1994.
Lisitsin, A. P., Shevchenko, V. P., and Burenkov, V. I.: Hydrooptics und suspended matter of Arctic seas, Atmosph. Ocean. Opt., 13, 1, 61–71, 2000.
20
Lund-Hansen, L. C., Andersen, T. J., Holtegaard Nielsen, M., and Pejrup, M.: Suspended mat-ter, chl-a, CDOM, grain sizes, and optical properties in the Arctic fjord-type estuary, Kanger-lussuaq, West Greenland, during summer, Estuar. Coast., 33, 1442–1451, 2010.
Maa, J. P.-Y., Xu, J., and Victor, M.: Notes of the performance of an optical backscatter sensor for cohesive sediments, Mar. Geol., 104, 215–218, 1992.
25
Macdonald, W., Paton, D., Carmack, E., and Omstedt, A.: The freshwater budget and under-ice spreading of Mackenzie River water in the Canadian Beaufort Sea based on salinity and
18
O/16O measurements in water and ice, J. Geophys. Res., 100, 895–919, 1995.
Melling, H. and Moore, R.: Modification of halocline source waters during freezing on the Beau-ford Sea shelf: evidence from oxygen isotopes and dissolved nutrients, Cont. Shelf Res., 15, 30
89–113, 1995.
BGD
9, 13053–13084, 2012
Interannual variability of surface and bottom sediment
transport
C. Wegner et al.
Title Page
Abstract Introduction
Conclusions References
Tables Figures
◭ ◮
◭ ◮
Back Close
Full Screen / Esc
Printer-friendly Version Interactive Discussion
Discussion
P
a
per
|
Dis
cussion
P
a
per
|
Discussion
P
a
per
|
Discussio
n
P
a
per
|
¨
Ostlund, H. and Hut, G.: Arctic Ocean water mass balance from isotope data, J. Geophys. Res., 89, 6373–6381, 1984.
Pivovarov, S., H ¨olemann, J. A., Kassens, H., Piepenburg, D., and Schmid, M. K.: Laptev and East Siberian seas; in: The Sea, edited by: Robinson, A. R. and Brink, K. H., Harvard Uni-versity Press, 14, 1107–1133, 2004.
5
Puleo, J. A., Johnson, R. V., Butt, T., Kooney, T. N., and Holland, K. T.: The effects of air bubbles on optical backscatter sensors, Mar. Geol., 230, 87–97, 2006.
R-ArcticNET: A Regional, Electronic, Hydrometric Data Network for Russia: Russian Daily Discharge Data from NSF-funded UCLA/UNH project, Station data at Kusur, available at: http://rims.unh.edu/data/station/station.cgi?station=6342, http://www.r-arcticnet.sr.unh.edu/ 10
v4.0/index.html, 2011.
Retamal, L., Vicent, W. F., Martineau, C., and Osburn, C. L.: Comparison of the optical prop-erties of dissolved organic matter in two river-influenced coastal regions of the Canadian Arctic, Est. Coast. Shelf Sci., 72, 1–2, 261–272, doi:10.1016/j.ecss.2006.10.022, 2007. Retamal, L., Bonilla, S., and Vincent, W. F.: Optical gradients and phytoplankton production in 15
the Mackkenzie River and the coastal Beaufort Sea, Pol. Biol., 31, 363–379, 2008.
Rose, C. P. and Thorne, P. D.: Measurements of suspended sediment transport parameters in a tidal estuary, Cont. Shelf Res., 21, 1551–1575, 2001.
Rusanov, V. P., Yakolev, N. I., and Buinevich, A. G.: The hydrochemical regime of the Arctic Ocean, proceedings of AARI, 355, 1–144, 1994 (in Russian).
20
Serreze, M. C., Holland, M. M., and Stroeve, J.: Perspectives on the Arctic’s shrinking sea-ice, Science 315, 1533–1536, 2007.
Shiklomanov, A. I. and Lammers, R. B.: Record Russian river discharge in 2007 and the limits of analysis, Environ. Res. Lett., 4, 045015, doi:10.1088/1748-9326/4/4/045015, 2009. Simmonds, I. and Keay, K.: Extraordinary September Arctic sea ice reductions and their 25
relationships with storm behavior over 1979–2008, Geophys. Res. Lett., 36, L19715, doi:10.1029/2009GL039810, 2009.
Soulsby, R. L.: Dynamics of Marine Sands, Thomas Telford Publications, 249 pp., 1997. Soulsby, R. L. and Whitehouse, R. J. W.: Threshold of Sediment Motion in Coastal
Environ-ments, Pacific Coasts and Ports ’97, Christchurch, 149–154, 1997. 30
BGD
9, 13053–13084, 2012
Interannual variability of surface and bottom sediment
transport
C. Wegner et al.
Title Page
Abstract Introduction
Conclusions References
Tables Figures
◭ ◮
◭ ◮
Back Close
Full Screen / Esc
Printer-friendly Version Interactive Discussion
Discussion
P
a
per
|
Dis
cussion
P
a
per
|
Discussion
P
a
per
|
Discussio
n
P
a
per
|
Stroeve, J., Serreze, M. C., Holland, M. M., Kay, J. E., Malanik, J., and Barrett, A. P.: The Arctic’s rapidly shrinking sea ice cover: a research synthesis, Climatic Change, 110, 3–4, 1005–1027, doi:10.1007/s10584-011-0101-1, 2012.
Sutherland, T. F., Lane, P. M., Amos, C. L., and Dowing, J.: The calibration of optical backscatter sensors for suspended sediment of varying darkness levels, Mar. Geol. 162, 587–597, 2000. 5
Tietsche, S., Notz, D., Jungclaus, J. H., and Marotzke, K.: Recovery mechanisms of summer sea ice, Geophys. Res. Lett. 38, L02707, doi:10.1029/2010GL045698, 2011.
Vasseur, C., Mostajir, B., Nozais, C., Dennis, M., Fouilland, E., Klein, B., and Demers, S.: Ef-fects of bio-optical factors on the attenuation of ultraviolet and photosynthetically available radiation in the North Water Polynya, Northern Baffin Bay: ecological implications, Mar. Ecol.-10
Prog. Ser., 252, 1–3, doi:10.3354/meps252001, 2003.
Walsh, J. E., Chapman, W. L., and Shy, T. L.: Recent Decrease of Sea Level Pressure in the central arcticm, J. Climate, 9, 480–486, 1996.
Wegner, C., H ¨olemann, J. A., Dmitrenko, I., Kirillov, S. A., Tuschling, K., Abramova, E., and Kassens, H.: Suspended particulate matter on the Laptev Sea shelf (Siberian Arctic) during 15
ice-free conditions, Est. Coast. Shelf Science, 57, 55–64, 2003.
Wegner, C., H ¨olemann, J. A., Dmitrenko, I., Kirillov, S., and Kassens, H.: Seasonal variations in sediment dynamics on the Laptev Sea shelf (Siberian Arctic), Global Planet. Change, 48, 126–140, 2005.
Wegner, C., Hoelemann, J. A., Klagge, T., Timokhov, L., and Kassens, H.: Application of AD-20
CPs for long-term sediment-transport monitoring in Arctic environments – examples from the Laptev Sea, OMAE 2006 – 25th International Conference in Offshore Mechanics and Arctic Enngineering, June 4–9, Hamburg, Germany, OMAE2006-92551, 2006.
Yamamoto-Kawai, M., McLaughlin, F. A., Carmack, E. C., Nishino, S., and Shimada, K.: Fresh-water budget of the Canada Basin, Arctic Ocean, from salinity,δ18O, and nutrients, J. Geo-25
phys. Res., 113, C01007, doi:10.1029/2006JC003858, 2008.
BGD
9, 13053–13084, 2012
Interannual variability of surface and bottom sediment
transport
C. Wegner et al.
Title Page
Abstract Introduction
Conclusions References
Tables Figures
◭ ◮
◭ ◮
Back Close
Full Screen / Esc
Printer-friendly Version Interactive Discussion
Discussion
P
a
per
|
Dis
cussion
P
a
per
|
Discussion
P
a
per
|
Discussio
n
P
a
per
|
Table 1. Positions, median grain size (d50) for the surface samples after Lindemann
et al. (1994), threshold shields parameter (θcr), and threshold current velocity for incipient grain
motion (ucr) in the vicinity of the respective long-term mooring stations.
Surface Position of surface samples Water Long-term d50(Phi) θ b
cr ucrcm s
−1c
samples Lat. Long. depth (m) mooring
IK93 42-5a 74◦
30.3◦
N 127◦
19.8◦
E 34 ANABAR 4 0.135 34.63d IK93 56-1a 75◦N 123◦E 42 KHATANGA 3.5 0.108 39.82d
aKassens and Karpiy (1994). bEstimated following Soulsby (1997).
BGD
9, 13053–13084, 2012
Interannual variability of surface and bottom sediment
transport
C. Wegner et al.
Title Page
Abstract Introduction
Conclusions References
Tables Figures
◭ ◮
◭ ◮
Back Close
Full Screen / Esc
Printer-friendly Version Interactive Discussion
Discussion
P
a
per
|
Dis
cussion
P
a
per
|
Discussion
P
a
per
|
Discussio
n
P
a
per
|
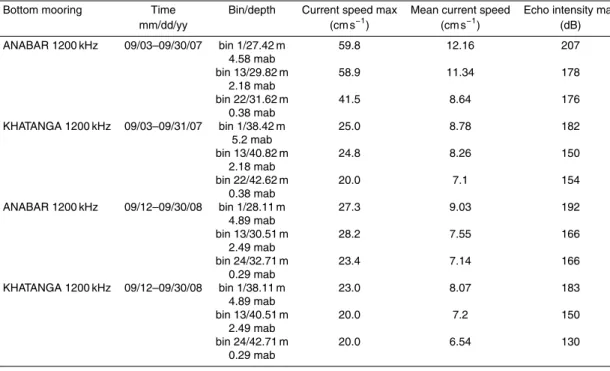
Table 2. Summary of current speed (cm s−1) and echo intensity of the acoustic backscatter (dB) as a relative measure of SPM concentration at the bottom mooring stations ANABAR and KATHANGA for September 2007 and 2008 at different depth levels.
Bottom mooring Time Bin/depth Current speed max Mean current speed Echo intensity max
mm/dd/yy (cm s−1) (cm s−1) (dB)
ANABAR 1200 kHz 09/03–09/30/07 bin 1/27.42 m 59.8 12.16 207
4.58 mab
bin 13/29.82 m 58.9 11.34 178
2.18 mab
bin 22/31.62 m 41.5 8.64 176
0.38 mab
KHATANGA 1200 kHz 09/03–09/31/07 bin 1/38.42 m 25.0 8.78 182 5.2 mab
bin 13/40.82 m 24.8 8.26 150
2.18 mab
bin 22/42.62 m 20.0 7.1 154
0.38 mab
ANABAR 1200 kHz 09/12–09/30/08 bin 1/28.11 m 27.3 9.03 192
4.89 mab
bin 13/30.51 m 28.2 7.55 166
2.49 mab
bin 24/32.71 m 23.4 7.14 166
0.29 mab
KHATANGA 1200 kHz 09/12–09/30/08 bin 1/38.11 m 23.0 8.07 183 4.89 mab
bin 13/40.51 m 20.0 7.2 150
2.49 mab
bin 24/42.71 m 20.0 6.54 130
BGD
9, 13053–13084, 2012
Interannual variability of surface and bottom sediment
transport
C. Wegner et al.
Title Page
Abstract Introduction
Conclusions References
Tables Figures
◭ ◮
◭ ◮
Back Close
Full Screen / Esc
Printer-friendly Version Interactive Discussion
Discussion
P
a
per
|
Dis
cussion
P
a
per
|
Discussion
P
a
per
|
Discussio
n
P
a
per
|
Fig. 3.The surface distribution of salinity (a,d; psu), silicate concentration (b,e; µmol l−1), and
BGD
9, 13053–13084, 2012
Interannual variability of surface and bottom sediment
transport
C. Wegner et al.
Title Page
Abstract Introduction
Conclusions References
Tables Figures
◭ ◮
◭ ◮
Back Close
Full Screen / Esc
Printer-friendly Version Interactive Discussion
Discussion
P
a
per
|
Dis
cussion
P
a
per
|
Discussion
P
a
per
|
Discussio
n
P
a
per
|
Fig. 5.Linear relation between concentrations derived from filtered water samples (SPMfilter) (mg l−1) and optical backscatter measurements in Formazine Turbidity Units (FTU) in Septem-ber 2007 (a: north of 75◦
N: R2=0.949; p=0.01; n=101; b: south of 75◦
N: R2=0.889;
BGD
9, 13053–13084, 2012
Interannual variability of surface and bottom sediment
transport
C. Wegner et al.
Title Page
Abstract Introduction
Conclusions References
Tables Figures
◭ ◮
◭ ◮
Back Close
Full Screen / Esc
Printer-friendly Version Interactive Discussion
Discussion
P
a
per
|
Dis
cussion
P
a
per
|
Discussion
P
a
per
|
Discussio
n
P
a
per
|