www.hydrol-earth-syst-sci.net/20/651/2016/ doi:10.5194/hess-20-651-2016
© Author(s) 2016. CC Attribution 3.0 License.
Uncertainties in calculating precipitation climatology in East Asia
J. Kim1,2and S. K. Park3,4,5,6
1Joint Institute for Regional Earth System Science and Engineering, UCLA, Los Angeles, CA, USA 2Department of Atmospheric and Oceanic Sciences, UCLA, Los Angeles, CA, USA
3Department of Environmental Science and Engineering, Ewha Womans University, Seoul, South Korea 4Department of Atmospheric Science and Engineering, Ewha Womans University, Seoul, South Korea 5Severe Storm Research Center, Ewha Womans University, Seoul, South Korea
6Center for Climate/Environment Change Prediction Research, Ewha Womans University, Seoul, South Korea
Correspondence to:S. K. Park ([email protected])
Received: 29 May 2015 – Published in Hydrol. Earth Syst. Sci. Discuss.: 10 August 2015 Revised: 3 January 2016 – Accepted: 18 January 2016 – Published: 9 February 2016
Abstract. This study examines the uncertainty in calculat-ing the fundamental climatological characteristics of precip-itation in the East Asia region from multiple fine-resolution gridded analysis data sets based on in situ rain gauge obser-vations and data assimilations. Five observation-based grid-ded precipitation data sets are used to derive the long-term means, standard deviations in lieu of interannual variability and linear trends over the 28-year period from 1980 to 2007. Both the annual and summer (June–July–August) mean cipitation is examined. The agreement amongst these pre-cipitation data sets is examined using two metrics includ-ing the signal-to-noise ratio (SNR) defined as the ratio be-tween long-term means and the corresponding standard devi-ations, and Taylor diagrams, which allow examinations of the pattern correlation, the standard deviation, and the centered root mean square error. It is found that the five gauge-based precipitation analysis data sets agree well in the long-term mean and interannual variability in most of the East Asia re-gion including eastern China, Manchuria, South Korea, and Japan, which are densely populated and have fairly high-density observation networks. The regions of large inter-data-set variations include Tibetan Plateau, Mongolia, north-ern Indo-China, and North Korea. The regions of large uncer-tainties are typically lightly populated and are characterized by severe terrain and/or extremely high elevations. Unlike the long-term mean and interannual variability, agreement between data sets in the linear trend is weak, both for the annual and summer mean values. In most of the East Asia region, the SNR for the linear trend is below 0.5: the inter-data-set variability exceeds the multi-data ensemble mean.
The uncertainty in the spatial distribution of long-term means among these data sets occurs both in the spatial pattern and variability, but the uncertainty for the interannual variability and time trend is much larger in the variability than in the pat-tern correlation. Thus, care must be taken in using long-term trends calculated from gridded precipitation analysis data for climate studies over the East Asia region.
1 Introduction
and the impacts of such changes on regionally important sec-tors.
Gridded representations of observed data on the basis of a variety of instruments, locations, platforms, retrieval algo-rithms, and analysis schemes are widely employed in climate research with various goals (Legates and Willmott, 1990; Mitchell and Jones, 2005; Shige et al., 2006; Schneider et al., 2014). Typically, only a limited number of such data sets were available, and most climate studies employed a single data set which includes features needed for their analyses. Recently, a number of researchers and institutions have in-troduced newly developed observation-based gridded anal-ysis data sets of global or regional coverage with fine spa-tial resolutions (Legates and Willmott, 1990; Adler et al., 2003; Mitchell and Jones, 2005; Shige et al., 2006; Yata-gai et al., 2012; Pai et al., 2013; Schneider et al., 2014). These newly introduced analysis data sets provide precipi-tation and/or surface air temperatures over extended periods of multiple decades at spatial resolutions of 0.5◦ or finer, which are substantial improvements from previous genera-tion data sets that are typically at much coarser horizontal resolutions, for example, the 2.5◦resolution GEWEX Global Precipitation Climatology Project (Adler et al., 2003). These recent fine-scale data sets allow us to better examine the re-gional precipitation and temperature climatology and to per-form more reliable evaluations of today’s high-resolution cli-mate simulations, especially over the regions of complex ter-rain, that are important for climate-change impact assess-ments and climate model evaluations (Kim et al., 2013). These new data sets also introduce uncertainties in calculat-ing regional climate characteristics because of the differences amongst them. Based on these concerns, two recent studies by Prakash et al. (2014) and Kim et al. (2015) examined un-certainty in calculating precipitation climatology over India and its surrounding regions using multiple precipitation anal-ysis data sets. These two studies have revealed independently that there exist substantial amounts of differences amongst today’s gridded precipitation data sets resulting in uncertain-ties in the calculated precipitation climatology and that the uncertainty and the spread amongst multiple data sets vary according to regions as well as seasons. Kim et al. (2015) fur-ther revealed that uncertainties in the calculated precipitation climatology defined relative to their climatological means are generally larger in the dry regions and/or local dry seasons. These two studies strongly suggest that uncertainty due to the differences between various data sets needs to be exam-ined and quantified in all climate studies because the absolute accuracy of individual data sets cannot be quantified in prac-tice.
In this study, we investigate the uncertainty in calculat-ing fundamental properties of regional climate characteris-tics of precipitation over the Far East Asian region due to the differences amongst today’s fine-resolution gridded data sets based on analyses of observed data. This study exam-ines for the first time the uncertainty in calculating the
stan-dard deviation, a widely used first-order statistical moment, and linear trend against that in calculating the average, the zero-order statistical moment. Examining the uncertainty in assessing the key precipitation characteristics from the cur-rent available precipitation data can help interpret future pre-cipitation projections. In East Asia, with huge populations and frequent hydrologic extremes, assessing long-term vari-ations in precipitation has been an important concern. How-ever, the effects of inter-data-set differences on such assess-ments have not been studied so far. The uncertainty analysis for the East Asia region in this study is also applicable to any other parts of the world. The methodology and data are pre-sented in Sect. 2, and results are given in Sect. 3. Section 4 summarizes and discusses the implications of the findings in this study.
2 Methodology and data
In this study, spatial variations in the long-term means, in-terannual variabilities, and linear trends over the region of interest are examined in terms of inter-data-set variability measured using signal-to-noise ratio (SNR) and the similar-ity with reference data.
Five gridded precipitation data sets are used to estimate the uncertainty in constructing regional climate characteristics over East Asia for the entire year and for the summer season (June–July–August). Only the data sets that cover more than 25 years are selected for analysis for reliable calculations of the temporal variability in lieu of interannual variability and linear trends. The period of the recent three decades exam-ined in this study corresponds to a period of quite steady (near monotonic) and large increases in the global mean temperature. The analysis was limited to the 28-year period (1980∼2007)due to the length of the available data.
Ex-amination of the precipitation trend in the period of clear warming trend is a major scientific interest related to the link between the changes in precipitation and temperature.
Based on the selection criterion, five high-resolution grid-ded data sets are selected, including the Climate Research Unit of the University of East Anglia (CRU), University of Delaware (UDEL), Global Precipitation Climatology Cen-ter (GPCC), the Asian Precipitation−Highly Resolved
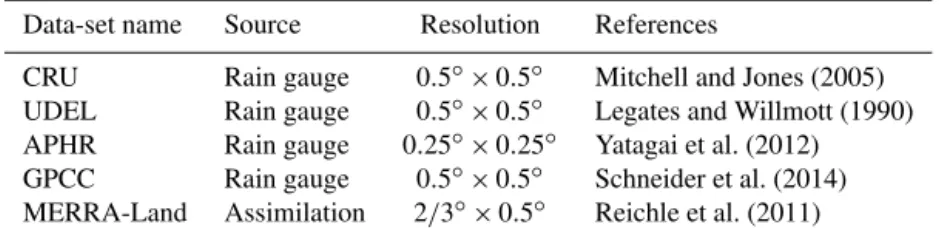
Table 1.The precipitation data sets employed in this study.
Data-set name Source Resolution References
CRU Rain gauge 0.5◦×0.5◦ Mitchell and Jones (2005) UDEL Rain gauge 0.5◦×0.5◦ Legates and Willmott (1990) APHR Rain gauge 0.25◦×0.25◦ Yatagai et al. (2012) GPCC Rain gauge 0.5◦×0.5◦ Schneider et al. (2014) MERRA-Land Assimilation 2/3◦×0.5◦ Reichle et al. (2011)
Note that there are some factors leading to differences among the data sets – e.g., the horizontal and/or vertical res-olutions, the gridding procedure, the analysis methods. Such inter-data-set differences may be an unavoidable source of uncertainty in this study. As seen in Table 1, observational data are available in various resolutions and discretizations. In fact, data sets of the same horizontal resolution can be defined in different grid structures. The gridding procedure might also be different for different data sets. The analysis data sets are usually based on different sets of station (ob-servational) data, depending on the data availability at the time of analysis and specifics of the quality control proce-dures (e.g., Mitchell and Jones, 2005; Yatagai et al., 2012; Pai et al., 2013). Furthermore, the analysis methodology, essen-tially the interpolation scheme that varies for different anal-ysis data sets, can contribute to the inter-data-set differences. However, assessing the effects of different data sets and/or the analysis schemes on the inter-data-set differences used here is beyond the scope of this study.
To alleviate the uncertainty related to the inter-data-set dif-ferences, we have interpolated all data sets onto a common grid so that we can compare all data sets at the same loca-tions. The spatial interpolation procedure can affect the char-acteristics of spatial variability of the interpolated data. This can be an important concern in deriving the characteristics of horizontal variability, e.g., spatial power spectra, but it is not expected to have serious effects on deriving temporal vari-ability of the interpolated data. Because all of the properties we describe in this study are related to the temporal variabil-ity (e.g., temporal means, standard deviations, and trends), we expect the differences in the horizontal resolutions and subsequent spatial interpolation have minimal impacts on the results. We have also created a multi-data-set ensemble by simple averaging of all observational data sets included in the analysis, using equal weights. The equal weighting is em-ployed because the accuracy of individual data sets cannot be determined objectively.
Uncertainties in representing precipitation climatology due to the spread amongst today’s observational data are ex-amined in terms of the SNR. The SNR has been a key prop-erty in a number of climate studies in which the uncertain-ties of climate signals are estimated against noises stemming from various sources (e.g., Giorgi and Mearns, 2002; Covey et al., 2003; Meehl et al., 2005; Tebaldi and Knutti, 2007;
Duan and Phillips, 2010). In climate and weather forecast re-search based on ensembles of multiple model or observation data sets, the SNR has been used to measure the reliability of the multi-data-set ensemble mean against the spread of the data sets in the ensemble. Within this context, the sig-nal and noise are defined as the associated mean and stan-dard deviation, respectively, of multiple data sets. The defi-nition of “noise” can be complicated when the data reliability varies among data sets, and the weighting factor in construct-ing multi-data-set ensemble can vary for different data sets (Duan and Phillips, 2010). Such complications in calculating “noise” frequently occur in climate projections where out-puts from various models of varying performance are used to construct an ensemble mean using the variable weighting (e.g., Giorgi and Mearns, 2002). Because it is practically im-possible to rank the selected observational data sets in terms of their accuracy, the ensemble is constructed using an equal weighting.
Figure 1.The climatological properties of the annual (upper panels) and summer (lower panels) precipitation for the period 1980–2007 over East Asia:(a, d)the mean climatology,(b, e)the standard deviation, and(c, f)the linear trend of precipitation. These properties are derived from the ensemble of the corresponding properties calculated from the data sets in Table 1.
Figure 2. The signal-to-noise ratio (SNR) for the properties shown in Fig. 1, calculated from the corresponding properties of the five precipitation analysis data sets in Table 1.
3 Results
3.1 Regional climatology
Figure 1 presents the three basic characteristics of the annual and summer (June–July–August) precipitation climatology over East Asia – long-term means, interannual variability, and trends, calculated from the ensemble mean of the mul-tiple data sets in Table 1. The mean annual precipitation in the region is characterized by the wet regions in southeast-ern China and Japan (Fig. 1a). Precipitation over the Korean
northern Tibetan Plateau, and the negative trend along the wet Yangtze River. Strong positive trends are also found in much of the Korean Peninsula, the coastal region of northern China to the west of the Shandong Peninsula, most of south-ern China, and eastsouth-ern Japan. Decreasing precipitation trends also occur in the region between 45 and 50◦N and extending from central Mongolia to the Russian Far East. The summer rainfall climatology (Fig. 1d–f) resembles the annual mean climatology but with larger magnitudes. This shows that the precipitation climatology over the East Asia region is primar-ily determined by the summer rainfall.
3.2 Uncertainties in precipitation climatology
The climatology presented in Fig. 1 varies for different data sets. This is inevitable because each data set utilizes differ-ent raw data, data quality control, and analysis methodology (Xie and Arkin, 1995). Because it is practically impossible to determine which data set is more accurate, assessing the reliability of climatological properties calculated from var-ious data sets as well as the expected range of uncertainty due to the diversity of these data sets is crucial in calculat-ing regional climatology (Kim et al., 2015). In this section, the range of uncertainty in the three precipitation character-istics is measured in terms of the SNR and the agreement be-tween individual data sets and the multi-data ensemble mean in terms of the spatial pattern correlation and the magnitude of spatial variability following the methodology of Kim et al. (2015), using the Taylor diagram.
The SNR is calculated as the ratio between the multi-data ensemble mean and the inter-data-set variability, i.e., a mea-sure of the magnitude of the multi-data-set ensemble mean relative to that of the inter-data-set variations. Thus, as SNR increases, these data sets agree more closely with each other. There is no established threshold value of SNR to distinguish “good” from “bad”. However, we may use some subjective guidance to interpret the SNR values. For instance, if SNR< 1 the signal is smaller than the noise, and it becomes a clear case that the signal is not reliable. The case with SNR>5 may indicate that the spread amongst the multiple data sets may be small enough so that we can take the multi-data en-semble as the representative value for the included data sets. The SNRs for the annual mean precipitation (Fig. 2a) and its interannual variability (Fig. 2b) over the 25-year period exceed 5 in most of the study domain. Hence, the five data sets examined in this study agree well in terms of the annual mean precipitation and its interannual variability in the East Asia region. The regions of small SNR, i.e., showing poor agreements amongst the selected data sets, are located in the western part of the domain, which includes eastern Tibetan Plateau, the Gobi desert, and northern Indochina bordering with China. It is notable that the station density is relatively low in these regions. The SNR for the interannual variability is generally smaller than that for the mean; thus, uncertainty in calculating the interannual variability is larger than in
cal-Figure 3.Thepvalues in calculating the linear trend of the annual-mean precipitation from each data set.
Figure 4.Same as in Fig. 3, but for the summer-mean precipitation trend.
culating the mean climatology. Unlike the annual mean and its interannual variability, the SNR for the linear tendency of the annual precipitation (Fig. 2c) is generally below 5 in most regions. Thus, long-term annual precipitation trend in the region is highly uncertain except in a few small areas.
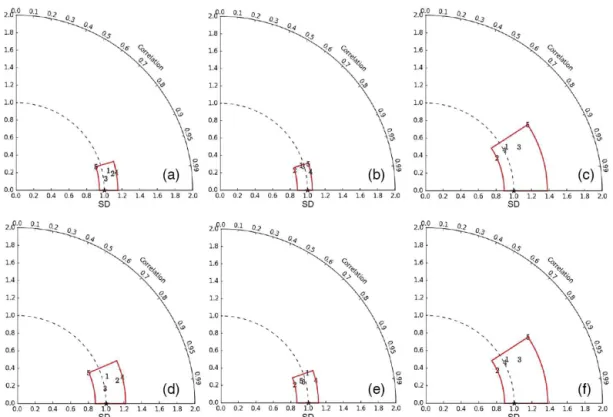
Figure 5.The spread amongst the five precipitation data sets in representing the spatial variability of the three climatological properties of the annual (upper panels) and summer (lower panels) precipitation over East Asia:(a, d)the mean,(b, e)the interannual variability, and (c, f)the trends of precipitation. They are presented in terms of their spatial pattern correlations (the azimuthal direction), the standardized deviation, and the standard deviation of individual data sets normalized by that of the reference data (the radial direction). The area within the red polyline represents the range of spread amongst these data sets.
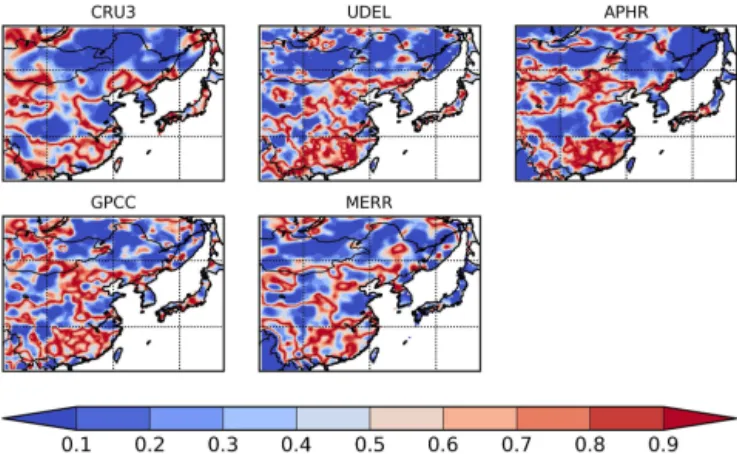
To evaluate the statistical significance of trends, we have plotted thepvalues from each data set in calculating the lin-ear trend of the annual-mean precipitation and the summer-mean precipitation (see Figs. 3 and 4, respectively). The re-gions of large SNR correspond to the rere-gions of smallp val-ues in calculating the linear trend. This suggests that some of the uncertainty in the multi-data-set ensemble may be herited from the uncertainty in calculating the trend from in-dividual data sets. Still, a significant portion of the region of smallpvalues shows small SNR values. Thus, inter-data-set differences are the main cause of the uncertainty in calculat-ing long-term trends.
Figure 5 measures the spatial variations in the three clima-tological properties represented by the five observational data sets using the Taylor diagrams and the simple multi-data-set ensemble as the reference. In these diagrams, the areas en-compassed by the red polylines may be regarded as the range of uncertainty (see Kim et al., 2015). Thus, as the area is smaller, the uncertainty due to the differences between the examined data sets is smaller. The spread in the azimuthal and radial direction indicates the spread in the spatial pat-tern and in the magnitude of spatial variability, respectively. Similar to Fig. 2, the uncertainties in the spatial variations of the annual and summer mean precipitation and their
inter-annual variability are much less than the uncertainty in the spatial variations of the linear trend. The distances from the reference data at the point indicated by a star (i.e., the ref-erence point with both standardized deviation and correla-tion being equal to 1.0) to individual data sets for the means (Fig. 5a and d) are similar to those for their interannual vari-ability (Fig. 5b and e), indicating a similar level of spread amongst these data sets in representing these two properties of the precipitation climatology in the region. Regarding the linear trend (Figs. 5c and f), compared to the means and their interannual variabilities, the distances between the reference point and individual data sets are much larger. This is an-other indication of the larger uncertainties in the linear trend represented by these data sets.
(Fig. 5c and f), which shows nearly linear distribution of the data points in radial directions, i.e., much smaller spread in the azimuthal direction (pattern correlations) than in the ra-dial direction (magnitude of variability relative to the refer-ence data).
4 Summary and discussions
The uncertainties in three fundamental climatological char-acteristics of the precipitation over East Asia due to the dif-ferences among available fine-scale observation-based grid-ded analysis data sets have been examined using the met-rics selected for objectively measuring the spread of these properties calculated from individual data sets. The three cli-matological characteristics include the means, interannual variabilities, and linear trends in the annual and summer mean precipitation, which are key fundamental climatolog-ical characteristics widely used in studies for examining re-gional climate characteristics and model evaluations. The spread and the magnitude of disagreements amongst the se-lected data sets are measured using the signal-to-noise ra-tio (SNR) and examined visually using the Taylor diagrams, which allow simultaneous evaluations of three properties – pattern correlation, standard deviations, and the centered mean square errors between multiple data sets and a refer-ence data set.
The SNR values calculated from the five selected precipi-tation data sets show that the mean climatology of the annual and summer mean precipitation values and their interannual variability are highly reliable in much of East Asia except in southern Mongolia, the Gobi desert, and the Tibetan Plateau – the regions of sparse population and complex terrain. Pre-cipitation measurements in regions of dry climate and com-plex terrain require high-density networks (e.g., Kim et al., 2015). Unlike the climatological mean values and interan-nual variability, linear trends calculated over the 28-year pe-riod are highly uncertain except in a few limited areas. It is striking that reliable estimations of the temporal trend of the annual mean precipitation (Fig. 2c) are very low compared to those for the means and the variability (Fig. 2a and b, respec-tively). Reliable calculation of linear trends is only possible over the southern China region for the summer mean pre-cipitation. Thus extra caution must be taken when analyzing precipitation trends over the East Asian region.
The uncertainty characteristics also vary according to the climatological properties. Figures 1 and 2 discussed above show that the reliability of calculating temporal variabilities is much lower than that of time mean values, especially for linear trends. In addition, the spatial pattern and variability of the calculated linear trend (Fig. 5c) show much larger spread (i.e., uncertainty) among these data sets compared to the an-nual means (Fig. 5a) and interanan-nual variability (Fig. 5b). The consistency in the spatial pattern between individual data sets and the reference data measured in terms of the correla-tion is near or over 0.95 for the temporal means and
variabil-ity whilst it barely exceeds 0.8 for the linear trend. The range of spatial variability measured in terms of the standardized deviation (the ratio between the standard deviation of a data sets and the reference data set) for the linear trend is over 0.5 which is more than twice the range of the means and the variabilities. It is also observed that uncertainties in the spatial distribution of the annual and summer mean precipi-tation (Fig. 5a and d, respectively) occur in both the spatial pattern and the magnitude of variability. For the interannual variability and linear trends, the spread in the standardized deviation (i.e., the magnitude of variability) is much larger than that in the spatial pattern. These may suggest that all of these data sets are affected by some common factors in de-termining the characteristics of these data sets. For example, the station data sets included in each analysis data set may provide high consistency in the spatial distribution pattern, but different analysis schemes may lead to a larger spread in the magnitude of their variability because of different basis functions employed in different interpolation schemes (e.g., Xie and Arkin, 1995; Prakash et al., 2014). This is just a hy-pothesis and needs close examination in future studies.
The uncertainty in calculating precipitation climatology in the regions including southern Mongolia, the Gobi desert, and the Tibetan Plateau is of a special concern. These re-gions can respond sensitively to climate change because of disproportionally larger impacts of global warming on high-elevation regions and snow–ice processes (e.g., IPCC, 2007; Waliser et al., 2011). Because of rapid variations in the spa-tial precipitation distributions according to terrain during storms, accurate measurement of precipitation in the regions of extreme terrain requires high-density gauge networks (Xie and Arkin, 1995). The sparse population density in these re-gions may require higher cost to build and maintain addi-tional gauges to reduce the uncertainties. Remote sensing of precipitation will play important roles in monitoring precip-itation over these regions of sparse observations in addition to the investments for installing and maintaining additional surface observing stations.
Acknowledgements. This work is supported by the National Research Foundation of Korea grant (no. 2009-0083527) funded by the Korean government (MSIP) and the NSF ExArch 1125798 project. The APHRODITE data were obtained from the link http://www.chikyu.ac.jp/precip/.
Edited by: D. Mazvimavi
References
pre-cipitation analysis (1979–Present), J. Hydrometeorol., 4, 1147– 1167, 2003.
Covey, C., AchutaRao, K., Cubasch, U., Jones, P., Lambert, S., Mann, M., Phillips, T., and Taylor, K.: An overview of results from the Coupled Model Intercomparison Project, Global Planet. Change, 37, 103–133, 2003.
Duan, Q. and Phillips, T.: Beysian estimation of local signal and noise in multimodel simulations of climate change, J. Geophys. Res., 115, D18123, doi:10.1029/2009JD013654, 2010.
Duffy, P., Aritt, R. W., Coquard, J., Gutowski, W., Han, J., Iorio, J., Kim, J., Leung, L.-R., Roads, J., and Zeledon, E.: Simulations of present and future climates in the western United States with four nested regional climate models, J. Climate, 19, 873–895, 2006. Giorgi, F. and Mearns, L.: Calculation of average, uncertainty range
and reliability of regional climate changes from AOGCMs via the Reliability Ensemble Averaging (REA) method, J. Climate, 15, 1141–1158, 2002.
Giorgi, F., Brodeur, C., and Bates, G.: Regional climate change sce-narios over the United States produced with a nested regional climate model: spatial and seasonal characteristics, J. Climate, 7, 375–399, 1994.
Gleckler, P., Taylor, K., and Doutriaux, C.: Performance met-rics for climate models, J. Geophys. Res., 113, D06104, doi:10.1029/2007JD008972, 2008.
Groisman, P., Knight, R., and Karl, T.: Heavy precipitation and high streamflow in the contiguous United States: trends in the twenti-eth century, B. Am. Meteorol. Soc., 82, 219–246, 2001. IPCC: Climate Change 2001: The Scientific Basis, edited by:
Houghton, J. T., Ding, Y., Griggs, D. J., Noguer, M., van den Linden, P. J., Dai, X., and Johnson, C. A., IPCC, Cambridge Uni-versity Press, Cambridge, UK, and New York, 881 pp., 2001. IPCC: Climate Change 2007: Synthesis Report, edited by:
Al-lali, A., Bojariu, R., Diaz, S., Elgizouli, I., Griggs, D., Hawkins, D., Hohmeyer, O., Jallow, B., Kajfez-Bogataj, L., Leary, N., Lee, H., and Wratt, D., IPCC, Geneva, 73 pp., 2007. Kim, J.: A projection of the effects of the climate change induced by
increased CO2on extreme hydrologic events in the western U.S., Climatic Change, 68, 153–168, 2005.
Kim, J., Waliser, D., Mattmann, C., Mearns, L., Goodale, C., Hart, A., Crichton, D., McGinnis, S., Lee, H., Loikith, P., and Boustani, M.: Evaluation of the surface climatology over the con-terminous United States in the North American Regional Climate Change Assessment Program hindcast experiment using a Re-gional Climate Model Evaluation System, J. Climate, 26, 5698– 5715, 2013.
Kim, J., Sanjay, J., Mattmann, C., Boustani, M., Ramarao, M. V. S., Krishnan, R., and Waliser, D.: Uncertainties in estimating spa-tial and interannual variations in precipitation climatology in the India-Tibet region from multiple gridded precipitation datasets, Int. J. Climatol.„ 35, 4557–4573, 2015.
Legates, D. and Willmott, C.: Mean seasonal and spatial variabil-ity in gauge-corrected, global precipitation, Int. J. Climatol., 10, 111–127, 1990.
Meehl, G., Covey, C., McAvaney, B., Latif, M., and Stouffer, R.: Overview of the Coupled Model Intercomparison Project, B. Am. Meteorol. Soc., 86, 89–93, 2005.
Mitchell, T. and Jones, P.: An improved method of constructing a database of monthly climate observations and associated high-resolution grids, Int. J. Climatol., 25, 693–712, 2005.
Pai, D., Sridhar, S., Rajeevan, M., Sreejith, O., Satbhai, N., and Mukhopadyay, B.: Development and analysis of a new high spatial resolution (0.25◦×0.25◦) long period (1901–2010) daily gridded rainfall dataset over India, Research Report No. 1/2013, National Climate Centre, India Metrorological Depart-ment, Pune, India, 63 pp., 2013.
Prakash, S., Mitra, A., Momin, I., Rajagopal, E., Basu, S., Collins, M., Turner, A., Rao, K., and Ashok, K.: Seasonal inter-comparison of observational rainfall datasets over India during the southwest monsoon season, Int. J. Climatol., 35, 2326–2338, doi:10.1002/joc.4129, 2014.
Reichle, R., Koster, R., De Lannoy, G., Forman, B., Liu, Q., Ma-hanama, S., and Toure, A.: Assessment and enhancement of MERRA land surface hydrology estimates, J. Climate, 24, 6322– 6338, doi:10.1175/JCLI-D-10-05033.1, 2011.
Schneider, U., Becker, A., Finger, P., Meyer-Christoffer, A., Ziese, M., and Rudolf, B.: GPCC’s new land surface precipita-tion climatology based on quality-controlled in situ data and its role in quantifying the global water cycle, Theor. Appl. Clima-tol., 115, 15–40, 2014.
Shige, S., Sasaki, H., Okamoto, K., and Iguchi, T.: Validation of rainfall estimates from the TRMM precipitation radar and mi-crowave imager using a radiative transfer model: 1. Compari-son of the version-5 and -6 products, Geophys. Res. Lett., 33, L13803, doi:10.1029/2006GL026350, 2006.
Taylor, K.: Summarizing multiple aspects of model performance in a single diagram, J. Geophys. Res., 106, 7183–7192, 2001. Tebaldi, C. and Knutti, R.: The use of the multi-model ensemble in
probabilistic climate projections, Philos. Trans. R. Soc. A, 365, 2053–2075, 2007.
Waliser, D., Kim, J., Xue, Y., Chao, Y., Eldering, A., Fovell, R., Hall, A., Li, Q., Liou, K. N., McWilliams, J., Kapnick, S., Va-sic, R., De Sales, F., and Yu, Y.: Simulating cold season snow-pack: impacts of snow albedo and multi-layer snow physics, Clim. Change, 109, S95–S117, 2011.
Xie, P. and Arkin, P.: An intercomparison of gauge observations and satellite estimates of monthly precipitation, J. Appl. Meteorol., 34, 1143–1160, 1995.