Vol. 9, No. 2, June 2012, 217-229
Delta-Bar-Delta and Directed Random
Search Algorithms to Study Capacitor
Banks Switching Overvoltages
Iman Sadeghkhani
1, Abbas Ketabi
2, Rene Feuillet
3Abstract: This paper introduces an approach to analyse transient overvoltages during capacitor banks switching based on artificial neural networks (ANN). Three learning algorithms, delta-bar-delta (DBD), extended delta-bar-delta (EDBD) and directed random search (DRS) were used to train the ANNs. The ANN training is based on equivalent parameters of the network and therefore, a trained ANN is applicable to every studied system. The developed ANN is trained with extensive simulated results and tested for typical cases. The new algorithms are presented and demonstrated for a partial 39-bus New England test system. The simulated results show the proposed technique can accurately estimate the peak values of switching overvoltages.
Keywords: Artificial neural networks, Capacitor banks switching, Delta-bar-delta, Directed random search, Switching overvoltages.
1 Introduction
The quality of electric power has been a constant topic of study, mainly because inherent problems to it can lead to great economic losses, especially in industrial processes. Among the various factors that affect power quality, those related to transients originating from capacitor bank (CB) switching must be highlighted. Electric power systems have predominantly inductive loads, so that the systems themselves must supply the reactive power consumed. The most practical and efficient way for the utility to supply the reactive power demanded is through the installation of capacitor bank (CBs) in the system. The installation of shunt CB brings benefits concerning the reduction of system charging and electrical losses, system capacity release, and also improvements in the power factor [1, 2]. Although various factors influence power quality, the
1Department of Electrical Engineering, Islamic Azad University, Najafabad Branch, Najafabad, Iran;
Department of Electrical and Computer Engineering, Isfahan University of Technology, Isfahan, Iran; Email: [email protected]
2
Department of Electrical Engineering, University of Kashan, Kashan, Iran, E-mail: [email protected]
3
work presented here focuses on transients originating from shunt capacitor bank switching in power systems.
The magnitude and shape of the switching overvoltages vary with the system parameters and network configuration. Even with the same system parameters and network configuration, the switching overvoltages are highly dependent on the characteristics of the circuit breaker operation and the point-on-wave where the switching operation takes place [3-8].
In this paper power system blockset (PSB), a MATLAB/Simulink-based simulation tool [9,10] is used for computation of both switching and temporary overvoltages. This paper presents the artificial neural network (ANN) application for estimation of overvoltage peaks under switching transients during capacitor energization. A tool such as proposed in this paper that can give the maximum switching overvoltage will be helpful to the operator. It can be used as training tool for the operators. The proposed ANN is expected to learn many scenarios of operation. To give the maximum peak overvoltages in a shortest computational time which is the requirement during online operation of power systems.
In the proposed ANN we have considered the most important aspects, which influence the transient overvoltages such as voltage at capacitor bus before switching, equivalent resistance, equivalent inductance, equivalent capacitance, line length, switching angle, and capacitor capacity. This information will help the operator to select the proper condition of capacitor switching with transients appearing safe within the limits. Results of the studies are presented for a partial of 39-bus New England test system to illustrate the proposed approach.
2
Switching Overvoltages during Capacitor Banks Energization
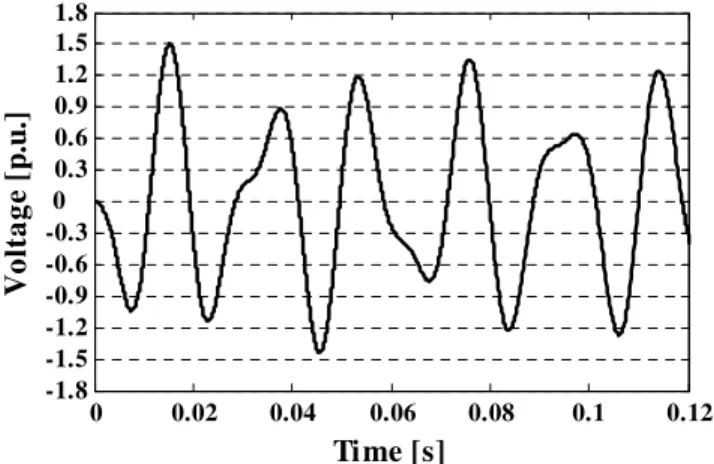
This paper concentrates on the estimation of switching overvoltages during capacitor energization. The CB switching provokes transient overvoltages that theoretically can reach peak phase-to-earth values in the order of 2-3 p.u. The sample system considered for explanation of the proposed methodology is a 400 kV EHV network shown in Fig. 1. The normal peak value of any phase voltage is 400 2 3 kV and this value is taken as base for voltage p.u. In the system studies 400 kV line-to-line base voltage and 100 MVA as a base power is considered. Fig. 2 shows the switching transient at bus 2 when capacitor is energized.
In practical system a number of factors affect the overvoltages factors due to energization or reclosing. In this paper following parameters is considered:
• Voltage at capacitor bus before switching
• Equivalent resistance of the network
• Equivalent inductance of the network
• Equivalent capacitance of the network
• Line length
• Closing time of the circuit breaker poles
• Capacitor bank capacity
Fig. 1 – Sample system for capacitor bank energization study. G: generator, Reqv: equivalent resistance, Leqv: equivalent inductance,
andCeqv: equivalent capacitance.
0 0.02 0.04 0.06 0.08 0.1 0.12
-1.8 -1.5 -1.2 -0.9 -0.6 -0.3 0 0.3 0.6 0.9 1.2 1.5 1.8
Time [s]
Vo
lt
a
g
e
[
p
.u
.]
In proposed method, equivalent parameters of the network as well as other parameters are used as ANN inputs. Thus, ANN is trained just once for simple system of Fig. 1 and developed ANN is applicable to every studied system. For using developed ANN, just studied system must convert to Fig. 1. Section 5 has more details about proposed method.
0.85 0.9 0.95 1
1.2 1.3 1.4 1.5 1.6 1.7 1.8 1.9 2 2.1 2.2
Source Voltage [p.u.]
Vo
lt
a
g
e [
p
.u
.]
Reqv = 0.003 p.u.
Reqv = 0.006 p.u.
Fig. 3 – Overvoltage peak at bus 2 as source voltage while equivalent inductance 0.025 p.u., equivalent capacitor 1.2825 p.u., line length 200 km, switching angle 20°,
and capacitor bank capacity 30 MVAR. Reqvis equivalent resistance.
100 150 200 250 300
1 1.2 1.4 1.6 1.8 2 2.2 2.4 2.6
Line Length [k m]
V
o
lt
age
[
p
.u
.]
S.V. = 0.85 p.u. S.V. = 0.95 p.u.
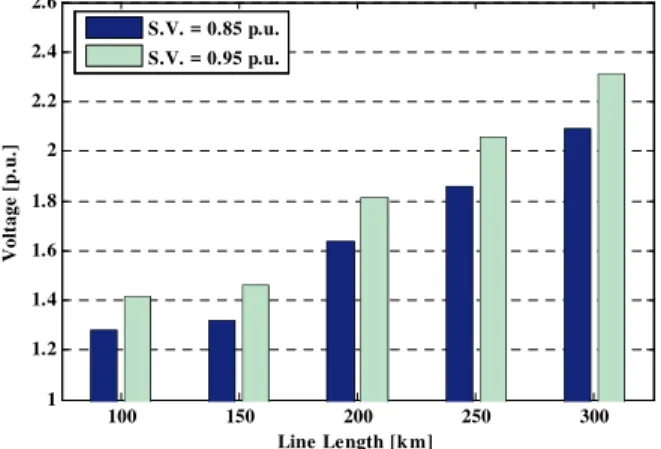
Fig. 4 – Overvoltage peak at bus 2 as line length while equivalent resistance 0.004 p.u., equivalent inductance 0.025 p.u., equivalent capacitance 1.2825 p.u.,
switching angle 20°, and capacitor bank capacity 30 MVAR. S.V. is source voltage.
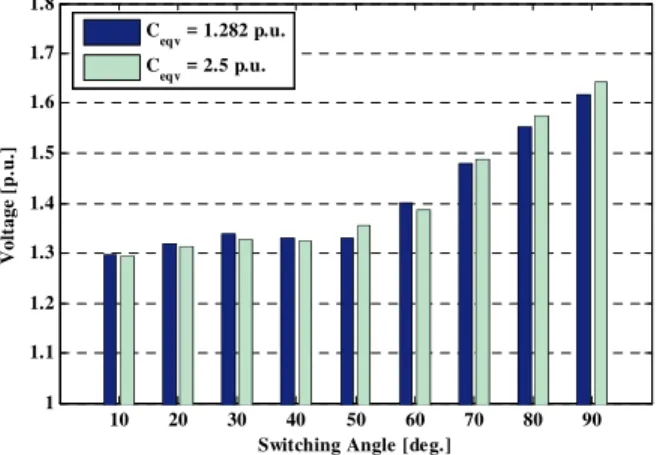
means of controlling switching transients in power systems [17]. Fig. 5 shows effect of switching angle on overvoltages at different equivalent capacitance. Fig. 6 shows the effect of shunt capacitor capacity on overvoltages at different equivalent inductance.
10 20 30 40 50 60 70 80 90 1
1.1 1.2 1.3 1.4 1.5 1.6 1.7 1.8
Switching Angle [deg.]
Vo
lt
a
g
e [
p
.u
.]
C
eqv = 1.282 p.u. Ceqv = 2.5 p.u.
Fig. 5 – Overvoltage peak at bus 2 as switching angle while source voltage 0.9 p.u., equivalent resistance 0.003 p.u., equivalent inductance 0.03 p.u., line length 150 km,
and capacitor bank capacity 20 MVAR. Ceqvis equivalent capacitance.
10 20 30 40 50
1 1.2 1.4 1.6 1.8 2 2.2 2.4
Capacitor Bank Capacity [MVAR]
Vo
lt
a
g
e [
p
.u
.]
Leqv = 0.02 p.u.
L
eqv = 0.035 p.u.
Fig. 6 – Overvoltage peak at bus 2 as capacitor bank capacity while source voltage 0.9 p.u., equivalent resistance 0.003 p.u.,
equivalent capacitance 1.8912 p.u., line length 150 km, and switching angle 30°. Leqvis equivalent inductance.
are trained with the two supervised and one reinforcement learning algorithms. In this paper, the delta-bar-delta (DBD), the extended delta-bar-delta (EDBD) and the directed random search (DRS) were used to train the ANN [21]. To improve the performance of ANNs, tangent hyperbolic activation function was used. A learning algorithm gives the change Δw kjj( ) in the weight of a connection between neurons i and j. Error is calculated by the difference of PSB output and ANN output:
ANN PSB
Error(%) 100
PSB
−
= × . (1)
In the next section, these learning algorithms have been explained briefly.
3
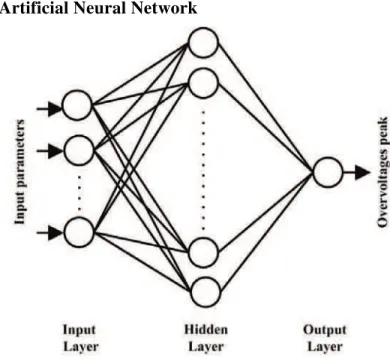
The Artificial Neural Network
Fig. 7 – The structure of artificial neural network.
3.1 Delta-bar-delta (DBD) algorithm
The DBD algorithm is a heuristic approach to improve the convergence speed of the weights in ANNs [22]. The weights are updated by
( 1) ( ) ( ) ( )
where α( )k is the learning coefficient and assigned to each connection, δ( )k is the gradient component of the weight change. δ( )k is employed to implement the heuristic for incrementing and decrementing the learning coefficients for each connection. The weighted average ( )δ k is formed as
( )k (1 ) ( )k (k 1)
δ = − θ δ + θδ − , (3)
where θ is the convex weighting factor. The learning coefficient change is given as
, ( 1) ( ) 0,
( ) ( ), ( 1) ( ) 0,
0, otherwise,
k k
k k k k
⎧κ δ − δ > ⎪
Δα = −φα⎨ δ − δ < ⎪
⎩
(4)
where κ is the constant learning coefficient increment factor, and φ is the constant learning coefficient decrement factor.
3.2 Extended delta-bar-delta (EDBD) algorithm
The EDBD algorithm is an extension of the DBD and based on decreasing the training time for ANNs [23]. In this algorithm, the changes in weights are calculated from:
( 1) ( ) ( ) ( ) ( )
w k k k k w k
Δ + = α δ + μ Δ , (5)
and the weights are then found as
( 1) ( ) ( )
w k+ =w k + Δw k . (6)
In Eq. (5), ( )α k and ( )μ k are the learning and momentum coefficients, respectively. The learning coefficient change is given as
exp( ( ) , if ( 1) ( ) 0,
( ) ( ), if ( 1) ( ) 0,
0, otherwise,
a k k k
k k k k
α
α
⎧κ −γ δ δ − δ > ⎪⎪
Δα = −φ α⎨ δ − δ < ⎪
⎪⎩
(7)
where κα is the constant learning coefficient scale factor, ‘exp’is the exponential function, φα is the constant learning coefficient decrement factor, and γα is the constant learning coefficient exponential factor. The momentum coefficient change is also written as
exp( ( ) , if ( 1) ( ) 0,
( ) ( ), if ( 1) ( ) 0,
0, otherwise,
k k k
k k k k
μ μ
μ
⎧κ −γ δ δ − δ > ⎪⎪
Δμ = −φ μ⎨ δ − δ < ⎪
⎪⎩
where κμ is the constant momentum coefficient scale factor, φμ is the constant momentum coefficient decrement factor, and γμ is the constant momentum coefficient exponential factor. In order to take a step further to prevent wild jumps and oscillations in the weight space, ceilings are placed on the individual connection learning and momentum coefficients [23].
3.3 Directed random search (DRS)
The directed random search is a reinforcement learning approach and used to calculate the weights of ANNs. This algorithm also tries to minimize the overall error [24]. Random steps are taken in the weights and a directed component is added to the random step to enable an impetus to pursue previously search directions. The DRS is based on four procedures as random step, reversal step, directed procedure and self-tuning variance. In the random step, a random value is added to each weight of network and the error is then evaluated for all training sets as
( 1) best ( )
w k+ =w +dw k , (9)
where wbest is the best weight vector previous to iteration k and dw k( ) is the delta weight vector at iteration k. Depending on the error evaluation, the weights are replaced with the new weights. If there is no improvement at the error in the random step, some random value is subtracted from the weight value during the reversal step, that is
( 1) best ( )
w k+ =w −dw k . (10)
In [24], a directed procedure has been added to the random step to further improve with reversals. The new weights are obtained from:
( 1) best ( ) ( )
w k+ =w −dw k +dp k , (11)
where ( )dp k is the directed procedure and based on the history of success or failure of the random steps.
4 Case Study
In this section, the proposed algorithm is demonstrated for two case studies that are a portion of 39-bus New England test system, of which its parameters are listed in [25]. The simulations are undertaken on a single phase representation.
4.1 Case 1
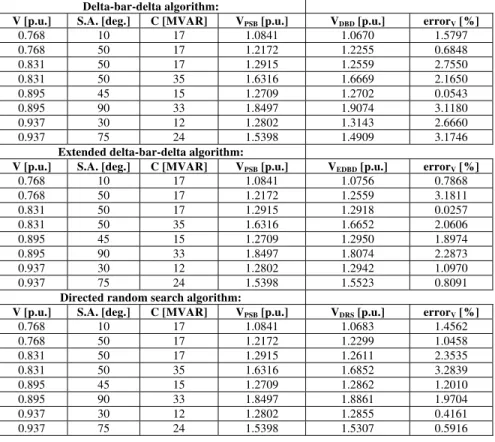
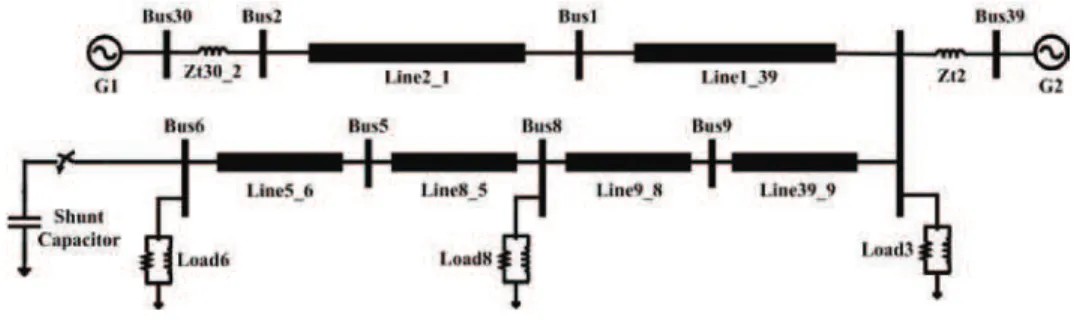
Fig. 8 shows a one-line diagram of a portion of 39-bus New England test system. First, equivalent circuit of this system, seen behind bus 16, is determined and values of equivalent resistance, equivalent inductance, and equivalent capacitance are calculated. In other words, this system is converted to equivalent system of Fig. 1. In this case, equivalent parameters are 0.00385 p.u., 0.03129 p.u., and 2.0674 p.u., respectively. For testing trained ANN, values of voltage at capacitor bus (bus 19) before switching, switching angle, and capacitor capacity are varied and in each case, overvoltage peak values are calculated from trained ANN and system of Fig. 8. Table 1 contains the some sample result of test data for Case 1.
Table 1
Case 1: Some sample testing data and output.
Delta-bar-delta algorithm:
V [p.u.] S.A. [deg.] C [MVAR] VPSB [p.u.] VDBD [p.u.] errorV [%]
0.768 10 17 1.0841 1.0670 1.5797
0.768 50 17 1.2172 1.2255 0.6848
0.831 50 17 1.2915 1.2559 2.7550
0.831 50 35 1.6316 1.6669 2.1650
0.895 45 15 1.2709 1.2702 0.0543
0.895 90 33 1.8497 1.9074 3.1180
0.937 30 12 1.2802 1.3143 2.6660
0.937 75 24 1.5398 1.4909 3.1746
Extended delta-bar-delta algorithm:
V [p.u.] S.A. [deg.] C [MVAR] VPSB [p.u.] VEDBD [p.u.] errorV [%]
0.768 10 17 1.0841 1.0756 0.7868
0.768 50 17 1.2172 1.2559 3.1811
0.831 50 17 1.2915 1.2918 0.0257
0.831 50 35 1.6316 1.6652 2.0606
0.895 45 15 1.2709 1.2950 1.8974
0.895 90 33 1.8497 1.8074 2.2873
0.937 30 12 1.2802 1.2942 1.0970
0.937 75 24 1.5398 1.5523 0.8091
Directed random search algorithm:
V [p.u.] S.A. [deg.] C [MVAR] VPSB [p.u.] VDRS [p.u.] errorV [%]
0.768 10 17 1.0841 1.0683 1.4562
0.768 50 17 1.2172 1.2299 1.0458
0.831 50 17 1.2915 1.2611 2.3535
0.831 50 35 1.6316 1.6852 3.2839
0.895 45 15 1.2709 1.2862 1.2010
0.895 90 33 1.8497 1.8861 1.9704
0.937 30 12 1.2802 1.2855 0.4161
0.937 75 24 1.5398 1.5307 0.5916
V = voltage at capacitor bus before switching, S.A. = switching angle, C = shunt capacitor capacity, VPSB = overvoltage peak calculated by PSB,
Fig. 8 – Studied system for Case 1.
4.2 Case 2
Table 2
Case 2: Some sample testing data and output.
Delta-bar-delta algorithm:
V [p.u.] S.A. [deg.] C [MVAR] VPSB [p.u.] VDBD [p.u.] errorV [%]
0.754 70 20 1.3325 1.3232 0.6965
0.754 70 42 2.0094 2.0568 2.3600
0.822 15 42 1.7158 1.6601 3.2449
0.822 55 33 1.5418 1.5232 1.2034
0.879 90 21 1.5788 1.6117 2.0807
0.879 90 14 1.1526 1.1278 2.1542
0.925 30 12 1.2697 1.2696 0.0118
0.925 60 40 1.9712 1.9034 3.4370
Extended delta-bar-delta algorithm:
V [p.u.] S.A. [deg.] C [MVAR] VPSB [p.u.] VEDBD [p.u.] errorV [%]
0.754 70 20 1.3325 1.3766 3.3113
0.754 70 42 2.0094 2.0668 2.8556
0.822 15 42 1.7158 1.7717 3.2559
0.822 55 33 1.5418 1.5251 1.0848
0.879 90 21 1.5788 1.5639 0.9409
0.879 90 14 1.1526 1.1310 1.8776
0.925 30 12 1.2697 1.2770 0.5715
0.925 60 40 1.9712 1.9566 0.7385
Directed random search algorithm:
V [p.u.] S.A. [deg.] C [MVAR] VPSB [p.u.] VDRS [p.u.] errorV [%]
0.754 70 20 1.3325 1.3328 0.0260
0.754 70 42 2.0094 1.9539 2.7607
0.822 15 42 1.7158 1.7169 0.0623
0.822 55 33 1.5418 1.5892 3.0728
0.879 90 21 1.5788 1.5593 1.2339
0.879 90 14 1.1526 1.1235 2.5275
0.925 30 12 1.2697 1.2267 3.3896
0.925 60 40 1.9712 1.9605 0.5448
V = voltage at capacitor bus before switching, S.A. = switching angle, C = shunt capacitor capacity, VPSB = overvoltage peak calculated by PSB, VDBD = overvoltage peak calculated by BDB, VEDBD = overvoltage peak calculated by EBDB, VDRS = overvoltage peak calculated by DRS, and errorV = voltage error.
into account and corresponding peak overvoltages are computed from PSB program and trained ANN. In this case, values of equivalent resistance, equivalent inductance, and equivalent capacitance are 0.00731 p.u., 0.02513 p.u., and 1.5724 p.u., respectively. Summery of few result are presented in
Table 2. It can be seen from the results that the ANNs are able to learn the pattern and give results to acceptable accuracy.
Fig. 9 – Studied system for Case 2.
5 Conclusion
This paper presents an ANN-based approach to estimate the peak overvoltages due to capacitor energization. The bar-delta, extended delta-bar-delta and directed random search has been adopted to train ANN. The proposed ANN approach is tested on a partial 39-bus New England test system. The results from this scheme are close to results from the conventional method and helpful in predicting the overvoltage of the other case studies within the range of training set.
6 References
[1] D.V. Coury, C.J. Santos, M. Oleskovicz, M.C. Tavares: Transient Analysis Concerning Capacitor Bank Switching in a Distribution System, Electric Power System Research, Vol. 65, No. 1, April 2002, pp. 13 – 21.
[2] C. Hwang, J.N. Lou: Transient Analysis of Capacitance Switching for Industrial Power System by PSpice, Electric Power System Research, Vol. 45, No. 1, April 1998, pp. 29 – 38. [3] S.A. Taher, I. Sadeghkhani: Estimation of Magnitude and Time Duration of Temporary
Overvoltages using ANN in Transmission Lines during Power System Restoration, Simulation Modelling Practice and Theory, Vol. 18, No. 6, Jun. 2010, pp. 787 – 805. [4] D. Thukaram, H.P. Khincha, S. Khandelwal: Estimation of Switching Transient Peak
Overvoltages during Transmission Line Energization using Artificial Neural Network, Electric Power System Research, Vol. 76, No. 4, Jan. 2006, pp. 259 – 269.
[6] A.S. Kumar, R.P. Gupta, A. Venkatasami, K. Udayakumar: Design Parameter based Method of Partial Discharge Detection and Location in Power Transformers, Serbian Journal of Electrical Engineering, Vol. 6, No. 2, Nov. 2009, pp. 253 – 265.
[7] S. Cundeva: A Transformer Model based on the Jiles-Atherton Theory of Ferromagnetic Hysteresis, Serbian Journal of Electrical Engineering, Vol. 5, No. 1, May 2008, pp. 21 – 30. [8] A. Ketabi, I. Sadeghkhani, R. Feuillet: Using Artificial Neural Network to Analyze
Harmonic Overvoltages during Power System Restoration, European Transactions on Electrical Power, Vol. 21, No. 7, Oct. 2011, pp. 1941 – 1953.
[9] A. Ketabi, I. Sadeghkhani: Electric Power Systems Simulation using MATLAB, Morsal Publications, Apr. 2011, (in Persian).
[10] G. Sybille, P. Brunelle, L. Hoang, L.A. Dessaint, K. Al-Haddad: Theory and Applications of Power System Blockset, a MATLAB/Simulink-based Simulation Tool for Power Systems, IEEE Power Engineering Society Winter Meeting, 23 – 27 Jan. 2000, Vol. 1, pp. 774 – 779. [11] M.M. Duro: Damping Modelling in Transformer Energization Studies for System
Restoration: Some Standard Models Compared to Field Measurements, IEEE PowerTech Conference, Bucharest, Romania, 28 June – 2 July 2009, pp. 1 – 8.
[12] P.G. Boliaris, J. M. Prousalidis, N.D. Hatziargyriou, B.C. Papadias: Simulation of Long Transmission Lines Energization for Black Start Studies, 7th Mediterranean Electrotechnical Conference, Antalya, Turkey, 12 – 14 April 1994, Vol. 3, pp. 1093 – 1096.
[13] M.M. Adibi, R.W. Alexander, B. Avramovic: Overvoltage Control During Restoration, IEEE Transaction on Power Systems, Vol. 7, No. 4, Nov. 1992, pp. 1464 – 1470.
[14] A. Ketabi, A.M. Ranjbar, R. Feuillet: Analysis and Control of Temporary Overvoltages for Automated Restoration Planning, IEEE Transaction on Power Delivery, Vol. 17, No. 4, Oct. 2002, pp. 1121 – 1127.
[15] I. Sadeghkhani, A. Ketabi, R. Feuillet: Estimation of Temporary Overvoltages during Power System Restoration using Artificial Neural Network, 15th International Conference on Intelligent System Applications to Power Systems, Curitiba, Brazil, 8 – 12 Nov. 2009, pp. 1 – 6.
[16] I. Sadeghkhani: Using Artificial Neural Network for Estimation of Switching and Resonance Overvoltages during Bulk Power System Restoration, M.Sc. Thesis, Department of Electrical Engineering, University of Kashan, Dec. 2009.
[17] I. Sadeghkhani, A. Ketabi, R. Feuillet: New Approach to Harmonic Overvoltages Reduction during Transformer Energization via Controlled Switching, 15th International Conference on Intelligent System Applications to Power Systems, Curitiba, Brazil, 8 – 12 Nov. 2009, pp. 1 – 6.
[18] Cigre Working Group: Switching Overvoltages in EHV and UHV Systems with Special Reference to Closing and Reclosing Transmission Lines, Electra, No. 30, 1973, pp. 70 – 122.
[19] S. Haykin: Neural Network: A Comprehensive Foundation, Prentice Hall, India, 1998. [20] A. Maren, C. Harston, R. Pap: Handbook of Neural Computing Applications, Academic
Press, London, UK, 1990.
[21] R. Bayindir, S. Sagiroglu, I. Colak: An Intelligent Power Factor Corrector for Power System using Artificial Neural Networks, Electric Power Systems Research, Vol. 79, No. 1, Jan. 2009, pp. 152 – 160.
[23] A. Minai, R.D. Williams: Acceleration of Back-propagation through Learning Rate and Momentum Adaptation, International Joint Conference on Neural Networks, Washington, USA, 1990, Vol. 1, pp. 676 – 679.
[24] J. Matyas: Random Optimization, Automation and Remote Control, Vol. 26, No. 2, 1965, pp. 246 –253.