www.atmos-chem-phys.net/12/5259/2012/ doi:10.5194/acp-12-5259-2012
© Author(s) 2012. CC Attribution 3.0 License.
Chemistry
and Physics
Signals of El Ni ˜
no Modoki in the tropical tropopause layer
and stratosphere
F. Xie1, J. Li1, W. Tian2, J. Feng1, and Y. Huo2
1State Key Laboratory of Numerical Modeling for Atmospheric Sciences and Geophysical Fluid Dynamics,
Institute of Atmospheric Physics, Chinese Academy of Sciences, Beijing, China
2Key Laboratory for Semi-Arid Climate Change of the Ministry of Education, College of Atmospheric Sciences,
Lanzhou University, China
Correspondence to:J. Li ([email protected])
Received: 24 October 2011 – Published in Atmos. Chem. Phys. Discuss.: 2 February 2012 Revised: 9 May 2012 – Accepted: 31 May 2012 – Published: 15 June 2012
Abstract. The effects of El Ni˜no Modoki events on the
tropical tropopause layer (TTL) and on the stratosphere were investigated using European Center for Medium Range Weather Forecasting (ECMWF) reanalysis data, oceanic El Ni˜no indices, and general climate model outputs. El Ni˜no Modoki events tend to depress convective activities in the western and eastern Pacific but enhance convective activities in the central and northern Pacific. Consequently, during El Ni˜no Modoki events, negative water vapor anomalies occur in the western and eastern Pacific upper troposphere, whereas there are positive anomalies in the central and northern Pa-cific upper troposphere. The spatial patterns of the outgo-ing longwave radiation (OLR) and upper tropospheric wa-ter vapor anomalies exhibit a tripolar form. The empirical orthogonal function (EOF) analysis of the OLR and upper tropospheric water vapor anomalies reveals that canonical El Ni˜no events are associated with the leading mode of the EOF, while El Ni˜no Modoki events correspond to the second mode. The composite analysis based on ERA-interim data indicate that El Ni˜no Modoki events have a reverse effect on middle-high latitudes stratosphere, as compared with the ef-fect of typical El Ni˜no events, i.e., the northern polar vortex is stronger and colder but the southern polar vortex is weaker and warmer during El Ni˜no Modoki events. According to the simulation’ results, we found that the reverse effect on the middle-high latitudes stratosphere is resulted from a compli-cated interaction between quasi-biennial oscillation (QBO) signal of east phase and El Ni˜no Modoki signal. This interac-tion is not a simply linear overlay of QBO signal and El Ni˜no Modoki signal in the stratosphere, it is El Ni˜no Modoki that
leads to different tropospheric zonal wind anomalies with QBO forcing from that caused by typical El Ni˜no, thus, the planetary wave propagation from troposphere to the strato-sphere during El Ni˜no Modoki events is different from that during canonical El Ni˜no events. However, when QBO is in its west phase, El Ni˜no Modoki events have the same effect on middle-high latitudes stratosphere as the typical El Ni˜no events. Our simulations also suggest that canonical El Ni˜no and El Ni˜no Modoki activities actually have the same influ-ence on the middle-high latitudes stratosphere when in the absence of QBO forcing.
1 Introduction
The El Ni˜no-Southern Oscillation (ENSO) is an important signal of interannual variability in the atmosphere. It can im-pact the troposphere by adjustment of convection patterns and can influence the stratosphere through the anomalous propagation and dissipation of ultralong Rossby waves at middle latitudes. The two reversal phases of the ENSO cycle are (1) a “warm” phase (called El Ni˜no), in which an anoma-lously warm tongue of sea surface water spreads westward from the eastern Pacific Ocean to the middle and western Pacific Ocean; and (2) a “cold” phase (called La Ni˜na), in which a broad anomalously cold tongue of sea surface water appears in this region.
These two phases result in dramatically different pterns of atmospheric convection throughout the tropical at-mosphere (Philander, 1990), i.e., the warm phase enhances
convection in the middle and eastern tropical Pacific, but de-presses convection in the western tropical Pacific, while the cold phase has the effect of weakening convection in the mid-dle and eastern tropical Pacific but enhancing convection in the western tropical Pacific. These patterns can affect the properties of the TTL, including temperature, wind veloci-ties, and water vapor and ozone concentrations (Chandra et al., 1998; Gettelman et al., 2001; Kiladis et al., 2001; Newell et al., 1996; Randel et al., 2000; Reid and Gage, 1985; Sassi et al., 2004; Yulaeva et al., 1994), which, in turn, can influ-ence stratospheric water vapor concentrations (e.g., Gettel-man et al., 2001; Sassi et al., 2004; Scaife et al., 2003). In addition, previous studies have indicated that warm phases of the ENSO can significantly enhance planetary wave activ-ities (Van Loon and Labitzke, 1987; Hamilton, 1993; Camp and Tung, 2007; Garfinkel and Hartmann, 2007; Free and Seidel, 2009; Sassi et al., 2004; Manzini et al., 2006; Garc´ıa-Herrera et al., 2006; Taguchi and Hartmann, 2006), result-ing in stronger stratospheric Brewer-Dobson (BD) circula-tion. Cagnazzo et al. (2009), on the basis of the results of several atmospheric chemistry climate models, and Free and Seidel (2009), on the basis of observations, both reported a warming of the northern polar vortex during strong warm phases of the ENSO, associated with increased ozone anoma-lies in northern high latitudes.
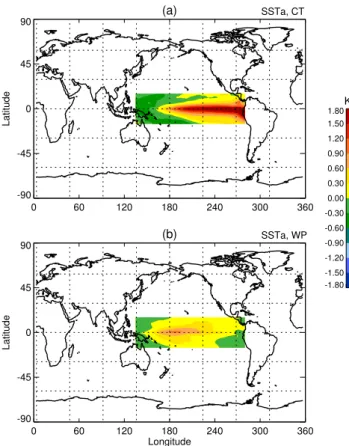
Using tropical Pacific Ocean sea surface temperatures (SST), the canonical El Ni˜no pattern can be derived from the first mode of an EOF analysis (e.g., Rasmusson and Car-penter, 1982; Trenberth, 1997; Zhang et al., 2009), showing maximum sea surface temperature anomalies (SSTA) in the eastern Pacific (Fig. 1a). However, the second mode of trop-ical Pacific Ocean SST variability depends on the study pe-riod of the data series. For example, EOF analyses performed on tropical Pacific SSTA at time scales close to or greater than 50 yr (e.g., 1948–2007 and 1880–2007) yield a cool-ing mode in the equatorial Pacific cold tongue (Zhang et al., 2010). However, for the time series from 1979 to 2004, the second mode of the EOF, which accounts for approximately 12 % of the total variance, shows a warm SSTA located in the central tropical Pacific (Ashok et al., 2007). This mode, referred to as El Ni˜no Modoki, corresponds to the third mode of the EOF analysis of long-term SSTA (e.g., 1948–2007 and 1880–2007) over the tropical Pacific (Zhang et al., 2010), which shows negative SSTAs in the eastern and western Pa-cific, and positive SSTA in the central Pacific (Fig. 1b). Yu and Kao (2007) also noticed there are two different types of ENSO, moreover, Kao and Yu (2009) and Yu et al. (2010) explain the different mechanisms which lead to the different two kinds of El Ni˜no events.
Ashok et al. (2007) found that the evolution of El Ni˜no Modoki events is related to a tripolar pattern of sea level pressure anomalies, and noted the presence of two anoma-lous Walker circulation cells associated with El Ni˜no Modoki events, versus the single cell that is associated with canoni-cal El Ni˜no events. This configuration of atmospheric
cir-K
-1.80 -1.50 -1.20 -0.90 -0.60 -0.30 0.00 0.30 0.60 0.90 1.20 1.50 1.80
(a)
0 60 120 180 240 300 360 -90
-45 0 45 90
Latitude
(b)
0 60 120 180 240 300 360 Longitude
-90 -45 0 45 90
Latitude
SSTa, CT
SSTa, WP
Fig. 1.SSTAs in the tropical Pacific Ocean referred to as canonical El Ni˜no events(a)and El Ni˜no Modoki events(b). The logogram CT on the top right corner of a panel represents the canonical El Ni˜no events. The logogram of WP represents the El Ni˜no Modoki events. CT and WP in the following figures have the same meaning.
culation in El Ni˜no Modoki events appears to influence the troposphere in a different way than that of canonical El Ni˜no events. Weng et al. (2007, 2009) assessed the impact of El Ni˜no Modoki events on the climate of China, Japan, and the United States, during the boreal summer and winter, on the basis of data from three El Ni˜no Modoki events. They found that El Ni˜no Modoki activities influence climate in a different way to that of canonical El Ni˜no activities. Re-cently, The modulation of SSTA on convection, and the re-sulting effects of El Ni˜no Modoki events on regional rainfall, have received considerable attention (Taschetto and England, 2009; Cai and Cowan, 2009; Feng and Li, 2011; Zhang et al., 2010). Those studies indicate that the two types of El Ni˜no (canonical El Ni˜no and El Ni˜no Modoki) show contrast-ing impacts on regional rainfall patterns. On the one hand, both Walker circulation patterns and the effects of convec-tion anomalies caused by El Ni˜no Modoki activities can ex-tend to the TTL. On the other hand, the gradient patterns of SSTA of canonical El Ni˜no and El Ni˜no Modoki events would be associated with distinctly different patterns of prop-agation and dissipation of ultralong Rossby waves in the mid-latitude stratosphere, which may lead to profoundly different
effects on the stratosphere. Recently, some studies have noted distinct temperature and circulation anomalies in the strato-sphere caused by the two types of El Ni˜no activities (Hur-witz et al., 2011a, b; Zubiaurre and Calvo, 2012), although the possible relationships between temperature changes and wave activities or circulation anomalies are deserve further discussed.
The influence of warm vs. cold phases of the ENSO on the atmosphere has been carefully investigated in the past, whereas the atmospheric response to El Ni˜no Modoki events, especially in the TTL and stratosphere, has not to receive sufficient attention. Since the late 1970s El Ni˜no Modoki events are increasing (Ashok and Yamagata, 2009; Yeh et al., 2009). It is necessary to more comprehensive understanding of the effects of El Ni˜no Modoki activities on atmosphere. This study investigates the effects of El Ni˜no Modoki activi-ties on the TTL and stratosphere, and compared those effects with those of canonical El Ni˜no activities. The remainder of the manuscript is organized as follows. Section 2 describes the data used in the study and related numerical simulations. Section 3 discusses how patterns of atmospheric convection, the tropopause temperature, and water vapor changes in the upper troposphere and tropopause, are related to the activities of the two types of El Ni˜no. Section 4 analyzes variations in stratospheric wave activities, and circulation and temperature patterns associated with the two types of El Ni˜no activities. Finally, the conclusions are presented in Sect. 5.
2 Data and simulations
The data used in the present study include outgoing long-wave radiation (OLR), tropopause temperature, water vapor concentration, and wind field data. The OLR data from 1979 to 2010 were obtained from http://www.cdc.noaa.gov/. The monthly mean European Center for Medium Range Weather Forecasting (ECMWF) reanalysis data (ERA-Interim) from 1979 to 2010 were analyzed mainly for tropopause temper-atures, tropospheric water vapor concentrations, and strato-spheric wind fields and temperatures. The ERA-Interim data assimilates new model outputs and satellite observations, and provide data at horizontal resolutions of 1.5×1.5◦and rela-tively high vertical resolutions (Simmons et al., 2007a, b; Up-pala et al., 2008). The ERA-Interim data are therefore suit-able for diagnosing water vapor concentrations and tempera-ture anomalies in the TTL, and wind fields and temperatempera-tures in the stratosphere.
The monthly Nino 3 index (5◦N–5◦S, 150–90◦W),
here-after N3I, and the ENSO Modoki index, herehere-after EMI, were used to identify monthly occurrences of canonical El Ni˜no events and El Ni˜no Modoki events, respectively. N3I is defined as the area mean SSTA over the region 5◦S– 5◦N, 150–90◦W, and is available at http://www.cpc.noaa. gov/data/indices/. Following Ashok et al. (2007), the EMI is defined as follows:
Table 1.Samples of canonical El Ni˜no (left column) and El Ni˜no Modoki (right column) events from 1980 to 2010 analyzed in this paper.
Canonical El Ni˜no El Ni˜no Modoki
JUL1982–AUG1983 SEP1990–DEC1991 DEC1986–JAN1988 APR1994–JUN1995 MAY1997–MAY1998 JUN2002–APR2003 AGU2006–JAN2007 JUN2004–DEC2004
EMI= [SSTA]C−0.5× [SSTA]E−0.5× [SSTA]W
where the subscripted brackets represent the area mean SSTA over the central Pacific region ([SSTA]C: 10◦S–10◦N,
165◦E–140◦W), the eastern Pacific region ([SSTA]
E: 15◦S–
5◦N, 110–70◦W), and the western Pacific region ([SSTA] W:
10◦S–20◦N, 125–145◦E). Months with canonical El Ni˜no
event were identified by the corresponding N3I values equal to or greater than +0.5◦C in those months. Similarly, months with El Ni˜no Modoki events were identified by the corre-sponding EMI values equal to or greater than +0.5◦C. Sev-eral strong and long time continuous El Ni˜no events have been selected for this study (Table 1). The NOAA OLR, and ERA-Interim were divided into two groups on the basis of the N3I and EMI data. Group one contains data records marked with canonical El Ni˜no events. Group two contains data recorders marked with El Ni˜no Modoki events. The canonical El Ni˜no and El Ni˜no Modoki anomalies are calcu-lated using composites of the detrended and deseasonalized time series for canonical El Ni˜no and El Ni˜no Modoki events, respectively.
Our composite results, based on reanalysis data and ob-servations, were also compared with time-slice simulations derived from the Whole Atmosphere Community Climate Model, version 4 (WACCM4 be included in the CESM1.0.4), using forcing of observed canonical El Ni˜no and El Ni˜no Modoki SSTs from the tropical Pacific. The WACCM, de-veloped by the National Center for Atmospheric Research (NCAR), is unable to internally simulate quasi-biennial os-cillation (QBO) signals; however, it can rationally simu-late atmospheric ENSO signals (Garcia et al., 2007). So far, WACCM4 is the newest model for WACCM. Compared with the old version of WACCM, it has great improvements (http: //www.cesm.ucar.edu/models/cesm1.0/). WACCM4 has 66 vertical levels extending from the ground to 4.5×10⁻⁶hPa
(∼145 km geometric altitude), and the model’s vertical res-olution is 1.1–1.4 km in the TTL and the lower stratosphere (<30 km). The time-slice simulations presented in this pa-per were pa-performed at a resolution of 1.9×2.5◦, with inter-active chemistry disabled. The former three runs were con-ducted with configurations using the same greenhouse gas (GHG) emissions but different SST forcing. The SST used in the control experiment (R1) is observed monthly mean cli-matology for the time period from 1979 to 2010. In exper-iment R2, SST is as in R1, except that the tropical Pacific
W/m2
-15.0 -12.0 -9.0 -6.0 -3.0 0.0 3.0 6.0 9.0 12.0 15.0
-3.5 -2.8 -2.1 -1.4 -0.7 0.0 0.7 1.4 2.1 2.8 3.5
(a)
0 60 120 180 240 300 360
-25 0 25
Latitude
(b)
0 60 120 180 240 300 360
-25 0 25
(c)
0 60 120 180 240 300 360
Longtitude -25
0 25
Latitude
(d)
0 60 120 180 240 300 360
Longtitude -25
0 25
(e)
1980 1985 1990 1995 2000 2005 2010
year -4
-2 0 2 4
Index
(f)
1980 1985 1990 1995 2000 2005 2010
year -4
-2 0 2 4
NOAA OLRa, CT NOAA OLRa, WP
EOF1, 16% EOF2, 8%
PC1vsNINO3, 0.75 PC2vsMODOKI, 0.60
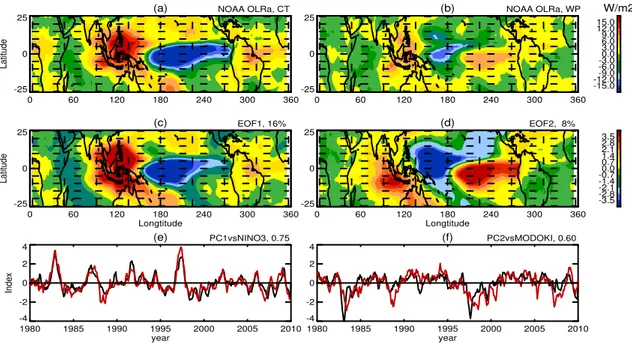
Fig. 2.Composite OLR anomalies for(a)canonical El Ni˜no events, and(b)El Ni˜no Modoki events, based on NOAA data for 1979–2010. Contour interval,±3 W m−2.(c)and(d)are the leading and second modes of the EOF spatial pattern of OLR anomalies, respectively. Contour interval,±0.007.(e)and(f)are the leading and second modes of PC interannual variability, respectively. The red line in(e)is the N3I; the red line in(f)is the EMI. The values at the top right corners of(e)and(f)are correlation coefficients describing the correlations between the datasets.
SST represents composite of observed SST associated with canonical El Ni˜no conditions, for the period 1979–2010. In experiment R3, the SST is as in R1, but the tropical Pa-cific SST represents composite of observed SST associated with El Ni˜no Modoki conditions. The observed SST data is from the Meteorological Office, Hadley Centre for Cli-mate Prediction and Research, SST and sea-ice field datasets (Rayner et al., 2006). The averaged differences of SSTs in the tropical Pacific between sensitive experiments and the control experiment (R2–R1 and R3–R1) are similar with the SSTAs in Fig. 1a and b. The fixed GHG values used in the model radiation scheme are based on emissions scenario A2 of the Intergovernmental Panel on Climate Change (IPCC) (WMO, 2003), averaged GHG values for the period 1979– 2010. QBO phase signals for 28 months fixed circle are in-cluded in WACCM4 as an external forcing for zonal wind. To further examine whether the stratospheric El Ni˜no anomalies are different with and without the QBO in the model, the other three experiments (R4, R5, and R6) are performed to investigate the circulation anomalies in the stratosphere dur-ing two kinds of El Ni˜no events in the absence of QBO. The experiments R4, R5 and R6 have the same figuration as the experiment R1, R2 and R3, respectively, except that the ex-periments R4, R5, and R6 are run without impose a QBO forcing in the model. Six experiments were all ran for 33 yr with the first 3 yr excluded for the model spin-up and only the remaining 30 yr are used for the analysis. The model
cli-matologies are based on the last 30 yr of the model output except when otherwise stated.
3 Anomalies in the TTL associated with the two types
of El Ni ˜no
Changes in SST cause profound changes in atmospheric con-vection. In this paper, the magnitude of OLR is used as a proxy for the intensity of convective activity. Figure 2 shows OLR anomalies associated with canonical El Ni˜no and El Ni˜no Modoki events. It is evident that typical El Ni˜no phases have different impacts on convection patterns in different tropical regions, i.e., enhanced convection (negative OLR anomalies) occurs in the middle and eastern Pacific during canonical El Ni˜no events, while reduced convection (positive OLR anomalies) occurs in the western and northern Pacific (Fig. 2a). The spatial patterns and magnitudes of the OLR anomalies exhibited in Fig. 2a are similar to those reported in previous studies (e.g., Philander, 1990; Deser and Wallace, 1990; Yulaeva et al., 1994; Kiladis et al., 2001; Gettelman et al., 2001).
Using regression analysis, Trenberth and Smith (2009) pointed out that the OLR signatures of the two types of El Ni˜no are quite similar. However, it was found that the com-posite anomalies of convective activities associated with El Ni˜no Modoki events (Fig. 2b) are somewhat different from those associated with canonical El Ni˜no events (Fig. 2a). El Ni˜no Modoki events depress convection in the western
and eastern Pacific but intensify convection in the central and northern Pacific. In addition, the positive and nega-tive anomalies over the middle and western Pacific, respec-tively, during El Ni˜no Modoki are weaker than those associ-ated with canonical El Ni˜no events. Furthermore, the OLR anomalies show a tripolar form as SSTA during El Ni˜no Modoki events, with patterns that correspond to patterns of rainfall anomalies, as noted by Ashok et al. (2007) and Weng et al. (2009).
The EOF analysis of deseasonalized and detrended monthly mean OLR anomalies, for the period 1979–2010, can effectively isolate El Ni˜no variability. The leading mode, which explains 16 % of the variance of EOF spatial pat-terns, is similar to the canonical El Ni˜no pattern of OLR anomalies (Fig. 2a and c). The interannual variability of the leading mode of EOF time patterns (Principal Component, PC) (Fig. 2e, black line) and the N3I (Fig. 2e, red line) are strongly correlated (linear correlation coefficient, 0.75). This result is in agreement with that of previous studies (Gettelman et al., 2001; Kiladis et al., 2001). Gettelman et al. (2001) noted that the second mode of the EOF analysis of OLR anomalies is also statistically significant, explaining about 8 % of the variance of EOF spatial patterns, and maps strongly onto the central and western Pacific. They further note that the second mode is similar to a second ENSO mode (the “Trans-Ni˜no Index”) described by Trenberth and Stepa-niak (2001). Figure 2d and f show EOF spatial patterns and interannual variabilities of PC corresponding to the second mode of EOF analysis. The results show that the EOF spa-tial pattern corresponds to OLR anomalies during El Ni˜no Modoki events (Fig. 2b and d), and the PC mode is strongly correlated with the EMI (Fig. 2f, black and red lines) (lin-ear correlation coefficient, 0.60). This finding indicates that the second mode of the OLR anomalies corresponds with the Modoki pattern, as noted by Gettelman et al. (2001).
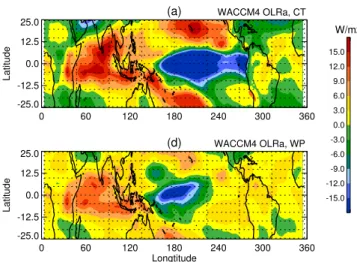
The patterns of OLR anomalies of the two types of El Ni˜no can also be obtained from the WACCM4 forced by ob-served SSTA (Fig. 3). Figure 3a and b show the OLR differ-ences between run R2 and R1 and between run R3 and R1, respectively. The patterns of OLR anomalies generated by the WACCM4 are broadly similar to the composite results of observations (Fig. 2a and b; Fig. 3a and b). However, in the observations, the maximum OLR anomaly that is located over the Maritime Continent migrates to the north Pacific in the model, and in the Indian Ocean, negative anomalies in observed OLR values change to positive anomalies in the model results. The discrepancies between observations and NCAR model outputs have also been noted by Gettelman et al. (2001). Actually, the SST in the Indian Ocean would change when El Ni˜no events occur. Those discrepancies may be because we don’t consider the variations of SST over In-dian Ocean during El Ni˜no events in our simulations.
In summary, the above analysis shows that El Ni˜no Modoki activities have a significantly different influence on the troposphere than typical El Ni˜no activities do.
Separat-W/m2
-15.0 -12.0 -9.0 -6.0 -3.0 0.0 3.0 6.0 9.0 12.0 15.0
(a)
0 60 120 180 240 300 360 -25.0
-12.5 0.0 12.5 25.0
Latitude
(d)
0 60 120 180 240 300 360 Longtitude
-25.0 -12.5 0.0 12.5 25.0
Latitude
WACCM4 OLRa, CT
WACCM4 OLRa, WP
− −
Fig. 3.Averaged OLR anomalies for R2–R1(a)and R3–R1(b). Contour interval,±3 W m−2.
ing the effects of El Ni˜no Modoki activities and canonical El Ni˜no activities is critical for considering the impacts of El Ni˜no activities on the atmosphere.
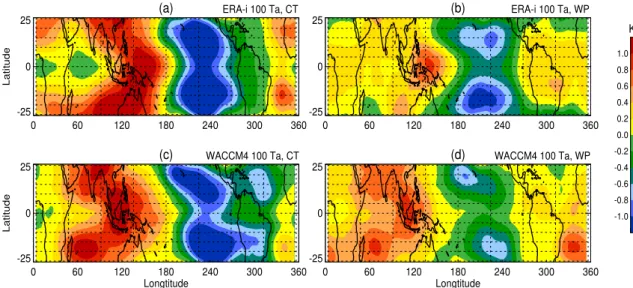
It is well known that changes in convection patterns can profoundly affect tropical circulation. Variations in convec-tion and circulaconvec-tion patterns resulting from SSTA have been shown to significantly influence tropopause temperatures (Reid and Gage, 1985). These patterns of change can be confirmed at several levels in the TTL. Here, the composite anomalies of 100 hPa temperatures associated with canoni-cal El Ni˜no and El Ni˜no Modoki events are analyzed, based on ERA-Interim data from 1979 to 2010 (Fig. 4). The results indicate cooling in the middle and eastern Pacific at 100 hPa during canonical El Ni˜no events, while in the western Pacific region, where typically referred to as the “cold trap region” (Newell and Gould-Stewart, 1981), the 100 hPa temperature shows a warming exceeding 1.0 K (Fig. 4a). The spatial pat-terns and magnitudes of the temperature anomalies exhibited in Fig. 4a are in agreement with the results of previous stud-ies (e.g., Randel et al., 2000; Scaife et al., 2003; Xie et al., 2011). Figure 4a shows that 100 hPa temperature signals of canonical El Ni˜no is opposite to that of tropical SST. Previ-ous studies have shown that the sign of the El Ni˜no signal is opposite to that of the tropical lower stratosphere (Reid et al., 1989; Yulaeva et al., 1994). Calvo et al. (2004) suggested that cooling of the tropical lower stratosphere over the east-ern Pacific during warm phases of ENSO is related to inter-nal equatorial waves associated with SSTA that force anoma-lous convection in the troposphere. Although Fig. 2 shows differences in the convection patterns of canonical El Ni˜no and El Ni˜no Modoki events, the patterns of 100 hPa tempera-ture anomalies in the two types of El Ni˜no events are similar; this result is in agreement with the results of Trenberth and Smith (2009). However, the 100 hPa temperature anomalies are smaller in El Ni˜no Modoki events than in canonical El
K
-1.0 -0.8 -0.6 -0.4 -0.2 0.0 0.2 0.4 0.6 0.8 1.0
(a)
0 60 120 180 240 300 360
-25 0 25
Latitude
(b)
0 60 120 180 240 300 360
-25 0 25
(c)
0 60 120 180 240 300 360
Longtitude -25
0 25
Latitude
(d)
0 60 120 180 240 300 360
Longtitude -25
0 25
ERA-i 100 Ta, CT ERA-i 100 Ta, WP
WACCM4 100 Ta, CT WACCM4 100 Ta, WP
Fig. 4.Composite temperature anomalies at 100 hPa for(a)canonical El Ni˜no events and(b)El Ni˜no Modoki events, based on ERA-Interim data for 1979–2010. Temperature anomalies at 100 hPa for R2–R1(c)and R3–R1(d). Contour interval,±0.2 K.
Ni˜no events (Fig. 4a and b). This phenomenon is further con-firmed by WACCM4 simulations (Fig. 4c and d), implying that the internal equatorial waves, which affect tropopause temperature anomalies during ENSO periods, may be mainly motivated by the SSTAs in the equatorial western and mid-dle Pacific, as patterns of SSTAs in these two regions during canonical El Ni˜no and El Ni˜no Modoki events are the same (Fig. 1). Because the SSTA gradient between the middle and western Pacific during El Ni˜no Modoki events is weaker than that observed during canonical El Ni˜no events, the corre-sponding tropopause temperature anomalies are also smaller (Fig. 4).
Figure 5 shows the cold point tropopause temperature anomalies associated with the two types of El Ni˜no events. Here, the cold point tropopause is determined as the pressure level in the upper troposphere and lower stratosphere that has the lowest temperature. Figure 5 shows that the distributions and magnitudes of cold point tropopause temperature anoma-lies are similar to those of 100 hPa temperature anomaanoma-lies.
A variety of processes govern water vapor concentrations in the TTL (see chapter 3 in SPARC, 2000). In the upper tro-posphere, water vapor concentrations are strongly correlated with convective activity (Chandra et al., 1998; Gettelman et al., 2001; McCormack et al., 2000; Newell et al., 1996). In the tropopause layer, temperature is a principal factor con-trolling water vapor changes, via freeze-drying processes (Brewer, 1949; Holton et al., 1995). Thus, changes in con-vection patterns and tropopause temperature during the two types of El Ni˜no periods are likely linked with water vapor changes. In the subsequent paragraph, water vapor anomalies in the TTL during canonical El Ni˜no and El Ni˜no Modoki events are discussed, using ERA-Interim data, which may help to clarify patterns of stratospheric water vapor change during these two types of events.
Figure 6 shows upper tropospheric (250 hPa) water vapor anomalies for the two types of El Ni˜no events. The data in-dicate that canonical El Ni˜no activities significantly moisten the upper troposphere in the middle and eastern Pacific and the Indian Ocean (Fig. 6a), but dry the upper troposphere over the western Pacific and the Maritime Continent. This finding is consistent with observations of single El Ni˜no events (Newell et al., 1996; Chandra et al., 1998; Gettelman el al., 2001). The upper tropospheric water vapor anomalies during El Ni˜no Modoki periods show a different pattern from those of canonical El Ni˜no periods. The locations of the max-imum water vapor anomalies shift westward (Fig. 6b), and a negative anomaly is observed over the eastern Pacific. The magnitudes of positive and negative anomalies over the cen-tral Pacific and the Maritime Continent, respectively, dur-ing El Ni˜no Modoki events are reduced, as compared with the anomalies associated with canonical El Ni˜no events. The anomaly patterns in Fig. 6a and b resemble the OLR pat-terns during canonical El Ni˜no and El Ni˜no Modoki phases (Fig. 2a and b), respectively. That is, upper troposphere hu-midity anomalies are correlated with convection patterns. In addition, the EOF analysis revealed that the leading mode of the 250 hPa water vapor anomalies is associated with canon-ical El Ni˜no patterns, while the second mode is associated with El Ni˜no Modoki patterns (not shown). Figure 6c and d shows the 250 hPa water vapor anomalies in the two types of El Ni˜no events obtained by the simulations from WACCM4 forced with observed SSTA. The model results are in good agreement with observations in the Pacific region. However, in the Indian Ocean a negative water vapor anomaly can be noted in simulations which is different from observations (Fig. 6a, b, c and d).
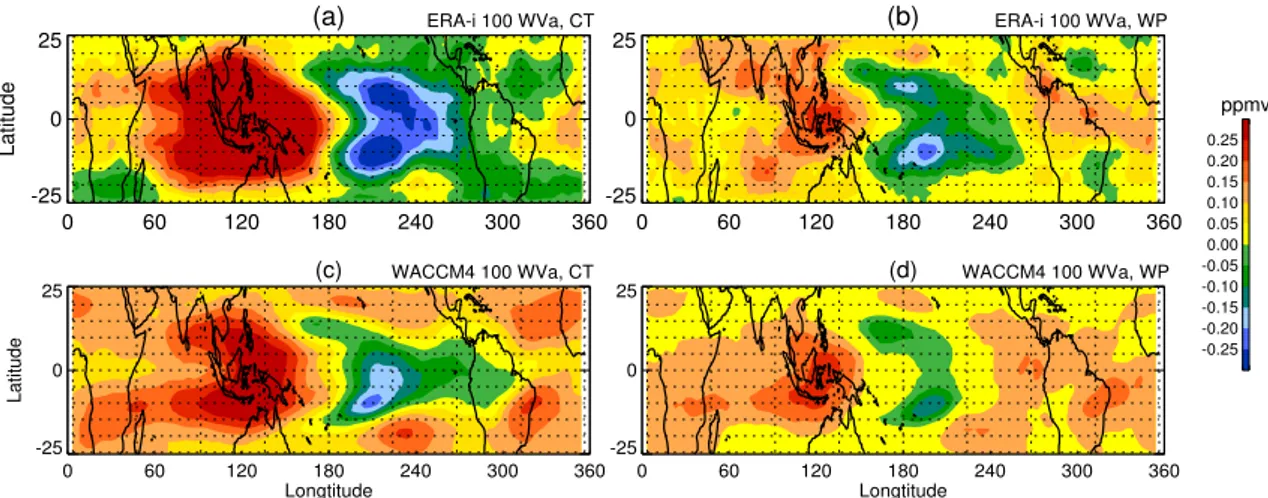
Figure 7 shows water vapor anomalies in the two types of El Ni˜no events at 100 hPa. The anomalies during canonical
K
-1.0 -0.8 -0.6 -0.4 -0.2 0.0 0.2 0.4 0.6 0.8 1.0
(a)
0 60 120 180 240 300 360 -25
0 25
Latitude
(b)
0 60 120 180 240 300 360 -25
0 25
(c)
0 60 120 180 240 300 360 Longtitude
-25 0 25
Latitude
(d)
0 60 120 180 240 300 360 Longtitude
-25 0 25
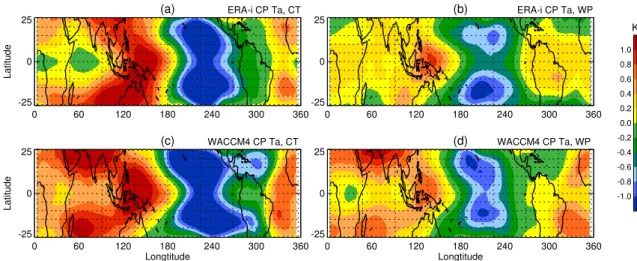
ERA-i CP Ta, CT ERA-i CP Ta, WP
WACCM4 CP Ta, CT WACCM4 CP Ta, WP
Fig. 5.Cold point temperature anomalies in the tropopause based on composite ERA-Interim data, 1979–2010:(a)canonical El Ni˜no events, and(b)El Ni˜no Modoki events. Anomalies in cold point tropopause temperatures, for R2–R1(c)and R3–R1(d). Contour intervals,±0.2 K.
ppmv
-25.00 -20.00 -15.00 -10.00 -5.00 0.00 5.00 10.00 15.00 20.00 25.00
(a)
0 60 120 180 240 300 360
-25 0 25
Latitude
(b)
0 60 120 180 240 300 360
-25 0 25
(c)
0 60 120 180 240 300 360 Longtitude
-25 0 25
Latitude
(d)
0 60 120 180 240 300 360 Longtitude
-25 0 25
ERA-i 250 WVa, CT ERA-i 250 WVa, WP
WACCM4 250 WVa, CT WACCM4 250 WVa, WP
Fig. 6.Water vapor anomalies at 250 hPa based on composite ERA-Interim data, 1979–2010:(a)canonical El Ni˜no events and(b)El Ni˜no Modoki events. Water vapor anomalies at 250 hPa for R2–R1(c)and R3–R1(d). Contour intervals,±5 ppmv water vapor.
El Ni˜no events (Fig. 7a) are generally consistent with perature anomalies (Fig. 4a), i.e., negative and positive tem-perature anomalies are associated with negative and positive water vapor anomalies, respectively. As expected, patterns of water vapor anomalies in El Ni˜no Modoki events are similar to those of canonical El Ni˜no events (Fig. 7a and b); this is related to the fact that the two types of El Ni˜no cause similar patterns of 100 hPa temperature anomalies (Fig. 4a and b). Similarly, the 100 hPa water vapor anomalies in El Ni˜no Modoki events are smaller than those observed in canoni-cal El Ni˜no events; this is related to that the two types of El Ni˜no cause different degree of anomalies of 100 hPa temper-ature. These results are confirmed by WACCM4 simulations (Fig. 7c and d).
4 El Ni ˜no Modoki signals in the stratosphere
The different SST-gradient patterns associated with canoni-cal El Ni˜no and El Ni˜no Modoki events is likely to lead to the anomalous propagation and dissipation of ultralong Rossby waves in the stratosphere, which would cause profound and distinct stratospheric circulation anomalies. Thus, this sec-tion considers the effects of the two types of El Ni˜no activi-ties on circulation in the stratosphere, beginning with an anal-ysis of the changes in Eliassen-Palm (E-P) fluxes (Eliassen and Palm, 1961; Andrews et al., 1987). E-P fluxes which represent wave activities related to the strengths of BD cir-culation and zonal mean flow, have been applied to analyze planetary wave propagation in previous studies (e.g., Randel, 1987; Hu and Tung, 2002; Hitoshi and Hirooka, 2004). An expression to calculate the E–P flux was given by Andrews et al. (1987). The meridional and vertical components of the
ppmv
-0.25 -0.20 -0.15 -0.10 -0.05 0.00 0.05 0.10 0.15 0.20 0.25
(a)
0 60 120 180 240 300 360
-25 0 25
Latitude
(b)
0 60 120 180 240 300 360
-25 0 25
(c)
0 60 120 180 240 300 360 Longtitude
-25 0 25
Latitude
(d)
0 60 120 180 240 300 360 Longtitude
-25 0 25
ERA-i 100 WVa, CT ERA-i 100 WVa, WP
WACCM4 100 WVa, CT WACCM4 100 WVa, WP
Fig. 7.Water vapor anomalies at 100 hPa based on composite ERA-Interim data, 1979–2010:(a)canonical El Ni˜no events and(b)El Ni˜no Modoki events. Water vapor anomalies at 100 hPa for R2–R1(c)and R3–R1(d). Contour intervals,±0.05 ppmv water vapor.
E-P flux are, respectively: Fy= −ρoa(cosφ)v′u′
Fz=ρoa(cosφ)f v′θ′/θ0z,
whereρois the density of background air,θ is the potential
temperature,a is the radius of the earth,νis the meridional wind,uis the zonal wind,φis the Earth’s latitude, andf is Coriolis parameter. The subscriptzdenotes derivatives with respect to heightz. The overbar denotes deviations from the zonal mean.
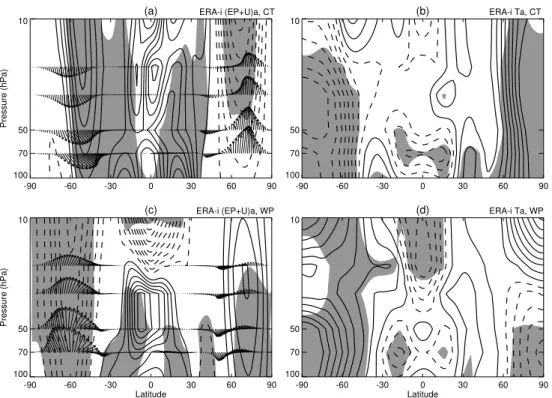
Figure 8 shows anomalies of the E-P flux, zonal wind, and temperature induced by two types of El Ni˜no activi-ties based on ERA-interim data. Anomalies that are signif-icant at the 90 % confidence level according to Student’s t-test are shaded. Figure 8a demonstrates that canonical El Ni˜no events increase the upward propagation of wave ac-tivity in the stratosphere in the Northern Hemisphere mid-latitudes, which suggests a strengthening of BD circulation in the Northern Hemisphere. Consequently, the northern po-lar vortex is weakened and warmed (Fig. 8a and b). These results are consistent with those of previous studies, showing that BD circulation in the Northern Hemisphere is enhanced during El Ni˜no events (Manzini et al., 2006; Garfinkel and Hartmann, 2007; Free and Seidel, 2009), and that a warm-ing of the northern polar vortex occurs durwarm-ing strong warm phases of ENSO can be found in both simulation (Cagnazzo et al., 2009) and observation (Free and Seidel, 2009). Re-cently, Hu and Pan (2009) found that tropical SST forces a warming trend in the Arctic stratosphere in early winter months in the past few decades, it may relates to the high frequency of warm phases of ENSO. Moreover, we found a significant decrease in wave activity in the Southern Hemi-sphere stratoHemi-sphere suggests diminished BD circulation dur-ing canonical El Ni˜no events, which is conductive to an in-crease in zonal wind in mid-latitudes stratosphere. Figure 8
also shows that canonical El Ni˜no activities have no signifi-cant impact on the strength of the southern polar vortex; how-ever, cooling is apparent in the southern polar vortex (Figs. 8a and b). This may be because the decreased EP fluxes in the Southern Hemisphere (Fig. 8a) reduce wave driven dynamic heat that lead to the significant cooling in the polar region. In addition, it also may be a result of decreased ozone transport from the tropical stratosphere to the Southern Hemisphere high-latitude stratosphere, and weakened adiabatic compres-sion in the southern polar vortex because of weakened BD circulation during canonical El Ni˜no events in the Southern Hemisphere.
It is interesting that the anomalies in wave activity, zonal wind, and temperature during El Ni˜no Modoki events are, overall, different from those during canonical El Ni˜no events. El Ni˜no Modoki events cause a significant increase in wave activity in the Southern Hemisphere mid-latitude re-gions, which depresses and warms the southern polar vor-tex (Fig. 8c and d). Lin et al. (2012) and Hu and Fu (2009) found the stratosphere in the Southern Hemisphere high lati-tudes is warming since 1979 which may related with the high frequency of El Ni˜no Modoki events. In a regression analy-sis using Japanese Reanalyanaly-sis (JRA-25) and 40-yr European Centre for Medium-Range Weather Forecasts Re-Analysis (ERA-40) datasets, Trenberth and Smith (2006 and 2009) noticed different stratospheric temperatures in the South-ern Hemisphere corresponding to the two types of El Ni˜no events. These anomalies can also be reproduced by gen-eral climate model simulations (Zhou and Zhang, 2010). Through a composite analysis using a variety of reanalysis data, Hurwitz et al. (2011a) found a warming effect of El Ni˜no Modoki events on the southern polar vortex, and they further noted that the enhancement of wave activity in the Southern Hemisphere is associated with the easterly phase of the QBO during El Ni˜no Modoki events. However, we found El Ni˜no Modoki activities also have a relatively weak but
(a)
-90 -60 -30 0 30 60 90
100 70 50 10
Pressure (hPa)
(b)
-90 -60 -30 0 30 60 90
100 70 50 10
(c)
-90 -60 -30 0 30 60 90
Latitude 100
70 50 10
Pressure (hPa)
(d)
-90 -60 -30 0 30 60 90
Latitude 100
70 50 10
ERA-i (EP+U)a, CT ERA-i Ta, CT
ERA-i (EP+U)a, WP ERA-i Ta, WP
Fig. 8.Composite anomalies of the E-P flux and zonal wind for(a)canonical El Ni˜no events and(c)El Ni˜no Modoki events, based on ERA-Interim data for 1979–2010. The unit horizontal vector is 107kg s−1and the unit vertical vector is 105kg s−1. The contour interval for zonal wind anomalies is±0.25 m s−1. Composite anomalies of temperature for(b)canonical El Ni˜no events and(d)El Ni˜no Modoki events, based on ERA-Interim data for 1979–2010. Contour interval for temperature anomalies,±0.15 K. Anomalies that are significant at the 90 % confidence level according to Student’s t-test are shaded. Solid and dashed lines represent positive and negative anomalies, respectively.
significant effect on the Northern Hemisphere high-latitude stratosphere; they suppress the upward propagation of wave activity, which corresponds to a stronger and colder north-ern polar vortex. Note that significant zonal wind and tem-perature anomalies in the tropical stratosphere correspond-ing to the two types of El Ni˜no events should be related to the QBO; however, the anomalies in El Ni˜no Modoki events show diverse patterns as compared with those of typical El Ni˜no events (Fig. 8). That is, positive and negative anoma-lies in upper stratosphere zonal wind are of typical El Ni˜no and El Ni˜no Modoki periods, respectively, and positive and negative anomalies in lower stratosphere temperatures are of typical El Ni˜no and El Ni˜no Modoki periods, respectively.
The results in Fig. 8 imply that canonical El Ni˜no events have a more significant impact on the high-latitude North-ern Hemisphere stratosphere than they do on the high-latitude Southern Hemisphere stratosphere. In contrast, El Ni˜no Modoki events can more profoundly influence the latitude Southern Hemisphere stratosphere than the high-latitude Northern Hemisphere stratosphere.
Some previous studies pointed out that the El Nino Modoki signal in the stratosphere is not sensitive to QBO phases (Hurwitz et al., 2011b; Zubiaurre and Calvo, 2012; Sassi et al., 2004). However, Hurwitz et al. (2011a) showed that the enhancement of wave activity in the Southern
Hemi-sphere is associated with the easterly phase of the QBO dur-ing El Ni˜no Modoki events. Garfinkel and Hartmann (2008 and 2010) found that the QBO can alter the strength of the interaction between North Pacific teleconnection (PNA) and El Ni˜no in the troposphere. In particular they showed that El Ni˜no teleconnections are weaker during the QBO east phase than during QBO west phase. Since the wave activities in the stratosphere and PNA can be modified by the QBO, it is un-derstandable that stratospheric responses to El Ni˜no Modoki events are sensitive to different phases of the QBO.
Figure 9 shows the composite anomalies of the tro-pospheric zonal wind and 300 hPa geopotential anomalies based on ERA-interim data for canonical El Ni˜no events and El Ni˜no Modoki events. It is apparent from Fig. 9a and b that typical El Ni˜no give rise to a stronger subtropical jet which results in a stronger PNA. Thus, more planetary waves are transported into the Northern Hemisphere high-latitude stratosphere and result in a weaker polar vortex (Fig. 8a and b). The results here are in accordance with the results in Garfinkel and Hartmann (2008 and 2010). On contrast, the subtropical jet anomalies in El Ni˜no Modoki events are much smaller than those in canonical El Ni˜no events in the both hemisphere and the PNA anomalies are not significant during El Ni˜no Modoki events. The zonal wind anomalies in the middle-high latitudes in El Ni˜no Modoki events are also
(a)
-90 -60 -30 0 30 60 90
1000 700 300 100
Pressure (hPa)
(b)
0 60 120 180 240 300 360
-90 -60 -30 0 30 60 90
Latitude
(c)
-90 -60 -30 0 30 60 90
Latitude 1000
700 300 100
Pressure (hPa)
(d)
0 60 120 180 240 300 360
Longitude -90
-60 -30 0 30 60 90
Latitude
ERA-i Ua, CT ERA-i Za, CT
ERA-i Ua, WP ERA-i Za, WP
Fig. 9.Composite anomalies of the zonal wind for(a)canonical El Ni˜no events and(c)El Ni˜no Modoki events, based on ERA-Interim data for 1979–2010. The contour interval for zonal wind anomalies is±0.4 m s−1. Composite anomalies of the Geopotential at 300 hPa for(b) canonical El Ni˜no events and(d)El Ni˜no Modoki events, based on ERA-Interim data for 1979–2010. The contour interval for Geopotential anomalies is±100 m2s−2. Anomalies that are significant at the 90 % confidence level according to Student’s t-test are shaded. Solid and dashed lines represent positive and negative anomalies, respectively.
very much different from those in typical El Ni˜no (Fig. 9c and d). Given the above differences in subtropical jet, PNA and zonal wind, the wave propagation from troposphere to the stratosphere during El Ni˜no Modoki events should be dif-ferent from that during canonical El Ni˜no events. This is the main reason that the circulation anomalies during El Ni˜no Modoki events are much different from those in canonical El Ni˜no events in the high-latitude stratosphere (Fig. 8).
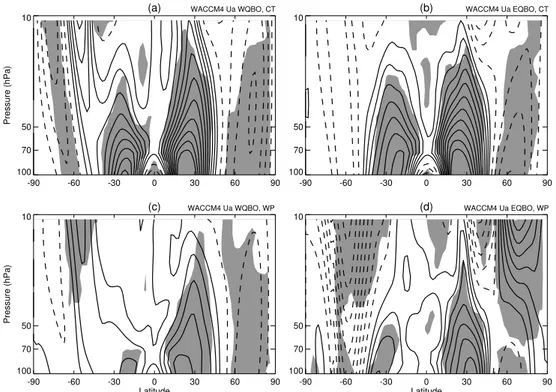
Figure 10 further shows differences of the zonal wind be-tween run R2 and R1, and bebe-tween run R3 and R1 under different phases of the QBO. It is apparent that, no mat-ter in QBO west and east phase, canonical El Ni˜no causes the same zonal wind anomalies in the stratosphere (Fig. 10a and b) and the anomalies are in accordance with the compos-ite analysis based on ERA-interim data (Fig. 8a). On con-trast, El Ni˜no Modoki leads to different zonal wind anoma-lies during QBO west and east phases (Fig. 10c and d). In the QBO west phase, the zonal wind anomalies caused by El Ni˜no Modoki are similar with the anomalies resulted from canonical El Ni˜no (Fig. 10c, a and b). However, in the QBO east phase, the negative zonal wind anomalies in the south-ern high-latitude stratosphere (weaker Antarctic polar vor-tex) caused by El Ni˜no Modoki are much larger than those in the QBO west phase, and those negative anomalies ex-tend to southern middle-latitude stratosphere. Also note that during the QBO east phase El Ni˜no Modoki causes positive
zonal wind anomalies in the northern high-latitude strato-sphere (stronger Arctic polar vortex).
The modeling results here suggest that the east phase QBO has an important influence, not only on the El Ni˜no Modoki signal in Southern Hemisphere stratosphere, but also on the El Ni˜no Modoki signal in Northern Hemisphere stratosphere. The composite analysis based on our model simulations in-dicate that the canonical El Ni˜no anomalies are not sensitive to QBO and El Nino Modoki anomalies are also not sensitive to the west phase QBO, but El Nino Modoki is sensitive to the east phase QBO. However, the modeling results in pre-vious studies illustrated that the El Nino Modoki signal in the stratosphere is not sensitive to QBO phases (Hurwitz et al,. 2011b; Zubiaurre and Calvo, 2012; Sassi et al., 2004). This discrepancy is possibly due to that the different models from WACCM4 were used in those previous studies. Partic-ularly noticeable in Fig. 8 is that the El Ni˜no Modoki has a reverse effect on the high-latitude stratosphere compared with canonical El Ni˜no and this reverse effect should be re-lated to the interaction between the east phase QBO and El Ni˜no Modoki signal in the stratosphere.
To further examine whether the stratospheric El Ni˜no anomalies are different with and without the QBO in the model, the other three experiments (R4, R5, and R6) are per-formed to investigate the circulation anomalies in the strato-sphere during two kinds of El Ni˜no events in the absence of
(a)
-90 -60 -30 0 30 60 90
100 70 50 10
Pressure (hPa)
(b)
-90 -60 -30 0 30 60 90
100 70 50 10
(c)
-90 -60 -30 0 30 60 90
Latitude 100
70 50 10
Pressure (hPa)
(d)
-90 -60 -30 0 30 60 90
Latitude 100
70 50 10
WACCM4 Ua WQBO, CT WACCM4 Ua EQBO, CT
WACCM4 Ua WQBO, WP WACCM4 Ua EQBO, WP
Fig. 10.Differences of the zonal wind for R2–R1 when QBO in(a)west phase and(b)east phase. The contour interval for zonal wind anomalies is±0.25 m s−1. Solid and dashed lines represent positive and negative anomalies, respectively. Anomalies that are significant at the 90 % confidence level according to Student’s t-test are shaded.(c)and(d)are same as(a)and(b), but for R3–R1.
QBO. The experiments R4, R5 and R6 have the same figu-ration as the experiment R1, R2 and R3, respectively, except that the experiments R4, R5, and R6 are run without impose a QBO forcing in the model. Figure 11a and b show mod-eled zonal wind anomalies, forced with observed SSTAs in the typical El Ni˜no and El Ni˜no Modoki events but without a QBO forcing in the model. Compared with Fig. 10, Fig. 11 illustrates that the effects of canonical El Ni˜no activities on middle-high latitudes stratosphere in the absence of QBO are similar with the effects when there is a QBO forcing in the model (Figs. 10a, b and 11a). The simulations R4, R5 and R6 also confirm the result in Garfinkel and Hartmann (2007) that the warm phase ENSO has a significant effect on the polar vortex. However, the simulated zonal wind anomalies forced by El Ni˜no Modoki SSTA are similar to the simulated results forced by typical El Ni˜no SSTA when the QBO forcing is excluded in the model (Fig. 11a and b). This result suggests that the model cannot accurately reproduce the effects of El Ni˜no Modoki activities on the wave propagation in the either hemisphere stratosphere when a QBO forcing is not imposed in the model. And it also suggests typical El Ni˜no and El Ni˜no Modoki activities actually have the same influences on mid-high latitudes stratosphere when without the disturbance of the QBO signal on the ENSO signal.
It is interesting to note that, if QBO signals are filtered out of the composite zonal wind anomaly data obtained from the ERA-Interim time series dataset using the 24–40 months
band-pass filter (as in Pascoe et al., 2005), the resulting zonal wind anomalies are virtually identical to those obtained for canonical El Ni˜no periods using the WACCM4 forced by ob-served SSTA but in the absence of QBO (Fig. 11a and c). However, the zonal wind anomalies obtained from filtered ERA-Interim time series data for El Ni˜no Modoki periods are unlike the anomalies obtained using the WACCM4 forced by observed SSTA but in the absence of QBO (Fig. 11b and d), they are still associated with the zonal wind anomalies ob-tained from the original ERA-Interim time series dataset for the high-latitude stratosphere (Fig. 8b and 11d), only the de-gree of anomalies become weaker. The present results reveal that anomalies in stratospheric zonal wind during El Ni˜no Modoki periods are not a simply linear overlay of the QBO and ENSO signals; there is a complicated interaction be-tween the QBO signal and El Ni˜no Modoki signal. The inter-action affects the tropospheric zonal wind anomalies which changes the planetary wave activity in the stratosphere. This has been investigated in Fig. 9.
5 Summary and conclusions
We investigated and compared the potential effects of the two types of El Ni˜no events (canonical El Ni˜no and El Ni˜no Modoki) on the TTL and stratosphere, using composite anal-yses of ERA-Interim reanalysis data, based on the N3I and
(a)
-90 -60 -30 0 30 60 90
100 70 50 10
Pressure (hPa)
(b)
-90 -60 -30 0 30 60 90
100 70 50 10
(c)
-90 -60 -30 0 30 60 90
Latitude 100
70 50 10
Pressure (hPa)
(d)
-90 -60 -30 0 30 60 90
Latitude 100
70 50 10
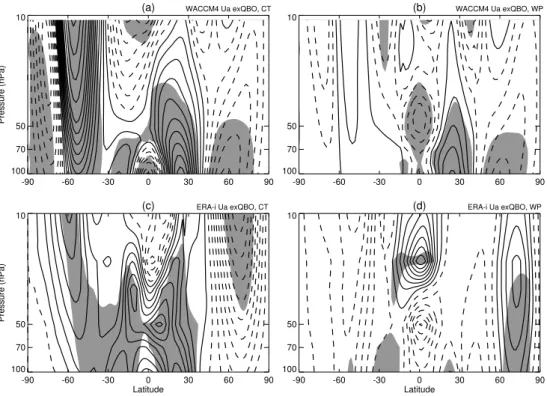
WACCM4 Ua exQBO, CT WACCM4 Ua exQBO, WP
ERA-i Ua exQBO, CT ERA-i Ua exQBO, WP
Fig. 11.Differences of the zonal wind for(a)R5–R4 and(b)R6–R4. Composite anomalies of zonal wind for(c)canonical El Ni˜no events and(d)El Ni˜no Modoki events, obtained using ERA-Interim data that filtered QBO (see text for details). The contour interval for zonal wind anomalies is±0.25 m s−1. Solid and dashed lines represent positive and negative anomalies, respectively. Anomalies that are significant at the 90 % confidence level according to Student’s t-test are shaded.
the EMI. As was found in earlier studies, the present results show that canonical El Ni˜no events tend to enhance tion in the middle and eastern Pacific and weaken convec-tion over the western Pacific. El Ni˜no Modoki events, on the other hand, depress convection in the western and eastern cific and intensify convection in the central and northern Pa-cific; this leads to negative anomalies of upper tropospheric water vapor in the western and eastern Pacific but positive anomalies in the central and northern Pacific. These pat-terns of OLR and upper tropospheric water vapor anomalies caused by El Ni˜no Modoki events correspond with a tripo-lar form. In addition, the positive and negative convection anomalies associated with El Ni˜no Modoki events in the mid-dle and western Pacific, respectively, are smaller than those associated with canonical El Ni˜no events. An EOF analysis of the OLR and upper tropospheric water vapor anomalies demonstrates that the leading mode is a result of canonical El Ni˜no events, and that the second mode is a result of El Ni˜no Modoki events. El Ni˜no activities lead to similar pat-terns of tropopause temperature and water vapor anomalies as those of canonical El Ni˜no activities, although the El Ni˜no Modoki anomalies are smaller than those of canonical El Ni˜no events. The above results are also supported by general climate model simulations.
We also found that the two types of El Ni˜no activities have significantly different effects on the stratosphere. This is
be-cause the interaction between QBO signal and two types of El Ni˜no signal. The effects of the QBO signal mainly changes the degree of anomalies caused by canonical El Ni˜no on the stratosphere, whereas there is a complex interaction between the QBO signal and El Ni˜no Modoki signal. Because of this interaction, El Ni˜no Modoki events have a reverse effect on stratospheric circulation at high latitudes, as compared with that of canonical El Ni˜no events. During El Ni˜no Modoki events, the northern polar vortex is stronger and colder but the southern polar vortex is weaker and warmer. Accord-ing to the simulation’ results, we found that the reverse ef-fect on high latitudes stratosphere as a result of a compli-cated interaction between east phase QBO signal and El Ni˜no Modoki signal. This interaction is not a simply linear over-lay of east phase QBO signal and El Ni˜no Modoki in the stratosphere, it is because El Ni˜no Modoki with QBO forcing leads to different tropospheric zonal wind anomalies from those caused by typical El Ni˜no, thus, the planetary wave propagation from troposphere to the stratosphere is differ-ent during El Ni˜no Modoki evdiffer-ents from that during canon-ical El Ni˜no events. However, when QBO in west phase, El Ni˜no Modoki events have a same effect on the high lat-itudes stratosphere, as compared with the effect of typical El Ni˜no events. Furthermore, the simulations suggest that canonical El Ni˜no and El Ni˜no Modoki activities actually have the same influence on high latitudes stratosphere, in the
absence of QBO forcing. Finally, the present results suggest that canonical El Ni˜no events have a more significant im-pact on the high-latitude Northern Hemisphere stratosphere than on the high-latitude Southern Hemisphere stratosphere. However, El Ni˜no Modoki events more profoundly influence the high-latitude Southern Hemisphere stratosphere than they do the high-latitude Northern Hemisphere stratosphere.
Acknowledgements. This work was jointly supported by the 973 Program (2010CB950400), 973 Program (2010CB428604), the National Natural Science Foundation of China (41030961), and Postdoctoral Science Foundation (2012M510525). We thank ECMWF for meteorological data and NOAA for OLR and ONI data. The WACCM4 model is provided by NCAR.
Edited by: Q. Fu
References
Ashok, K. and Yamagata, T.: The El Ni˜no with a difference, Nature, 461, 481–484, 2009.
Ashok, K., Behera, S., Rao, S., Weng, H., and Yamagata, T.: El Ni˜no Modoki and its teleconnection, J. Geophys. Res., 112, C11007, doi:10.1029/2006JC003798, 2007.
Andrews, D. G., Holton, J. R., and Leovy, C. B.: Middle Atmo-sphere Dynamics, Academic Press Inc., 489 pp., 1987.
Brewer, A. W.: Evidence for a world circulation provided by the measurements of helium and water vapour distribution in the stratosphere, Q. J. Roy. Meteor. Soc., 75, 351–363, doi:10.1002/qj.49707532603, 1949.
Cagnazzo, C., Manzini, E., Calvo, N., Douglass, A., Akiyoshi, H., Bekki, S., Chipperfield, M., Dameris, M., Deushi, M., Fis-cher, A. M., Garny, H., Gettelman, A., Giorgetta, M. A., Plum-mer, D., Rozanov, E., Shepherd, T. G., Shibata, K., Stenke, A., Struthers, H., and Tian, W.: Northern winter stratospheric tem-perature and ozone responses to ENSO inferred from an ensem-ble of Chemistry Climate Models, Atmos. Chem. Phys., 9, 8935– 8948, doi:10.5194/acp-9-8935-2009, 2009.
Cai, W. J. and Cowan, T.: La Ni˜na Modoki impacts Australia autumn rainfall variability, Geophys. Res. Lett., 36, L12805, doi:10.1029/2009GL037885, 2009.
Calvo, N., Garcia, R., Garcia Herrera, R., Gallego, D., Gimeno, L., Hern´andez, E., and Ribera, P.: Analysis of the ENSO signal in tropospheric and stratospheric temperatures observed by MSU, 1979–2000, J. Climate, 17, 3934–3946, 2004.
Camp, C. D. and Tung, K.-K.: Stratospheric polar warming by ENSO in winter: A statistical study, Geophys. Res. Lett., 34, L04809, doi:10.1029/2006GL028521, 2007.
Chandra, S., Ziemke, J. R., Min, W., and Read, W. G.: Effects of 1997–1998 El Ni˜no on tropospheric ozone and water vapor, Geo-phys. Res. Lett., 25, 3867–3870, 1998.
Deser, C., and Wallace, J. M.: Large-scale atmospheric circulation features associated with warm and cold episodes in thetropical Pacific, J. Climate, 3, 1254–1281, 1990.
Eliassen, A. and Palm, E.: On the transfer of energy in stationary mountain waves, Geofys. Publ., 22, 1–23, 1961.
Feng, J. and Li, J.: Influence of El Ni˜no Modoki on spring rainfall over south China, J. Geophys. Res., 116, D13102, doi:10.1029/2010JD015160, 2011.
Free, M. and Seidel, D. J.: The observed ENSO tem-perature signal in the stratosphere, J. Geophys. Res., doi:10.1029/2009JD012420, 2009.
Garcia, R. R., Marsh, D. R., Kinnison, D. E., Boville, B. A., and Sassi, F.: Simulation of secular trends in the mid-dle atmosphere, 1950–2003, J. Geophys. Res., 112, D09301, doi:10.1029/2006JD007485, 2007.
Garc´ıa-Herrera, R., Calvo, N., Garcia, R. R., and Giorgetta, M. A.: Propagation of ENSO temperature signals into the middle atmosphere: A comparison of two general circulation models and ERA-40 reanalysis data, J. Geophys. Res., 111, D06101, doi:10.1029/2005JD006061, 2006.
Garfinkel, C. I. and Hartmann, D. L.: Effects of El Nino – South-ern Oscillation and the Quasi-Biennial Oscillation on polar tem-peratures in the stratosphere, J. Geophys. Res., 112, D19112, doi:10.1029/2007JD008481, 2007.
Garfinkel, C. I. and Hartmann, D. L.: Different ENSO teleconnec-tions and their effects on the stratospheric polarvortex, J. Geo-phys. Res., 113, D18114, doi:10.1029/2008JD009920, 2008. Garfinkel, C. I. and Hartmann, D. L.: Influence of the quasi-biennial
oscillation on the North Pacific and El Ni˜no teleconnections, J. Geophys. Res., 115, D20116, doi:10.1029/2010JD014181, 2010. Gettelman, A., Randel, W. J., Massie, S., and Wu, F.: El Ni˜no as a Natural Experiment for Studying the Tropical Tropopause Re-gion, J. Climate, 14, 3375–3392, 2001.
Hamilton, K.: An examination of observed Southern Oscillation ef-fects in the Northern Hemisphere stratosphere, J. Atmos. Sci., 50, 3468–3473, 1993.
Hitoshi, M. and Hirooka, T.: Predictability of stratospheric sudden warming: A case study for 1998/99 winter, Mon. Weather Rev., 132, 1764–1776, 2004.
Holton, J. R., Haynes, P. H., Douglass, A. R., Rood, R. B., and Pfis-ter, L.: Stratosphere-troposphere exchange, Rev. Geophys., 33, 403–439, 1995.
Hu, Y. and Fu, Q.: Stratospheric warming in Southern Hemisphere high latitudes since 1979, Atmos. Chem. Phys., 9, 4329–4340, doi:10.5194/acp-9-4329-2009, 2009.
Hu, Y. and Pan, L.: Arctic stratospheric winter warming forced by observed SSTs, Geophys. Res. Lett., 36, L11707, doi:10.1029/2009GL037832, 2009.
Hu, Y. and Tung, K. K.: Interannual and decadal variations of plane-tary wave activity stratospheric cooling and northern hemisphere annular mode, J. Climate, 15, 1659–1673, 2002.
Hurwitz, M. M., Newman, P. A., Oman, L. D., and Molod, A. M.: Response of the Antarctic Stratosphere to Two Types of El Ni˜no Events, J. Atmos. Sci., 68, 812–822, doi:10.1175/2011JAS3606.1, 2011a.
Hurwitz, M. M., Song, I.-S., Oman, L. D., Newman, P. A., Molod, A. M., Frith, S. M., and Nielsen, J. E.: Response of the Antarctic stratosphere to warm pool El Ni˜no Events in the GEOS CCM, Atmos. Chem. Phys., 11, 9659–9669, doi:10.5194/acp-11-9659-2011, 2011b.
Kao, H. and Yu, J.: Contrasting Eastern-Pacific and Central-Pacific Types of ENSO, J. Climate, 22, 615–632, doi:10.1175/2008JCLI2309.1, 2009.
Kiladis, G. N., Straub, K. H., Reid, G. C., and Gage, K. S.: Aspects of interannual and intraseasonal variability of the tropopause and lower stratosphere, Q. J. Roy. Meteor. Soc., 127, 1961–1983, doi:10.1002/qj.49712757606, 2001.
Lin, P., Fu, Q., and Hartmann, D.: Impact of tropical SST on strato-spheric planetary waves in the Southern Hemisphere, J. Climate, doi:10.1175/JCLI-D-11-00378.1, in press, 2012.
Manzini, E., Giorgetta, M. A., Esch, M., Kornblueh, L., and Roeck-ner, E.: The Influence of Sea Surface Temperatures on the Northern Winter Stratosphere: Ensemble Simulations with the MAECHAM5 Model, J. Climate, 19, 3863–3881, 2006. McCormack, J. P., Fu, R., and Read, W. G.: The influence of
con-vective outflow on water vapor mixing ratios in the tropical upper troposphere: An analysis based on UARS MLS measurements, Geophys. Res. Lett., 27, 525–528, 2000.
Newell, R. E. and Gould-Stewart, S.: A stratospheric fountain?, J. Atmos. Sci., 38, 2789–2796, 1981.
Newell, R. E., Zhu, Y., Browell, E. V., Read, W. G., and Waters, J. W.: Walker circulation and tropical upper tropospheric water vapor, J. Geophys. Res., 101, 1961–1974, 1996.
Philander, S. G.: El Ni˜no, La Ni˜na and the Southern Oscillation, Academic Press, 293 pp., 1990.
Pascoe, C. L., Gray, L. J., Crooks, S. A., Juckes, M. N., and Baldwin, M. P.: The quasi-biennial oscillation: Anal-ysis using ERA-40 data, J. Geophys. Res., 110, D08105, doi:10.1029/2004JD004941, 2005.
Randel, W. J.: Study of planetary waves in the southern winter Tro-posphere and Stratosphere. Part I: wave structure and vertical propagation, J. Atmos. Sci., 44, 917–935, 1987.
Randel, W. J., Wu, F., and Gaffen, D. J.: Interannual variability of the tropicsal tropopause derived from radiosonde data and NCEP reanalysis, J. Geophys. Res., 105, 509–523, 2000.
Rasmusson, E. M. and Carpenter, T. H.: Variations in tropical sea surface temperature and surface wind fields associated with the Southern Oscillation/El Ni˜no, Mon. Weather Rev., 110, 354–384, doi:10.1175/1520-0493(1982)110<0354:VITSST>2.0.CO;2, 1982.
Rayner, N. A., Brohan, P., Parker, D. E., Folland, C. K., Kennedy, J. J., Vanicek, M., Ansell, T., and Tett, S. F. B.: Improved analyses of changes and uncertainties in sea surface temperature measured in situ since the mid-nineteenth century: the HadSST2 data set, J. Climate., 19, 446–469, 2006.
Reid, G. C. and Gage, K. S.: Interannual variations in the height of the tropical tropopause, J. Geophys. Res., 90, 5629–5635, 1985. Reid, G. C., Gage, K. S., and McAfee, J. R.: The thermal response of the tropical atmosphere to variations in equatorial Pacific sea surface temperature, J. Geophys. Res., 94, 705–716, 1989. Sassi, F., Kinnison, D., Boville, B. A., Garcia, R. R., and Roble, R.:
Effect of El Ni˜no-Southern Oscillation on the dynamical, ther-mal, and chemical structure of the middle atmosphere, J. Geo-phys. Res., 109, D17108, doi:10.1029/2003JD004434, 2004. Scaife, A. A., Butchart, N., Jackson, D. R., and Swinbank,
R.: Can changes in ENSO activity help to explain increas-ing stratospheric water vapor?, Geophys. Res. Lett., 30, 1880, doi:10.1029/2003GL017591, 2003.
Simmons, A., Uppala, S., Dee, D., and Kobayashi, S.: ERA-Interim: New ECMWF reanalysis products from 1989 onwards, ECMWF Newsletter, 110, 25–25, 2007a.
Simmons, A., Uppala, S., and Dee, D.: Update on ERAInterim, ECMWF Newsletter, 111, p. 5, 2007b.
SPARC: SPARC Assessment of water vapor in the upper tropo-sphere and lower stratotropo-sphere, Stratospheric Processes and Their Role in Climate, WMO/TD-1043, 312 pp., 2000.
Taguchi, M. and Hartmann, D. L.: Increased occurrence of strato-spheric sudden warmings during El Nino as simulated by WACCM, J. Climate, 19, 324–332, 2006.
Taschetto, A. S. and England, M. H.: El Ni˜no Modoki im-pacts on Australian rainfall, J. Climate, 22, 3167–3174, doi:10.1175/2008JCLI2589.1, 2009.
Trenberth, K. E.: The definition of El Ni˜no, B. Am. Meteorol. Soc., 78, 2771–2777, doi:10.1175/1520-0477(1997)078<2771:TDOENO>2.0.CO;2, 1997.
Trenberth, K. E. and Smith, L.: The vertical structure of temperature in the tropics: Different flavors of El Ni˜no, J. Climate, 19, 4956– 4970, 2006.
Trenberth, K. E. and Smith, L.: Variations in the three-dimensional structure of the atmospheric circulation with different flavors of El Ni˜no, J. Climate, 22, 2978–2991, 2009.
Trenberth, K. E. and Stepaniak, D. P.: Indices of El Ni˜no evolution, J. Climate, 14, 1697–1701, 2001.
Uppala, S., Dee, D., Kobayashi, S., Berrisford, P., and Simmons, A.: Towards a climate data assimilation system: status update of ERA-Interim, ECMWF Newsletter, 115, 12–18, 2008.
Van Loon, H. and Labitzke, K.: The Southern Oscillation. Part V: The anomalies in the lower stratosphere of the Northern Hemi-sphere in winter and a comparison with the quasi-biennial oscil-lation, Mon. Weather Rev., 115, 357–369, 1987.
Weng, H. Y., Karumuri, A., Swadhin, K. B., Suryachandra, A. R., and Toshio, Y.: Impacts of recent El Ni˜no Modoki on dry/wet conditions in the Pacific rim during boreal summer, Clim. Dy-nam., 29, 113–129, doi:10.1007/s00382-007-0234-0, 2007. Weng, H. Y., Behera, S. K., and Yamagata, T.: Anomalous
win-ter climate conditions in the Pacific rim during recent El Ni˜no Modoki and El Ni˜no events, Clim. Dynam., 32, 663–674, doi:10.1007/s00382-008-0394-6, 2009.
World Meteorological Organization (WMO): Scientific Assessment of Ozone Depletion: 2002, WMO Global Ozone Research and Monitoring Project-Report Np., 47, Geneva, Switzeland, 2003. Xie, F., Tian, W., Austin, J., Li, J., Tian, H., Shu, J., and
Chen, C.: The effect of ENSO activity on lower stratospheric water vapor, Atmos. Chem. Phys. Discuss., 11, 4141–4166, doi:10.5194/acpd-11-4141-2011, 2011.
Yeh, S., Kug, J., Dewitte, B., Kwon, M., Kirtman, B., and Jin, F.: El Ni˜no in a changing climate, Nature, 461, 511–514, 2009. Yu, J. and Kao, H.: Decadal changes of ENSO persistence barrier
in SST and ocean heat content indices: 1958–2001, J. Geophys. Res., 112, D13106, doi:10.1029/2006JD007654, 2007.
Yu, J., Kao, H., and Lee, T.: Subtropics-Related Interannual Sea Surface Temperature Variability in the Central Equatorial Pacific, J. Climate., 23, 2869–2884, doi:10.1175/2010JCLI3171.1, 2010. Yulaeva, E., Holton, J. R., and Wallace, J. M.: On the cause of the annual cycle in the tropical lower stratospheric temperature, J. Atmos. Sci., 51, 169–174, 1994.
Zhang, W. J., Li, J. P., and Jin, F. F.: Spatial and temporal features of ENSO meridional scales, Geophys. Res. Lett., 36, L15605, doi:10.1029/2009GL038672, 2009.
Zhang, W. J., Li, J. P., and Zhao, X.: Sea surface temperature cool-ing mode in the Pacific cold tongue, J. Geophys. Res., 115, C12042, doi:10.1029/2010JC006501, 2010.
Zhou, T. J. and Zhang, J.: The Vertical Structures of Atmospheric Temperature Anomalies Associated with Two Flavors of El Nino Simulated by AMIP II Models, J. Climate, 24, 1053–1070, doi:10.1175/2010JCLI3504.1, 2010.
Zubiaurre, I. and Calvo, N.: The El Ni˜no–Southern Oscillation (ENSO) Modoki signal in the stratosphere, J. Geophys. Res., 117, D04104, doi:10.1029/2011JD016690, 2012.