International Journal of
Health Policy and Management
Journal homepage: http://ijhpm.com Kerman University
of Medical Sciences
Original Article
Inluence of Pattern of Missing Data on Performance of Imputation
Methods: An Example Using National Data on Drug Injection in Prisons
Saiedeh Haji-Maghsoudi1, Ali-akbar Haghdoost1, Azam Rastegari2, Mohammad Reza Baneshi3*1Regional Knowledge Hub for HIV/AIDS Surveillance, Institute for Futures Studies in Health, Kerman University of Medical Sciences, Kerman, Iran 2Social Determinant of Health Research Center, Institute for Futures Studies in Health, Kerman University of Medical Sciences, Kerman, Iran 3Research Center for Modeling in Health, Institute for Futures Studies in Health, Kerman University of Medical Sciences, Kerman, Iran
Background: Policy makers need models to be able to detect groups at high risk of HIV infection. Incomplete records and dirty data are frequently seen in national data sets. Presence of missing data challenges the practice of model development. Several studies suggested that performance of imputation methods is acceptable when missing rate is moderate. One of the issues which was of less concern, to be addressed here, is the role of the pattern of missing data.
Methods: We used information of 2720 prisoners. Results derived from fitting regression model to whole data were served as gold standard. Missing data were then generated so that 10%, 20% and 50% of data were lost. In scenario 1, we generated missing values, at above rates, in one variable which was significant in gold model (age). In scenario 2, a small proportion of each of independent variable was dropped out. Four imputation methods, under different Event Per Variable (EPV) values, were compared in terms of selection of important variables and parameter estimation. Results: In scenario 2, bias in estimates was low and performances of all methods for handing missing data were similar. All methods at all missing rates were able to detect significance of age. In scenario 1, biases in estimations were increased, in particular at 50% missing rate. Here at EPVs of 10 and 5, imputation methods failed to capture effect of age.
Conclusion: In scenario 2, all imputation methods at all missing rates, were able to detect age as being significant. This was not the case in scenario 1. Our results showed that performance of imputation methods depends on the pattern of missing data.
A B S T R A C T A R T I C L E I N F O
Keywords:
Missing Data MICE
Expectation Maximum Algorithm Drug Injection
National Data
Article History:
Received: 1 May 2013 Accepted: 30 May 2013 ePublished: 3 June 2013
*Corresponding author: Mohammad Reza Baneshi; Email: [email protected]
Background
Iran is classified as a country with concentrated epidemic (HIV prevalence more than 5% in injection drug users (IDUs) (1). Prison is a place with a dynamic population and therefore is an ideal ground for transmission of HIV infection. It has been shown that HIV prevalence is about 10 times higher than that of the general population. Many of those in prison are because of drug injection. Such people usually find ways to continue their behaviour and this hugely speeds up HIV transmission (2).
What would be of interest is to identify risk factors associated with drug injection in prison. Development of such prediction models is of interest in policy decision making. To be able to implement appropriate prevention policies, policy makers need to know which factors govern this outcome.
National data are available to develop prediction models. However, in particular in developing countries, such data include lots of missing values, and majority of forms are not
filled accurately (3,4). This challenges model fitting.
In this paper we concentrate of impact of mission data on decision making, rather than on social aspects of drug injection in prison. The method usually applied to deal with this problem is to only analyse subjects with available data on all variables (known as Complete-Case (C-C) analysis) (5,6). However, this method leads to bias in estimation of parameters, increases the width of Confidence Intervals (CI), and reduces the power of the study (7-9).
The art of imputation methods is to recover the data so as to improve the power and efficacy of analysis. Such methods use the observed part of data, and try to guess the best values for incomplete records.
An ad hoc method, known as median substitution, replaces missing observations with median of the observed values. Although this approach is simple, but it is argued that median of observed values might not necessarily be the best guess for incomplete data (10-13).
On the other hand likelihood-based approaches to
70
impute missing data are available. Among them, Multiple Imputation via Chained Equations (MICE) is established as the standard tool (14,15). In MICE, each missing datum is replaced multiple times, therefore creating more than one (typically 10) data sets. This is one of the main advantages of the MICE that it takes into account imputation uncertainty. However, communication of results needs deep statistical skills (16-20).
Besides MICE, there are easier likelihood based methods such as regression imputation and Expectation Maximum (EM) algorithm. In regression approach, each variable with missing data, in turn, is used as dependent variable and linked to the rest of variables. Missing data are then replaced from regression equations derived (21).
EM algorithm is an extension of regression method. Here parameters of regression equation are used to impute missing values (Expectation step). Then using complete data and those imputed, new regression parameters are estimated (Maximisation step). Using new regression parameters missing data would be re-estimated. The whole process continues until model reaches convergence in terms of regression parameters (21-23).
As median substitution, regression, and EM algorithm imputes missing data only once, through this manuscript we name them single imputation approaches (23-26). MICE is referred to as multiple imputation method, as it replaces each missing value with multiple plausible values (15).
Several studies showed that, when missing rate is low or moderate performance of single imputation and multiple imputation methods are fairly the same (27,28). Under low or moderate missing rates, they are all able to recover the data and to provide unbiased estimates. However, performance of imputation methods is poor when missing rate is high. To make such conclusion, several factors influence performance of imputation methods (such as missing rate, mechanism of generation of missing data, number of independent variables, etc.) have been taken into account. We have to notify what we mean by missing rate is proportion of data missed in multifactorial modeling.
We strongly believe that one of the issues which was of less concern in the literature is the distribution of missing data. To clarify this issue, consider a scenario to detect independent variables influence an outcome under two scenarios. In the first scenario only one independent variable includes 50% missing rate. In the second scenario each of independent variables include only a small missing rate (say 3%), but subjects with missing data on the first variable have available data on rest of variables, subjects with missing data on the second variable have available data on first and rest of variables, and so on.
In both scenarios, we miss 50% of data in the C-C multifactorial model. However, in the first scenario imputation model imputes large proportion of data for a single variable, while in the second scenario it imputes small proportion of data for multiple independent variables.
Many studies about optimum method for dealing missing data have published. But the majority of these simulation studies have generated missing data in one variable. In this study, to address impact of missing distribution, we generate missing by two approaches (explained above). Methods applied using a data set from national HIV Bio-Behavioral
Surveillance Survey (BBSS) among prisoners, as an example. In particular we focus on ‘age’ as one of the most important factors that influence drug injection in prison (29).
Methods
Information of national HIV BBSS among prisoners in 2009 was used. The dependent variable was history of drug injection (yes/no question). Independent variables were age in years; history of imprisonment (in months); the onset of drug use; the main cause of recent incarceration including drug smuggling, murder, rape/sexual assault, violence/ aggregation, theft, smuggling of illegal goods and financial crimes (all yes/no questions); dominant drug used in last month before recent imprisonment (grass, ecstasy, opium, heroin-crack, crystal, methadone, and alcohol (all yes/no questions); education; job; marital status; and knowledge about AIDS.
This national data bank includes information of 5375 prisoners. However, information of majority of above mentioned variables were not available for a considerable number of prisoners. Information of dependent and all independent variables were available for 2720 subjects. Among them 618 prisoners had a history of drug injection. These 2720 subjects formed our final sample size.
Using all 2720 subjects a regression model with Backward Elimination (BE) variable selection was fitted to identify variables which influenced the outcome (drug injection). Then missing data was generated at 10%, 20%, and 50%. It has been suggested that including enough number of independent variables, say more than 15, makes the MAR (missing at random) assumption plausible. This assumption indicates that missingness for each variable is related to other independent variables (30). Generation of missing data was performed under two scenarios. In scenario 1, missing data was generated randomly on one single variable which was significantly associated with the outcome of study (age). In scenario 2, a small proportion of each independent variable was randomly dropped out. In this situation missing rates on each variable and proportion of data missed for the multifactorial model were (0.5%, 10%), (1%, 20%) and (3%, 50%) respectively.
On the other hand, the Event Per Variable rule (EPV) suggest that regression models provides stable results when EPV is as least 10. Here, the EPV was 25. To address the impact of EPV, sample size of 2352 (EPV= 10) and 2227 (EPV= 5) selected randomly from the data set. The whole process was then applied to data sets selected as well.
In all six scenarios (3 different EPVs, and 2 missing generation scenarios) missing values were estimated with the regression imputation, EM algorithm, and MICE methods. In addition, missing data were replaced by median of observed values. Therefore, in total 24 scenarios were compared. Data sets obtained were analysis and results compared with data involved no missing value (served as the gold model).
Under each scenario, multifactorial logistic regression model in conjunction with BE variable selection method has been applied, to identify significant variables.
71
described above was considered as bias. Also AIC (Akaike’s Information Criterion) of these models were compared. The EM and regression imputation were done using SPSS 16 (SPSS Inc., Chicago, IL, USA) and other analysis were done using STATA (StataCorp LP, Texas, USA) and R software.
Results
To check the MAR assumption, for each variable in turn, we investigated whether missingness was predictable by other independent variables (data not shown). We created indicator variables and fitted a series of logistic regression models. Our exploration confirms that the data satisfied the MAR assumption.
Results at EPV of 25
Scenario 1 (generation of missing data on one single variable (age))
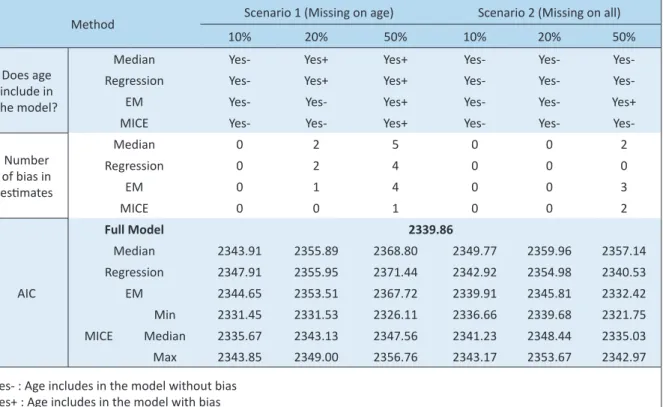
At EPV of 25, in the gold model, eight variables were remained significant in the model. At 10% missing rate, the results of all methods were similar to gold model with no bias estimate. At 20% missing rate, results of all models were the same as gold, in terms of variables retained in the model. However, median and regression methods predicted the effect of age variable in a biased way. In total, median substitution, regression, and EM estimated two, two, and one biased regression parameters respectively.
But with increasing the missing rate to 50%, MI (Multiple Imputation) was the only method that led to results comparable to the gold model. All other three methods lost significance of one variable (Table 1). In addition, MI produced least number of biased estimates.
Another finding was that at all missing rates models were able to select the age variable as being significant. However, at 50% missing rate, estimates derived were biased in all
four imputation methods.
In terms of AIC, the MI method resulted to estimates very closed to the gold model.
Scenario 2 (generation of missing data on all variables) At 10 and 20% missing rates, in terms of variables retained in the final model, results were similar to that of gold model (Table 1). In addition, none of estimates (i.e. regression coefficients and Standard Errors (SE)) were biased. At 50% missing rate, all methods but not regression had selected one wrong variable as being significant. Median substitution and MI methods suffered bias estimation of one variable. Corresponding figure for regression and EM was zero and two respectively. Even at 50% missing rate, all imputation methods captured significance of age. Furthermore, in terms of AIC, in all missing rates, results of MI and EM were closer to the gold model than that of median substitution.
Results at EPV of 10
Scenario 1 (generation of missing data on one single variable (age))
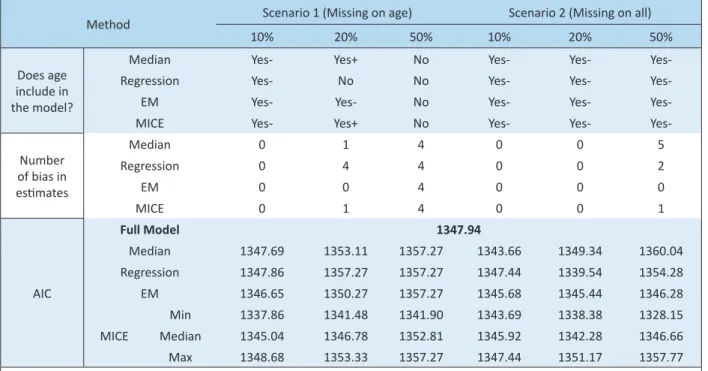
When EPV was 10, seven variables were significant in the gold model (Table 2). At 10% missing rate, results of all methods were similar to gold model (in terms of selection of variables and estimation of unbiased parameters). At 20% missing rate, performance of all methods but not regression were acceptable in terms of variable selection. All methods, but not regression, were able to identify the age variable as a significant predictor. However, estimation was biased under two imputation models (median substitution and MI).
At 50% missing rate, all models were able to capture significance of all variables retained in the gold model except age. In addition, all methods had bias in estimation of three parameters (Table 2).
Table 1. Performance of imputation models at EPV of 25, under different missing rates and scenarios
Method Scenario 1 (Missing on age) Scenario 2 (Missing on all)
10% 20% 50% 10% 20% 50%
Does age include in the model?
Median Yes- Yes+ Yes+ Yes- Yes-
Yes-Regression Yes- Yes+ Yes+ Yes- Yes-
Yes-EM Yes- Yes- Yes+ Yes- Yes- Yes+
MICE Yes- Yes- Yes+ Yes- Yes-
Yes-Number of bias in esimates
Median 0 2 5 0 0 2
Regression 0 2 4 0 0 0
EM 0 1 4 0 0 3
MICE 0 0 1 0 0 2
AIC
Full Model 2339.86
Median 2343.91 2355.89 2368.80 2349.77 2359.96 2357.14
Regression 2347.91 2355.95 2371.44 2342.92 2354.98 2340.53
EM 2344.65 2353.51 2367.72 2339.91 2345.81 2332.42
Min 2331.45 2331.53 2326.11 2336.66 2339.68 2321.75
MICE Median 2335.67 2343.13 2347.56 2341.23 2348.44 2335.03
Max 2343.85 2349.00 2356.76 2343.17 2353.67 2342.97
72
Comparing AICs, we have seen that increase in missing rate has been associated with poorer estimation of AIC with respect to the gold method. This was the case in particular in median substitution method.
Scenario 2 (generation of missing data on all variables) At 10% missing rate, results of variable selection in all methods were similar to gold model (Table 2). In addition no bias in estimation was seen. At 50% missing rate, only median substitution showed a poor performance where two wrong variables (and inevitably with biased parameter estimates) were selected as being significant. Surprisingly, at 20% missing rate, again results of all four models were the same as gold model. All methods detected age as being significant. Coefficient of one variable was estimated in a bias way, under median substitution and MI but not EM. Regression imputation produced two biased estimates.
In terms of AIC, result of median and regression imputation methods were not satisfying at 50% missing rate. While the real AIC was 1347.94, figure estimated under these two methods were 1360.04 and 1354.28 respectively. Estimates from other methods were around 1346.
Results at EPV of 5
Scenario 1 (generation of missing data on one single variable (age))
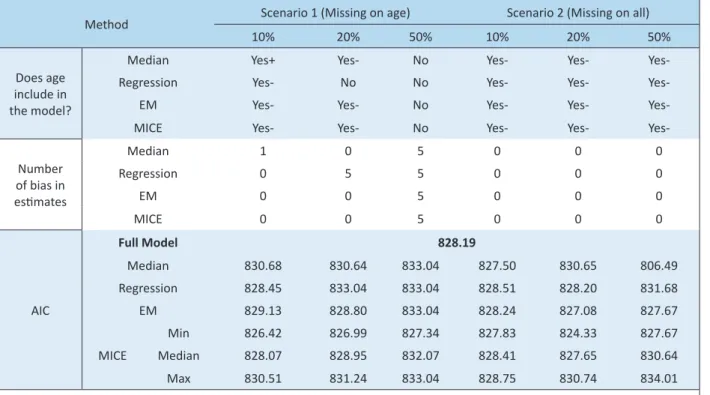
At this EPV, five variables were retained in the gold model. At 10% missing rate, the results of variable selection in all models were the same as gold model. However, median substitution was the only method which estimated coefficient of age in a biased way. At 20% missing rate, regression imputation was not able to capture significance of age, but other three models were the same as gold model, with no bias in parameter estimation (Table 3).
At 50% missing rate, all methods lost significance of age variable. In all methods, estimation of regression coefficients for four variables was biased.
Scenario 2 (generation of missing data on all variables) Interestingly, at all missing rates, all methods were similar to the gold model. In addition, no bias in estimation of parameters has been seen (Table 3). Age remained significant in all settings. Estimation of AICs was fairly close to that of gold model. But at missing rate of 50%, AICs of median and regression models was far from the gold model. Regression coefficients and their SEs corresponded to all models are provided in Tables 4 to 6.
Discussion
In general, we have seen that increase in the missing rate was associated with increase in the number of biases in estimates of model parameters. We also saw that when the rate of missing increases, bias in estimates increases. In addition, performance of MICE and EM was superior to that of regression and median (in terms of model composition and performance).
Based on our finding, pattern of missing data can affect the performance of imputation methods. When 10% or 20% of age variable was dropped out (scenario 1), most of imputation methods were able to select age as being significant. However, when missing rate increase to 50%, at EPVs of 10 and 5, all methods were failed to detect the importance of age. At EPV of 25 age reached significance level but parameter estimation suffered bias.
We should emphasize that our main aim in this paper was not to identify the variables that govern drug injection in prison, but to address impact of pattern of missing data on performance of imputation methods.
Table 2. Performance of imputation models at EPV of 10, under different missing rates and scenarios
Method Scenario 1 (Missing on age) Scenario 2 (Missing on all)
10% 20% 50% 10% 20% 50%
Does age include in the model?
Median Yes- Yes+ No Yes- Yes-
Yes-Regression Yes- No No Yes- Yes-
Yes-EM Yes- Yes- No Yes- Yes-
Yes-MICE Yes- Yes+ No Yes- Yes-
Yes-Number of bias in esimates
Median 0 1 4 0 0 5
Regression 0 4 4 0 0 2
EM 0 0 4 0 0 0
MICE 0 1 4 0 0 1
AIC
Full Model 1347.94
Median 1347.69 1353.11 1357.27 1343.66 1349.34 1360.04
Regression 1347.86 1357.27 1357.27 1347.44 1339.54 1354.28
EM 1346.65 1350.27 1357.27 1345.68 1345.44 1346.28
Min 1337.86 1341.48 1341.90 1343.69 1338.38 1328.15
MICE Median 1345.04 1346.78 1352.81 1345.92 1342.28 1346.66
Max 1348.68 1353.33 1357.27 1347.44 1351.17 1357.77
73
Comparison of two scenarios showed that, in the second scenario less bias in estimation and fewer mistakes in variable selection was seen. In the first method, bias in estimates of coefficient or SEs is more than the second method. Especially bias in estimation of regression coefficient and SE for age (the main variable of interest) increased.
In a similar study, 10%, 25% and 40% missing was generated in one single variable. When attrition was 10% , results of MICE model were similar to gold model. With 25% attrition, estimate of OR (Odds Ratio) was similar to gold model in multiple imputation, but result of regression imputation tended to overestimate. With 40% attrition both of methods (multiple imputation and regression imputation) had bias in estimation of ORs (31).
In another study, missing rates from 2.5% to 30% was generated in one variable, and performance of different imputation methods was compared. Comparison of results revealed that MICE was superior to missing indicator and complete-case analysis even missing rate of 30% (5).
In another study, authors generate missing rate of 10 to 90% in one variable under missing at random mechanism. Comparison of complete case and multiple imputation showed that multiple imputation led to less bias in regression coefficients (32).
In another simulation study, missing rates were 10%, 30% and 50%. Authors generated missing data in one variable. Comparison of MSE (Mean Squared Errors) suggested that performance of EM algorithm was better than regression imputation in all missing rates (21).
When we constructed scenario 2, (i.e. we generated missing data on all variables), significance of age variable was detected by all imputation methods at all EPVs and
under all missing rates. In a similar study, missing data was generated on multiple variables, from 0% to 20.6%. Authors have seen that performances of MICE method was better than regression imputation, EM, and median replacement (7).
In another study, missing rates of 5%, 10%, 25%, 50% and 75% were generated in four covariates Multiple imputation produced biased estimates for the incomplete skewed continuous variables at 50% and higher missing rates (4).
One of the limitations of this study was that we only generated under different EPVs. We also generated missing datum only once. We believe more extensive simulation studies are required to take into account the impact of sampling variation as well. However, our study was one of the first studies which were designed to investigate how the distribution of missing values across data influences performance of imputation models.
We have seen that EPV, imputation methods, and pattern of missing, can influence significance of variables and parameter estimation. Proportion of data used in likelihood based methods, to develop imputation model, can partially justify our findings. In the first scenario performance of likelihood-based methods are poor. This is because such methods use information of 50% of data to impute missing values for one single variable with 50% missing rate. Clearly, a regression model based on half of the data is not a powerful prediction tool. Therefore, application of such model to predict missing data might artificially change the distribution of variable with missing data.
Here one might argue that second scenario suffers the same problem. Although in the second scenario 50% of data are used to fit regression equation, but this equation is then used to predict only 3% of data for each independent
Table 3. Performance of imputation models at EPV of 5, under different missing rates and scenarios
Method Scenario 1 (Missing on age) Scenario 2 (Missing on all)
10% 20% 50% 10% 20% 50%
Does age include in the model?
Median Yes+ Yes- No Yes- Yes-
Yes-Regression Yes- No No Yes- Yes-
Yes-EM Yes- Yes- No Yes- Yes-
Yes-MICE Yes- Yes- No Yes- Yes-
Yes-Number of bias in esimates
Median 1 0 5 0 0 0
Regression 0 5 5 0 0 0
EM 0 0 5 0 0 0
MICE 0 0 5 0 0 0
AIC
Full Model 828.19
Median 830.68 830.64 833.04 827.50 830.65 806.49
Regression 828.45 833.04 833.04 828.51 828.20 831.68
EM 829.13 828.80 833.04 828.24 827.08 827.67
Min 826.42 826.99 827.34 827.83 824.33 827.67
MICE Median 828.07 828.95 832.07 828.41 827.65 830.64
Max 830.51 831.24 833.04 828.75 830.74 834.01
Haji-Mag
hsoudi
et al
/Int
ernational Journal of Health P
olicy and Management
, 2013, 1(1),
69-77
Table 4. Estimation of regression coeficients and their standard errors at EPV of 25, under different missing rates and scenarios
Model
Age
The main cause of recent incarceraion
thet
The onset of drug use
Dominant drug used in last month before recent imprisonment
Marital status
History of imprisonment
(in months)
Knowledge about AIDS Opium Heroin-crack Methadone
Coef. (SE) Coef. (SE) Coef. (SE) Coef. (SE) Coef. (SE) Coef. (SE) Coef. (SE) Coef. (SE) Coef. (SE)
Full 0.05 (0.01) 0.32 (0.12) -0.10 (0.01) -0.62 (0.13) 1.47 (0.14) 1.12 (0.20) 0.44 (0.07) 0.01 (>0.001)
-10 %
Median
Missing on all 0.05 (0.01) 0.30 (0.12) -0.10 (0.01) -0.62 (0.13) 1.45 (0.14) 1.11 (0.20) 0.44 (0.07) 0.01 (>0.001)
-Missing on age 0.05 (0.01) 0.30 (0.12) -0.10 (0.01) -0.61 (0.13) 1.48 (0.14) 1.13 (0.20) 0.44 (0.07) 0.01 (>0.001)
-Regression
Missing on all 0.05 (0.01) 0.31 (0.12) -0.10 (0.01) -0.62 (0.13) 1.46 (0.14) 1.08 (0.20) 0.45 (0.07) 0.01 (>0.001)
-Missing on age 0.04 (0.01) 0.30 (0.12) -0.10 (0.01) -0.60 (0.13) 1.48 (0.14) 1.15 (0.20) 0.43 (0.07) 0.01 (>0.001)
-EM
Missing on all 0.05 (0.01) 0.32 (0.12) -0.10 (0.01) -0.60 (0.13) 1.47 (0.14) 1.11 (0.20) 0.45 (0.07) 0.01(>0.001)
-Missing on age 0.05 (0.01) 0.303 (0.12) -0.10 (0.01) -0.61 (0.13) 1.48 (0.14) 1.13 (0.20) 0.44 (0.07) 0.01 (>0.001)
-MICE
Missing on all 0.05 (0.01) 0.32 (0.12) -0.10 (0.01) -0.61 (0.13) 1.47 (0.14) 1.11 (0.20) 0.45 (0.07) 0.01 (>0.001)
-Missing on age 0.05 (0.01) 0.33 (0.12) -0.10 (0.01) -0.63 (0.13) 1.47 (0.14) 1.13 (0.20) 0.45 (0.07) 0.01 (>0.001)
-20 %
Median
Missing on all 0.05 (0.01) 0.30 (0.12) -0.10 (0.01) -0.60 (0.13) 1.45 (0.13) 1.11 (0.20) 0.43 (0.07) 0.01 (>0.001)
-Missing on age 0.04 (0.01) 0.26 (0.12) -0.09 (0.01) -0.58 (0.13) 1.48 (0.13) 1.13 (0.20) 0.42 (0.07) 0.01 (>0.001)
-Regression
Missing on all 0.05 (0.01) 0.32 (0.12) -0.09 (0.01) -0.60 (0.13) 1.45 (0.14) 1.09 (0.20) 0.44 (0.07) 0.01 (>0.001)
-Missing on age 0.03 (0.01) 0.25 (0.12) -0.09 (0.01) -0.56 (0.13) 1.49 (0.13) 1.14 (0.20) 0.42 (0.07) 0.01 (>0.001)
-EM
Missing on all 0.05 (0.01) 0.32 (0.12) -0.10 (0.01) -0.60 (0.13) 1.46 (0.14) 1.12 (0.20) 0.44 (0.07) 0.01 (>0.001)
-Missing on age 0.04 (0.01) 0.30 (0.12) -0.09 (0.01) -0.59 (0.13) 1.48 (0.13) 1.14 (0.20) 0.43 (0.07) 0.01 (>0.001)
-MICE
Missing on all 0.05 (0.01) 0.32 (0.12) -0.10 (0.01) -0.60 (0.13) 1.46 (0.14) 1.09 (0.20) 0.44 (0.07) 0.01 (>0.001)
-Missing on age 0.04 (0.01) 0.30 (0.12) -0.10 (0.01) -0.61 (0.13) 1.46 (0.14) 1.13 (0.20) 0.44 (0.07) 0.01 (>0.001)
-50 %
Median
Missing on all 0.05 (0.01) 0.36 (0.12) -0.10 (0.01) -0.64 (0.13) 1.48 (0.13) 1.14 (0.20) 0.39 (0.07) 0.01 (>0.001) 0.37 (0.17)
Missing on age 0.03 (0.01) - -0.08 (0.01) -0.54 (0.13) 1.49 (0.13) 1.12 (0.20) 0.42 (0.07) 0.01 (>0.001)
-Regression
Missing on all 0.05 (0.01) 0.35 (0.12) -0.10 (0.01) -0.55 (0.13) 1.54 (0.14) 1.15 (0.2) 0.42 (0.07) 0.01 (>0.001)
-Missing on age 0.02 (0.01) - -0.08 (0.01) -0.53 (0.13) 1.50 (0.13) 1.13 (0.20) 0.41 (0.07) 0.01(>0.001)
-EM
Missing on all 0.05 (0.01) 0.37 (0.12) -0.10 (0.01) -0.58 (0.13) 1.48 (0.14) 1.14 (0.20) 0.44 (0.07) 0.01 (>0.001) 0.38 (0.17)
Missing on age 0.03 (0.01) - -0.10 (0.01) -0.55 (0.13) 1.49 (0.13) 1.11 (0.2) 0.42 (0.07) 0.01 (>0.001)
-MICE
Missing on all 0.05 (0.01) 0.36 (0.12) -0.10 (0.01) -0.59 (0.13) 1.50 (0.14) 1.11 (0.20) 0.42 (0.07) 0.01 (>0.001) 0.38 (0.17)
Citation:
Haji-Mag
hsoudi
S,
Hag
hdoos
t AA,
Rast
eg
ari
A,
Baneshi
MR.
Influe
nce
of
patt
ern
of
missing
data
on
per
formance
of
imputation
methods:
e
x
ample using national data on drug injection in prisons.
Int
ernational Journal of Healt
h P
olic
y and Manag
ement
Haji-Mag
hsoudi
et al
/Int
ernational Journal of Health P
olicy and Management
, 2013, 1(1),
69-77
Haji-Mag
hsoudi
S,
Hag
hdoos
t AA,
Rast
eg
ari
A,
Baneshi
MR.
Influe
nce
of
patt
ern
of
missing
data
on
per
formance
of
imputation
methods:
x
ample using national data on drug injection in prisons.
Int
ernational Journal of Healt
h P
olic
y and Manag
ement
2013; 1: 69-75.
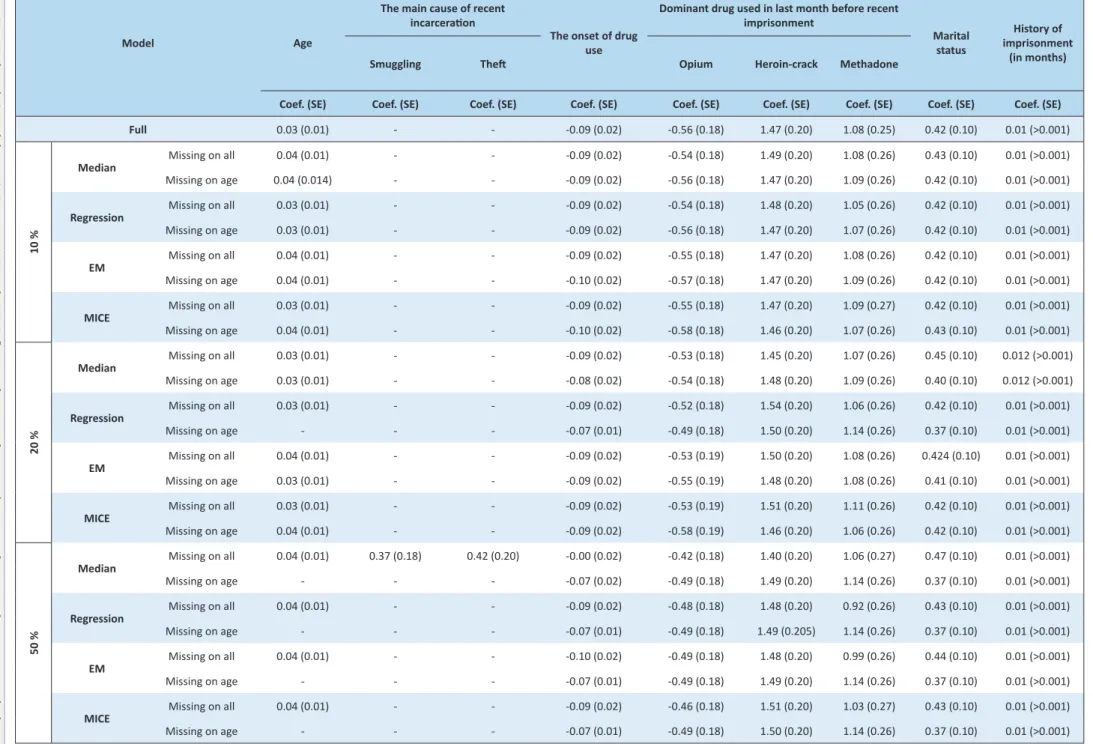
Model Age
The main cause of recent incarceraion
The onset of drug use
Dominant drug used in last month before recent imprisonment
Marital status
History of imprisonment
(in months)
Smuggling Thet Opium Heroin-crack Methadone
Coef. (SE) Coef. (SE) Coef. (SE) Coef. (SE) Coef. (SE) Coef. (SE) Coef. (SE) Coef. (SE) Coef. (SE)
Full 0.03 (0.01) - - -0.09 (0.02) -0.56 (0.18) 1.47 (0.20) 1.08 (0.25) 0.42 (0.10) 0.01 (>0.001)
10 %
Median
Missing on all 0.04 (0.01) - - -0.09 (0.02) -0.54 (0.18) 1.49 (0.20) 1.08 (0.26) 0.43 (0.10) 0.01 (>0.001)
Missing on age 0.04 (0.014) - - -0.09 (0.02) -0.56 (0.18) 1.47 (0.20) 1.09 (0.26) 0.42 (0.10) 0.01 (>0.001)
Regression
Missing on all 0.03 (0.01) - - -0.09 (0.02) -0.54 (0.18) 1.48 (0.20) 1.05 (0.26) 0.42 (0.10) 0.01 (>0.001)
Missing on age 0.03 (0.01) - - -0.09 (0.02) -0.56 (0.18) 1.47 (0.20) 1.07 (0.26) 0.42 (0.10) 0.01 (>0.001)
EM
Missing on all 0.04 (0.01) - - -0.09 (0.02) -0.55 (0.18) 1.47 (0.20) 1.08 (0.26) 0.42 (0.10) 0.01 (>0.001)
Missing on age 0.04 (0.01) - - -0.10 (0.02) -0.57 (0.18) 1.47 (0.20) 1.09 (0.26) 0.42 (0.10) 0.01 (>0.001)
MICE
Missing on all 0.03 (0.01) - - -0.09 (0.02) -0.55 (0.18) 1.47 (0.20) 1.09 (0.27) 0.42 (0.10) 0.01 (>0.001)
Missing on age 0.04 (0.01) - - -0.10 (0.02) -0.58 (0.18) 1.46 (0.20) 1.07 (0.26) 0.43 (0.10) 0.01 (>0.001)
20 %
Median
Missing on all 0.03 (0.01) - - -0.09 (0.02) -0.53 (0.18) 1.45 (0.20) 1.07 (0.26) 0.45 (0.10) 0.012 (>0.001)
Missing on age 0.03 (0.01) - - -0.08 (0.02) -0.54 (0.18) 1.48 (0.20) 1.09 (0.26) 0.40 (0.10) 0.012 (>0.001)
Regression
Missing on all 0.03 (0.01) - - -0.09 (0.02) -0.52 (0.18) 1.54 (0.20) 1.06 (0.26) 0.42 (0.10) 0.01 (>0.001)
Missing on age - - - -0.07 (0.01) -0.49 (0.18) 1.50 (0.20) 1.14 (0.26) 0.37 (0.10) 0.01 (>0.001)
EM
Missing on all 0.04 (0.01) - - -0.09 (0.02) -0.53 (0.19) 1.50 (0.20) 1.08 (0.26) 0.424 (0.10) 0.01 (>0.001)
Missing on age 0.03 (0.01) - - -0.09 (0.02) -0.55 (0.19) 1.48 (0.20) 1.08 (0.26) 0.41 (0.10) 0.01 (>0.001)
MICE
Missing on all 0.03 (0.01) - - -0.09 (0.02) -0.53 (0.19) 1.51 (0.20) 1.11 (0.26) 0.42 (0.10) 0.01 (>0.001)
Missing on age 0.04 (0.01) - - -0.09 (0.02) -0.58 (0.19) 1.46 (0.20) 1.06 (0.26) 0.42 (0.10) 0.01 (>0.001)
50
%
Median
Missing on all 0.04 (0.01) 0.37 (0.18) 0.42 (0.20) -0.00 (0.02) -0.42 (0.18) 1.40 (0.20) 1.06 (0.27) 0.47 (0.10) 0.01 (>0.001)
Missing on age - - - -0.07 (0.02) -0.49 (0.18) 1.49 (0.20) 1.14 (0.26) 0.37 (0.10) 0.01 (>0.001)
Regression
Missing on all 0.04 (0.01) - - -0.09 (0.02) -0.48 (0.18) 1.48 (0.20) 0.92 (0.26) 0.43 (0.10) 0.01 (>0.001)
Missing on age - - - -0.07 (0.01) -0.49 (0.18) 1.49 (0.205) 1.14 (0.26) 0.37 (0.10) 0.01 (>0.001)
EM
Missing on all 0.04 (0.01) - - -0.10 (0.02) -0.49 (0.18) 1.48 (0.20) 0.99 (0.26) 0.44 (0.10) 0.01 (>0.001)
Missing on age - - - -0.07 (0.01) -0.49 (0.18) 1.49 (0.20) 1.14 (0.26) 0.37 (0.10) 0.01 (>0.001)
Missing on all 0.04 (0.01) - - -0.09 (0.02) -0.46 (0.18) 1.51 (0.20) 1.03 (0.27) 0.43 (0.10) 0.01 (>0.001)
76
Table 6. Estimation of regression coeficients and their standard errors at EPV of 5, under different missing rates and scenarios
Model Age The onset of
drug use Heroin-crack Marital status
History of imprisonment
(in months)
Coef. (SE) Coef. (SE) Coef. (SE) Coef. (SE) Coef. (SE)
Full 0.03 (0.01) -0.11 (0.02) 1.91 (0.26) 0.37 (0.13) 0.012 (>0.001)
10
%
Median
Missing on all 0.03 (0.01) -0.11 (0.02) 1.92 (0.26) 0.37 (0.13) 0.01 (>0.001)
Missing on age 0.03 (0.01) -0.10 (0.02) 1.91 (0.26) 0.36 (0.13) 0.01 (>0.001)
Regression
Missing on all 0.03 (0.01) -0.11 (0.02) 1.91 (0.26) 0.37 (0.13) 0.01 (>0.001)
Missing on age 0.03 (0.01) -0.11 (0.02) 1.91 (0.26) 0.37 (0.13) 0.01 (>0.001)
EM
Missing on all 0.03 (0.01) -0.11 (0.02) 1.91 (0.26) 0.37 (0.13) 0.01 (>0.001)
Missing on age 0.03 (0.01) -0.11 (0.02) 1.91 (0.26) 0.37 (0.13) 0.01 (>0.001)
MICE
Missing on all 0.03 (0.01) -0.11 (0.02) 1.93 (0.26) 0.364 (0.13) 0.01 (>0.001)
Missing on age 0.03 (0.01) -0.11 (0.02) 1.93 (0.26) 0.373 (0.13) 0.01 (>0.001)
20
%
Median
Missing on all 0.04 (0.01) -0.11 (0.02) 1.87 (0.25) 0.361 (0.13) 0.01 (>0.001)
Missing on age 0.03 (0.01) -0.1 (0.02) 1.91 (0.26) 0.35 (0.13) 0.01 (>0.001)
Regression
Missing on all 0.03 (0.01) -0.11 (0.02) 1.90 (0.26) 0.36 (0.13) 0.01 (>0.001)
Missing on age - -0.08 (0.02) 1.91 (0.26) 0.31 (0.13) 0.01 (>0.001)
EM
Missing on all 0.04 (0.01) -0.11 (0.02) 1.91 (0.26) 0.36 (0.13) 0.01 (>0.001)
Missing on age 0.04 (0.01) -0.11 (0.02) 1.92 (0.26) 0.35 (0.13) 0.01 (>0.001)
MICE
Missing on all 0.04 (0.01) -0.11 (0.02) 1.93 (0.26) 0.37 (0.13) 0.01 (>0.001)
Missing on age 0.03 (0.01) -0.11 (0.02) 1.93 (0.26) 0.37 (0.13) 0.01 (>0.001)
50
%
Median
Missing on all 0.03 (0.01) -0.01 (0.02) 1.85 (0.25) 0.40 (0.13) 0.01 (>0.001)
Missing on age - -0.08 (0.02) 1.91 (0.26) 0.31 (0.13) 0.01 (>0.001)
Regression
Missing on all 0.04 (0.01) -0.10 (0.02) 1.90 (0.26) 0.38 (0.13) 0.01 (>0.001)
Missing on age - -0.08 (0.02) 1.91 (0.26) 0.31 (0.13) 0.01 (>0.001)
EM
Missing on all 0.04 (0.01) -0.11 (0.02) 1.90 (0.26) 0.40 (0.13) 0.01 (>0.001)
Missing on age - -0.08 (0.02) 1.91 (0.26) 0.40 (0.13) 0.01 (>0.001)
MICE
Missing on all 0.04 (0.01) -0.10 (0.02) 1.91 (0.26) 0.40 (0.13) 0.01 (>0.001)
Missing on age - -0.08 (0.02) 1.92 (0.26) 0.31 (0.13) 0.01 (>0.001)
variable. Therefore, even if regression equation is biased, it does not change the distribution of independent variables. When we fitted (C-C) models, results were much poorer (data not shown). In addition, these findings highlight how detection of factors influence drug injection in outcome can be misleading. We strongly recommend imputation of missing values in national data before any model development.
Acknowledgements
We should thank Dr. Abbas Sedaghat, Dr. Ehsan Mostafavi, and Dr. Soodabeh Navadeh who facilitated our access to the data. We also express our thanks to the Center for Disease Control (CDC), at the Iranian Ministry of Health and Medical Education.
Ethical issues
This study was approved by ethics committee of Kerman University of Medical Sciences.
Competing interests
The authors declare no competing interests.
Authors’ contributions
Analyses are performed by H-M S and BMR. All authors contributed in writing of the manuscript. All authors have read and approved the inal manuscript.
References
1. Shokoohi M, Baneshi MR, Haghdoost AA. Estimation of the Active
Network Size of Kermanian Males. Addiction and Health 2011; 2(3-4):
81-88.
77
3. Donders ART, van der Heijden GJMG, Stijnen T, Moons KGM.
Review: a gentle introduction to imputation of missing values. J Clin
Epidemiol 2006; 59(10): 1087-91.
4. Marshall A, Altman DG, Royston P, Holder RL. Comparison of techniques for handling missing covariate data within prognostic
modelling studies: a simulation study. BMC Med Res Methodol 2010;
10(1): 7.
5. Knol MJ, Janssen KJM, Donders ART, Egberts ACG, Heerdink ER,
Grobbee DE, et al. Unpredictable bias when using the missing indicator
method or complete case analysis for missing confounder values: an
empirical example. J Clin Epidemiol 2010; 63: 728-36.
6. Barzi F, Woodward M. Imputations of missing values in practice:
results from imputations of serum cholesterol in 28 cohort studies. Am J
Epidemiol 2004; 160(1): 34-45.
7. Baneshi MR, Talei AR. Impact of imputation of missing data on
estimation of survival rates: an example in breast cancer. Iranian Journal
of Cancer Prevention 2010; 3(3): 127-31.
8. Baneshi MR, Talei AR. Prevention of Disease Complications through
Diagnostic Models: How to Tackle the Problem of Missing Data? Iran J
Public Health 2012; 41(1).
9. Vargas-Chanes D, Decker PA, Schroeder DR, Offord KP. An Introduction to Multiple Imputation Methods: Handling Missing Data with SAS@ V8. 2. Rochester, MN: Mayo Foundation; 2003.
10. Farhangfar A, Kurgan L, Dy J. Impact of imputation of missing values
on classification error for discrete data. Pattern Recognit 2008; 41(12):
3692-705.
11. Horton NJ, Kleinman KP. Much Ado About Nothing: A Comparison of Missing Data Methods and Software to Fit Incomplete Data Regression
Models. Am Stat 2007; 61(1): 79-90.
12. Langkamp DL, Lehman A, Lemeshow S. Techniques for handling
missing data in secondary analyses of large surveys. Acad Pediatr 2010;
10(3): 205-10.
13. Marlin BM. Missing data problems in machine learning. Toronto:
University of Toronto; 2008.
14. Klebanoff MA, Cole SR. Use of multiple imputation in the
epidemiologic literature. Am J Epidemiol 2008; 168(4): 355-7.
15. Harel O, Zhou XH. Multiple imputation: review of theory,
implementation and software. Stat Med 2007; 26(16): 3057-77.
16. Chen Q, Wang S. Variable selection for multiply-imputed data with
application to dioxin exposure study. Stat Med 2013. [In Press]
17. Faris PD, Ghali WA, Brant R, Norris CM, Galbraith PD, Knudtson ML. Multiple imputation versus data enhancement for dealing with
missing data in observational health care outcome analyses. J Clin
Epidemiol 2002; 55(2): 184-91.
18. Van Buuren S, Groothuis-Oudshoorn K. MICE: Multivariate
imputation by chained equations in R. Journal of Statistical Software
2011; 45(3): 1-68.
19. JC W. Multiple Imputation For Missing Data: What Is It And How Can I Use It? Annual Meeting of the American Educational Research Association; Chicago, IL; 2003.
20. White IR, Royston P, Wood AM. Multiple imputation using chained
equations: Issues and guidance for practice. Stat Med 2010; 30(4):
377-99.
21. Suraphee S, Raksmanee C, Busaba J, Chaisorn C, Nakornthai W. A Comparison of Estimation Methods for Missing Data in Multiple Linear
Regression with Two Independent Variables. Thailand Statistician 2006;
4: 13-26.
22. Lin TH. A Comparison of multiple imputation with EM algorithm and
MCMC method for quality of life missing data. Qual Quant 2010; 44:
277-87.
23. N.Otwombe K, Galpin J. Weighting Method for Binary Longitudinal Data With Incomplete Covariates and Outcomes Incorporating Auxiliary Information. Available at: http://www.statssa.gov.za/ycs/ SpeakerPresentations/Acropolis5/Day3/Session%20VIIID_Prof.%20 Jacky%20Galpin/Otwombe%20Kennedy.pdf
24. Allison PD. Missing Data. Available at: http://www.statisticalhorizons. com/wp-content/uploads/2012/01/Milsap-Allison.pdf.
25. Baneshi MR, Talei AR. Does the Missing Data Imputation Method
Affect the Composition and Performance of Prognostic Models? Iran
Red Crescent Med J 2012; 14(1): 51-6.
26. Yuan YC, editor. Multiple imputation for missing data: concepts and new development (version 9.0). 2000. Available at: http://www.math. montana.edu/~jimrc/classes/stat506/notes/multipleimputation-SAS.pdf 27. Bernaards CA, Farmer MM, Qi K, Dulai GS, Ganz PA, Kahn KL. Comparison of Two Multiple Imputation Procedures in a Cancer
Screening Survey. J Data Sci 2003; 1: 1-20.
28. Catellier DJ, Hannan PJ, Murray DM, Addy CL, Conway TL, Yang
S, et al. Imputation of missing data when measuring physical activity by
accelerometry. Med Sci Sports Exerc 2005; 37(11 Suppl): S555.
29. Cheng Y, Sherman SG, Srirat N, Vongchak T, Kawichai S, Jittiwutikarn
J, et al. Risk factors associated with injection initiation among drug users
in Northern Thailand. Harm Reduct J 2006; 3: 10.
30. Van Buuren S, Boshuizen HC, Knook DL. Multiple imputation of
missing blood pressure covariates in survival analysis. Stat Med 1999;
18(6): 681-94.
31. Kristman VL, Manno M, Cote P. Methods to account for attrition in longitudinal data: do they work? A simulation study. Eur J Epidemiol 2005; 20(8): 657-62.
32. Janssen KJM, Donders ART, Harrell FE, Vergouwe Y, Chen Q,
Grobbee DE, et al. Missing covariate data in medical research: to impute