www.hydrol-earth-syst-sci.net/15/3033/2011/ doi:10.5194/hess-15-3033-2011
© Author(s) 2011. CC Attribution 3.0 License.
Earth System
Sciences
Scaling and trends of hourly precipitation extremes in two different
climate zones – Hong Kong and the Netherlands
G. Lenderink1, H. Y. Mok2, T. C. Lee2, and G. J. van Oldenborgh1 1Royal Netherlands Meteorological Institute, De Bilt, The Netherlands 2Hong Kong Observatory, Hong Kong, China
Received: 27 April 2011 – Published in Hydrol. Earth Syst. Sci. Discuss.: 11 May 2011 Revised: 2 September 2011 – Accepted: 21 September 2011 – Published: 29 September 2011
Abstract. Hourly precipitation extremes in very long time series from the Hong Kong Observatory and the Netherlands are investigated. Using the 2 m dew point temperature from 4 h before the rainfall event as a measure of near surface ab-solute humidity, hourly precipitation extremes closely follow a 14 % per degree dependency – a scaling twice as large as following from the Clausius-Clapeyron relation. However, for dew point temperatures above 23◦C no significant
de-pendency on humidity was found. Strikingly, in spite of the large difference in climate, results are almost identical in Hong Kong and the Netherlands for the dew point tem-perature range where both observational sets have sufficient data. Trends in hourly precipitation extremes show sub-stantial increases over the last century for both De Bilt (the Netherlands) and Hong Kong. For De Bilt, not only the long term trend, but also variations in hourly precipitation extremes on an inter-decadal timescale of 30 yr and longer, can be linked very well to the above scaling; there is a very close resemblance between variations in dew point tempera-ture and precipitation intensity with an inferred dependency of hourly precipitation extremes of 10 to 14 % per degree. For Hong Kong there is no connection between variations in humidity and those in precipitation intensity in the wet sea-son, May to September. This is consistent with the found zero-dependency of precipitation intensity on humidity for dew points above 23◦C. Yet, outside the wet season
humid-ity changes do appear to explain the positive trend in hourly precipitation extremes, again following a dependency close to twice the Clausius-Clapeyron relation.
Correspondence to:G. Lenderink
1 Introduction
It is generally conceived that the intensity of precipitation extremes will increase as the climate warms (IPCC, 2007). The primary reason for this expectation is the fact that the maximum moisture content of the atmosphere increases with approximately 7 % per degree temperature rise, which fol-lows from the Clausius-Clapeyron relation (hereafter C-C relation). If the relative humidity does not change, then in-creases in atmospheric humidity (water vapor) occur at the same rate. Indeed, in models it is generally found that in-creases in near surface humidity follow the C-C relation, in particular over wet surfaces like the ocean, and this can be understood from the surface energy budget (Held and So-den, 2006; Schneider and O’Gorman, 2007; O’Gorman and Muller, 2010; Sherwood et al., 2010). There is observa-tional support for increasing moisture above the oceans (San-ter et al., 2007). Above land Willett et al. (2010) also found observed increases of moisture consistent with the C-C rela-tion in many areas, yet with substantial deviarela-tions in water limited regions. O’Gorman and Muller (2010) found a 1– 2 % K−1 lower rate compared to the C-C relation over the
continents in a large ensemble of GCM results.
In two earlier studies we found increases in hourly precip-itation extremes of approximately two times the C-C relation from observations of the Netherlands, Belgium and Switzer-land for daily mean temperatures above 14◦C (Lenderink
and van Meijgaard, 2008, 2010). There are several questions open to debate concerning this enhanced temperature depen-dency compared to the C-C relation – a “super” C-C scaling. These questions concern the cause of the observed relation, the generality of the results, the role of humidity, and the ap-plicability of the observed relation to climate change.
Haerter and Berg (2009) argue that the super C-C scaling results from a dependency of the frequency of occurrence of large-scale versus convective precipitation with temperature. Since convective events are by their nature more intense than large-scale events, and convective events become more frequent with rising temperature, this could statistically induce an enhanced temperature dependency. If this is the case, it is unlikely that the found scaling is a good predictor of changes in hourly precipitation extremes due to climate change. Conversely, our hypothesis is that the super C-C scaling is caused by a feedback from the dynamics of the cloud due to latent heat release (Trenberth et al., 2003; Lenderink and van Meijgaard, 2009). In that case, if it is related to how convective storms react to increasing humidity, it could be a good predictor of increases in hourly precipitation extremes in a warmer climate.
Another question is whether (and, if so, at what tempera-ture) there is a limit to the super C-C dependency. There are some indications of such a limit in the results of Lenderink and van Meijgaard (2008, 2010), but the temperature range at which this occurs is not well sampled in the data. Such a limit could have a physical cause (see e.g. below), but the statistical explanation proposed by Haerter and Berg (2009) also implies a limit to the super C-C dependency.
Further, the availability of moisture under warm condi-tions is an important issue. It has been argued that soil dry-ing, and a resulting decrease in relative humidity at high tem-peratures, could cause a limit to the super C-C scaling of pre-cipitation extremes (Berg et al., 2009). Indeed, this may ex-plain the lower dependency of hourly precipitation extremes, or even decrease with temperature, found in recent studies for Australia and the United States (Hardwick Jones et al., 2010; Shaw et al., 2011). For this reason, Lenderink and van Meijgaard (2010) introduced the dew point temperature as a direct measure of atmospheric absolute humidity. For the Netherlands temperature and dew point temperature give similar results. This is because the relative humidity is ap-proximately constant over a large temperature range, which implies a practically constant offset between temperature and dew point temperature. However, this is likely not a general result.
For these reasons it is of interest to investigate hourly pre-cipitation extremes from stations from a warmer, more trop-ical climate zone, where precipitation is more dominated by convective systems and where the higher temperature range
is well sampled. Here, we investigate a very long time se-ries from 1885 to 2009 of hourly precipitation measured at the Hong Kong Observatory, and compare results with ear-lier findings.
The length of the observational data from De Bilt (the Netherlands) and Hong Kong also allows us to look at trends and natural variability in hourly precipitation extremes. It is of particular interest to investigate whether trends in ex-tremes can be explained by temperature and/or humidity changes using the above scaling relations. If this is the case, we can have more confidence that the observed scaling can be used as a predictor of the influence of climate change on hourly precipitation extremes.
Finally, we note that there could be a dependency of the scaling of precipitation extremes on the aggregation inter-val. For instance, Haerter et al. (2010) and Utsumi et al. (2011) found different behaviours between hourly and sub-hourly precipitation. Here we will not investigate this further since sub-hourly data is not (yet) available for the data stud-ied here, but we note that this could be an important factor which deserves further research.
2 Data and methods
2.1 Observations
A brief description of the observational data sets follows here. All three data sets have been recorded by the meteo-rological services according to WMO standards and/or the guidelines provided by the Met Office, and some additional quality checks have been performed on the data; more de-tails are provided in Sect. a of the Supplement. First, we use observations made at the Hong Kong Observatory, lo-cated in the urban centre of Hong Kong (hereafter, HKO). Continuous observations of hourly temperature, humidity, and precipitation since 1885 are available, except from 1940 until 1946 during World War II (Lee et al., 2006; Wong et al., 2010). Second, observations at De Bilt in the centre of the Netherlands since 1906 (hereafter, DB). Hourly pre-cipitation is available for the whole period, but before 1950 hourly humidity measurements are lacking. Third, observa-tions of 27 staobserva-tions within the Netherlands of the last 15 yr from 1995 until 2010 (hereafter, NL). These stations are rel-atively closely spaced in homogeneous environment – a flat river delta – so that the hourly data of precipitation, humidity, and temperature of separate stations can be pooled together to obtain one large data set containing approximately 400 yr of data (see Supplement of Lenderink and van Meijgaard, 2010 for more details).
over the mainland of China, bringing cool air mass from the north or northeast to Hong Kong. In hot seasons (roughly between May to September), heavy rains are mostly trig-gered by the onset of the southwest monsoon or a trough of low pressure lying from west to east across the northern part of the South China Sea or along the south China coast. The approach and passage of tropical cyclones from west-ern North Pacific and South China Sea could also bring high winds and heavy rain to the territory. When the sub-tropical ridge over the western Pacific extends westward to cover the south China coastal areas, the weather is sunny and hot.
The Netherlands has a moderate maritime climate with mild winters and relatively cool summers. In winter south-westerly atmospheric circulation patterns dominate with fre-quent passages of low pressure systems. In summer a weak westerly flow is prevalent. Strong precipitation events in summer mostly occur after a period of warm weather, with a retreating high pressure system over central Europe and a low pressure system approaching from the southwest. Under such conditions atmospheric humidity is high and mesoscale convective systems often develop in France and Belgium dur-ing the afternoon, givdur-ing rise to extreme precipitation durdur-ing the evening and night in the Netherlands. In autumn with northwesterly flows convective showers often develop above the warm Northsea water.
2.2 Analysis scaling
Relations between temperature and precipitation are difficult to asses because of an ambiguity of causes and effects, in par-ticular over moisture-limited regions and the summer season (Trenberth and Shea, 2005). Most important is the depen-dency of both temperature and precipitation on the atmo-spheric circulation conditions (Lenderink et al., 2009). In summer, this causes a negative correlation between mean precipitation and temperature since high pressure systems cause warm weather with at the same time low relative hu-midity and low precipitation amounts. A prolonged pe-riod with dry weather could result in soil moisture deple-tion, with further reduced surface evaporation and temper-ature increases (Vautard et al., 2007). This again implies a negative correlation between temperature and precipitation, which could be further enhanced by feedbacks from clouds. Yet, on a climatic time scale warmer temperatures are asso-ciated with increasing moisture (as discussed in the introduc-tion) and on a global average precipitation increases. It is this causal relation – temperature increases causing moisture in-creases, causing increases in precipitation extremes – we are interested in and which we want to derive from present-day observations.
We (partly) circumvented this ambiguity by taking, instead of the temperature, the dew point temperature as a direct measure of moisture in most of the analyses. The dew point temperature follows from
qsat(Td)=qv, (1)
whereqsat is the saturation specific humidity as a function
of temperature (omitting the dependency ofqsaton pressure)
andqvthe actual specific humidity (or moisture content) of
the air. The dew point temperatureTdcan be obtained by
in-verting this equation, and is a measure of absolute humidity. The difference between temperature and the dew point tem-perature,T−Tdwhich is commonly referred to as dew point
depression, is a direct measure of relative humidity. In first-order approximation a constant dew point depression implies a constant relative humidity across a reasonable temperature range (sinceqsatis approximately an exponential function of
T).
A scaling of extreme precipitation intensity was first found as a function of temperature (Lenderink and van Meij-gaard, 2008). For the reasons stated above we introduced in Lenderink and van Meijgaard (2010) the daily mean dew point temperature. Here, we will primarily use hourly dew point temperatures. Dependencies of hourly precipitation in-tensity on the (dew point) temperature are computed using a binning technique following Lenderink and van Meijgaard (2008, 2010). Binning is done in classes of 2◦C width. Bins
are overlapping with steps of one degree; this is done to avoid a dependency of the appearance of the plots on the arbi-trary choice of the binning intervals, which sometimes occurs when the amount of observations is limited. With the pooled data from The Netherlands (NL) (>400 yr of hourly data) very similar are obtained with a bin width of 1◦C, but with
the data from HKO the number of precipitation events in a bin of 1◦C becomes too limited to reliably computed the
ex-tremes. From the binned data different percentiles are com-puted from the distribution of wet events. Here, wet events are hours with precipitation amounts larger than or equal 0.1 mm h−1(for examples of these distributions see
Supple-ment, Sect. b). In addition to the percentiles computed from the raw data, the 99th and 99.9th percentile are computed also from a Generalized Pareto Distribution (GPD) (Coles, 2001) fit to the upper 4 % of the data. Uncertainty estimates for the 99th and 99.9th percentiles are derived from the error estimates of the GPD fit. The 98 % confidence interval of this fit is indicated by the shading.
2.3 Analysis trend
1 10
-2 6 14 22 30
intensity (mm hour
-1 )
temperature (oC) a)
HKO 99.9%
99% 90%
1 10
-2 6 14 22 30
intensity (mm hour
-1 )
temperature (oC) b)
NL 99.9%
99% 90%
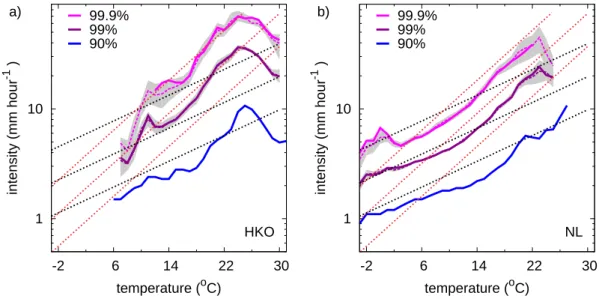
Fig. 1. Dependency of different percentiles of hourly precipitation extremes on daily mean temperature (left: HKO; right: NL). Stippled
lines are estimates from the GPD fitting procedure, whereas solid lines are the percentiles computed from the raw data (in most cases these overlap). The grey shading denotes the 98% uncertainty range derived from the GPD fit. Red (black) stippled lines denote dependencies of 14 % (7 %) per degree. For comparison, these lines are identical in all plots; the distance between two lines is a factor 2 in intensity.
are first computed from the GPD fit. Anomalies compared to the average of all 15-yr periods are then computed, and then averaged over several months, e.g. June, July and Au-gust (JJA) or the months May until October (MJJASO). This measure is denoted as1Prh. Error bands are based on the
98 % confidence interval of the GPD fit procedure, assuming errors of the separate months to be independent. The choice of 15 yr is a compromise between being able to determine the different extremes (which are very noisy with less than 10 yr of data) and being able to capture inter-decadal variations (which are more damped with longer aggregation periods). Here, we use the daily mean dew point temperature because hourly observations are not available for the De Bilt time se-ries before 1950. We note that for the period 1950–2006 sim-ilar results are obtained using hourly dew point temperatures.
3 Scaling of hourly precipitation extremes
Figure 1 shows scaling relations of hourly precipitation ex-tremes derived using the daily mean temperature for data from the Hong Kong Observatory (HKO) and the 27 stations in the Netherlands (NL). For NL, this is the reproduction of Fig. 1d in Lenderink and van Meijgaard (2010), yet with one year more data for each station. There is clear hint of a de-crease in precipitation intensity for temperatures above 24◦C
in NL, but the number of observations with rain above that temperature is very small and consequently the error bands are large. For instance, above 24◦C there is no observation
corresponding to the 99.9th percentile, and this percentile is computed from the extrapolation by means of the GPD
fit (indicated by the dashed purple line in Fig. 1). There is a very clear fall off in intensity above 24◦C in HKO. Since
there are many days (about 50 % of days in 1971–2000) with daily mean temperatures above that temperature in HKO, this fall off in intensity is obviously well sampled. Below 24◦C,
both data sources show a super C-C scaling. At the same temperature, and for the same percentile, intensities in HKO are generally larger than those in NL by 20–30 %.
1 10
-2 6 14 22
intensity (mm hour
-1 )
dewpoint temperature (oC)
a)
HKO,h-0 99.9%
99% 90%
1 10
-2 6 14 22
intensity (mm hour
-1 )
dewpoint temperature (oC)
b)
HKO,h-2 99.9%
99% 90%
1 10
-2 6 14 22
intensity (mm hour
-1 )
dewpoint temperature (oC)
c)
HKO,h-4 99.9%
99% 90%
1 10
-2 6 14 22
intensity (mm hour
-1 )
dewpoint temperature (oC)
d)
NL,h-0 99.9%
99% 90%
1 10
-2 6 14 22
intensity (mm hour
-1 )
dewpoint temperature (oC)
e)
NL,h-2 99.9%
99% 90%
1 10
-2 6 14 22
intensity (mm hour
-1 )
dewpoint temperature (oC)
f)
NL,h-4 99.9%
99% 90%
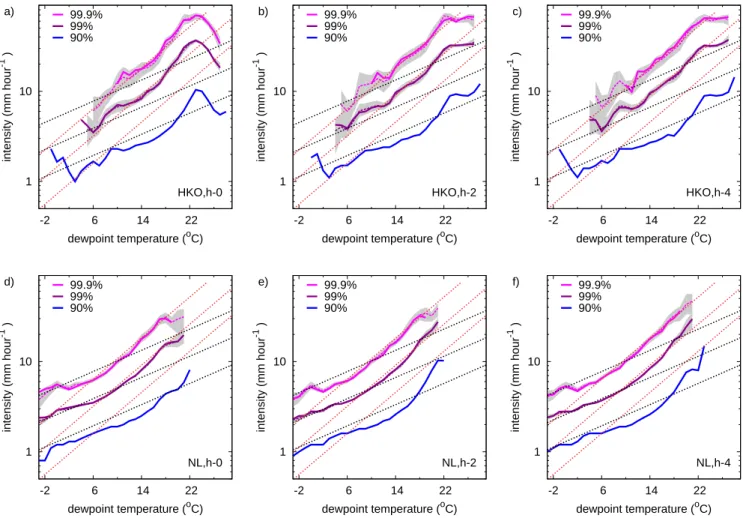
Fig. 2. Dependency of different percentiles of hourly precipitation extremes on dew point temperature taken 0 (h-0), 2 (h-2) and 4 (h-4) h
before each precipitation event (upper panels: HKO; lower panels: NL). Lines and symbols are the same as in Fig. 1.
Taking the hourly dew point temperature as predictor, a very well defined scaling is obtained in HKO and NL (Fig. 2c and f). In the dew point temperature range between 12 and 20◦C, the 99th and 99.9th percentiles are almost
iden-tical for both data sources. The dependency is close to 14 % per degree, which is two times the C-C relation. Since NL and HKO are in completely different climate zones, this uni-versality is a striking result.
Results for HKO also clearly show an upper limit for the increase in precipitation intensity with dew point tempera-ture. For dew point temperatures above 23◦C intensities
reach a constant level, which is approximately 65 mm h−1
for the 99.9th percentile. Figure 3 shows that about 40 % of all hours have a dew point temperature above 23◦C taken
over the whole year, and in summer (JJA) this percentage is even 90 %. Thus it is clear that the range above 23◦C is well
sampled in the HKO data, and that the levelling off is not due to poor sampling or a consequence of rather anomalous atmospheric conditions.
Figure 3 shows that the highest precipitation extremes do not necessarily occur for the highest dew point temperatures,
which one might expect from Fig. 2. For all hours with precipitation amounts exceeding the 99th percentile (≈ 10 mm h−1) in NL, the median dew point temperature is
ap-proximately 16◦C. The reason for this is that there are many
more precipitation events for the lower and intermediate dew points temperature range than for the highest dew point tem-peratures (as can be seen from the figures in Sect. b of the Supplement).
0 0.2 0.4 0.6 0.8 1
8 12 16 20 24 28
probability [0..1]
dew point temperature (oC) HKO,JJA Tdew
Tdew|P>0.1 Tdew|P>P90 Tdew|P>P99
0 0.2 0.4 0.6 0.8 1
0 4 8 12 16 20
probability [0..1]
dew point temperature (oC) NL,JJA Tdew
Tdew|P>0.1 Tdew|P>P90 Tdew|P>P99
Fig. 3.Cumulative Density Function (CDF) of the dew point temperature for summer (JJA). Distributions of the dew point temperature are
plotted for all hours (black line), for hours with precipitation (cyan), and for hours with precipitation exceeding the 90th (blue) and 99th (magenta) percentile of hourly precipitation. As in Fig. 2 dew point temperatures are taken 4 h before the precipitation event. The grey stippled line gives the CDF of all hours for the whole year.
atmospheric conditions, like the (mesoscale) circulation, ver-tical instability and wind shear, are all important as well. Thus, by selecting more extreme precipitation events, one in-advertently also samples those atmospheric conditions that, besides humidity, give rise more intense precipitation.
Yet, we note that the cumulative distributions of the dew point temperature from Fig. 3 are qualitatively consistent with the scaling relations in Fig. 2. On the one hand, in HKO almost all extreme events in summer occur with a near surface dew point above 23◦C, where the dependency on
moisture is small. Consequently, there is no difference in the distribution of humidity for extreme precipitation events with that occurring on all days. On the other hand, most extreme events in NL occur at humidity levels where the dependency on humidity is still strong: 14 % per degree dew point tem-perature (Fig. 2). Thus for NL one expects that more extreme precipitation events are characterized by on average higher humidity values as shown in Fig. 3.
4 Long term trends over the last century
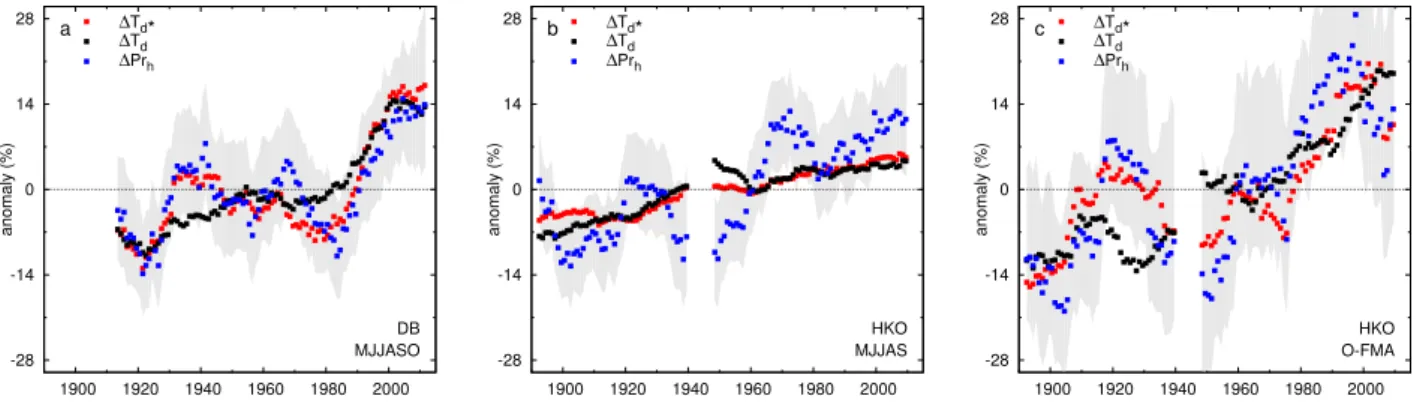
Figure 4 compares long-term variations in the intensity of hourly precipitation extremes with variations in the dew point temperature (multiplied by 14 % per degree). For DB a very good correspondence between the variations in dew point temperature on days with intense precipitation (1T∗
d) and
variations in extreme precipitation (1Prh) is shown for the
months May to October (MJJASO). Not only the trend over the century, but also variations on the inter-decadal time-scale are very similar. (Days with heavy precipitation are defined as the days on which an hourly precipitation ob-servation exceeds the 90th percentile of the distribution of
precipitation on wet hours. Similarly to1Prh,1Td∗is first
computed seperately for the different months and then aver-aged.) The dependency of1Prhon1Td∗ however appears
somewhat smaller, and the best fit is obtained 11 % per de-gree (Supplement, Sect. c). For the summer months, June, July, and August, the dependency is 13 % per degree, close to two times the C-C relation. Absolute percentiles of the distribution of hourly precipitation – the 99.5th, 99.9th and 99.95th percentiles – and also the seperate percentiles show very similar time variations (Supplement, Sect. d).
For the wet season May to September (MJJAS) in Hong Kong there is no obvious correspondence between1Prhand
1T∗
d. Both show upward trends, but on an inter-decadal time
scale there is no clear connection. This is consistent with the fact that the mean dew point temperature for these months is close to or above the threshold of 23◦C, where Fig. 2 shows
no dependency of precipitation extremes on dew point tem-perature. The reason for the upward trend in 1Prh is not
further investigated here. It could be related to the urbaniza-tion (Kishtawal et al., 2010; Ginn et al., 2010) or changing large scale conditions, like for instance the apparent change in strength of the summer monsoon (Xu et al., 2006; Ding et al., 2008).
Outside the wet season, we could find a reasonably good correspondence between1Prhand1Td∗for the months,
Oc-tober, and February until April (O-FMA). The signal-to-noise ratio, however, is worse than that for DB. In November and December, the number of wet events is so low (approxi-mately 3 %) that changes in the extremes could not be deter-mined reliably. A regression of1Prhon1Td∗gives a
depen-dency of 13–16 % per degree (Supplement, Sect. c).
Finally, the long term trends in dew point tempera-ture on extreme wet days 1T∗
-28 -14 0 14 28
1900 1920 1940 1960 1980 2000
anomaly (%)
MJJASO a
DB ∆Td*
∆Td
∆Prh
-28 -14 0 14 28
1900 1920 1940 1960 1980 2000
anomaly (%)
MJJAS b
HKO ∆Td*
∆Td
∆Prh
-28 -14 0 14 28
1900 1920 1940 1960 1980 2000
anomaly (%)
O-FMA c
HKO ∆Td*
∆Td
∆Prh
Fig. 4. Variations in hourly precipitation extremes (1Prh, that is, average over 95th, 99th, 99.5th percentiles) (blue dots)) compared to
changes in dew point temperature for heavy precipitation days (with hourly precipitation exceeding the 90th percentile) (red dots) and all days (black dots). Anomalies in dew point temperature are multiplied by 14 % per degree in order to compare the time variations in dew point temperature with those in precipitation intensity. Grey bands are 98 % error estimates of1Prh.
point temperature 1Td are very similar, although on the
inter-decadal time scale there are differences (Supplement, Sect. e). The long-term trend in1Tdis approximately equal
to the trend in the mean temperature, consistent with the hy-pothesis of a constant relative humidity as climate changes. Thus the long term temperature trend is accompanied with a similar trend in dew point temperature, which on the longer term is reflected in the dew point temperatures when intense showers occur.
5 Summary and discussion
The dependency of hourly precipitation extremes on near surface humidity (as measured by the dew point temperature) is investigated in data from the Hong Kong Observatory, in comparison with data from the Netherlands. A dependency of hourly precipitation extremes of 14 % per degree is ob-tained for dew point temperature up to 23◦C. It is striking
that very similar results are obtained for both the Netherlands and Hong Kong for dew point temperatures between 12 and 22◦C, in spite of the large difference in climate.
Depen-dencies of hourly precipitation extremes on the daily mean temperature are less consistent in HKO and NL. Both show a super C-C scaling for temperatures up to 24◦C, and a rapid
decrease for higher temperatures.
For dew point temperature above 23◦C, which mainly
oc-cur in the time series from Hong Kong, extreme hourly pre-cipitation does not increase further with (near surface) hu-midity. The reason for this limit is unclear, but could be related to constraints in the micro-physical processes in the convective cloud. Nevertheless, this shows that the premise that a temperature rise, and the resulting humidity rise, leads to increases in precipitation extremes is not necessarily true for the (sub)tropics. This result, obtained from a long time series at one station, contrasts with the large sensitivities of daily precipitation extremes to the sea surface temperature,
exceeding the C-C relation, obtained from averaging satel-lite observations over large areas in the tropics (Allan et al., 2010). A number of global climate models also project changes in precipitation extremes over the tropics exceed-ing the C-C relation, but the spread in global climate model simulations is also large due to contrasting dynamical re-sponses (O’Gorman and Schneider, 2009; Gastineau and So-den, 2009; Allan et al., 2010; Sugiyama et al., 2010). Finally, two studies with a cloud resolving model for the tropics ob-tained changes in precipitation extremes roughly following the C-C relation (Muller et al., 2011; Romps, 2011). Clearly further research is needed to resolve these differences.
Long-term variations on an inter-decadal to centennial time scale in hourly precipitation extremes are consistent with the above scaling. For the De Bilt (the Netherlands), long-term variations in precipitation extremes in the summer halve of the season can be well explained by changes in sur-face dew point temperatures following a dependency of 10– 14 % per degree. For Hong Kong, a correspondence between precipitation extremes and dew point temperature could not be established for the wet season May to September, con-sistent with the finding of a zero-dependency of the precip-itation intensity for high dew point temperatures. The rea-son for the observed increase therefore remains unclear, but could be related to urbanization or changes in the strength of the summer monsoon. For data from October, and Febru-ary until April, trends in precipitation extremes could be explained reasonably well by moisture changes, again with a dependency close to 14 % per degree.
not change, temperature and dew point temperature changes are equal. However, climate models commonly project con-siderable decreases in relative humidity over large continen-tal areas in summer. Yet, there could be a twist here. In an ensemble of regional climate simulations over Europe we typically find 50% smaller spatial variations in the change in dew point temperature compared to the change in tem-perature (see Supplement, Sect. f). Therefore, changes in dew point temperature may well be more robust and better predictable than changes in temperature. Concluding, we think that the change in dew point temperature provides a physically more justifiable and a more robust indicator of the changes in precipitation extremes than the change in absolute temperature.
We emphasize that the different analyses and the different data sources, all reveal similar dependencies of hourly pre-cipitation extremes on near surface humidity. This strength-ens our belief that the found large, 10–14 % per degree, de-pendency of hourly precipitation extremes on humidity is real, and that it may be used as a predictor of the changes in hourly precipitation extremes due to global warming. If the temperature rises 3 degrees – which is the mean of the pro-jected range of 21st century warming according to the sce-narios issued for the Netherlands (van den Hurk et al., 2007) – the Netherlands may therefore face a 50 % increase of the intensity of hourly precipitation extremes. The societal im-pact of such an increase could be substantial, for instance for urban flood management.
For Hong Kong, the rising trend of the temperature is ex-pected to continue in the 21st century (Lee et al., 2011). Out-side the wet season, in particular for spring and autumn, the results shows that climate change could have implications for the occurrence of extreme precipitation in Hong Kong. In the wet season, the influence of future warming on the extreme precipitation is likely more complicated, and may involve other mechanisms than the (local) response of show-ers to increasing atmospheric humidity as discussed in this paper. Further research to understand these mechanisms is clearly needed.
Supplementary material related to this article is available online at:
http://www.hydrol-earth-syst-sci.net/15/3033/2011/ hess-15-3033-2011-supplement.pdf.
Acknowledgements. Financial support from the Dutch project Knowledge for Climate (KfC) to KNMI is gratefully acknowl-edged.
Edited by: L. Pfister
References
Allan, R. P., Soden, B. J., John, V. O., Ingram, W., and Good, P.: Current changes in tropical precipitation, Environ. Res. Lett., 5, 025205, doi:10.1088/1748-9326/5/2/025205, 2010.
Allen, M. R. and Ingram, W. J.: Constraints on the future changes in climate and the hydrological cycle, Nature, 419, 224–232, 2002. Berg, P., Haerter, J. O., Thejll, P., Piani, C., Hagemann, S., and Christensen, J. H.: Seasonal characteristics of the relationship between daily precipitation intensity and surface temperature, J. Geophys. Res., 114, D18102, doi:10.1029/2009JD012008, 2009. Coles, S.: An Introduction to Statistical Modeling of Extreme Val-ues, Springer Series in Statistics, Springer-Verlag, London, 2001. Ding, Y., Wang, Z., and Sun, Y.: Inter-decadal variation of the sum-mer precipitation in East China and its association with decreas-ing Asian summer monsoon. Part I: Observed evidences, Int. J. Climatol., 28, 1139–1161, doi:10.1002/joc.1615, 2008. Emori, S. and Brown, S. J.: Dynamic and thermodynamic change
in mean and extreme precipitation under climate change, Geo-phys. Res. Lett., 32, L17706, doi:10.1029/2005GL023272, 2005. Gastineau, G. and Soden, B. J.: Model projected changes of extreme wind events in response to global warming, Geophys. Res. Lett., 36, L10810, doi:10.1029/2009GL037500, 2009.
Ginn, W.-L., Lee, T.-C., and Chan, K.-Y.: Past and Future Changes in the Climate of Hong Kong, Acta Meteor. Sinica, 24, 163–175, 2010.
Haerter, J. O. and Berg, P.: Unexpected rise in extreme precipitation caused by a shift in rain type?, Nat. Geosci., 2, 372–373, 2009. Haerter, J. O., Berg, P., and Hagemann, S.: Heavy rain intensity
dis-tributions on varying time scales and at different temperatures, J. Geophys. Res., 115, D17102, doi:10.1029/2009JD013384, 2010. Hardwick Jones, R., Westra, S., and Sharma, A.: Observed rela-tionships between extreme sub-daily precipitation, surface tem-perature, and relative humidity, Geophys. Res. Lett., 37, L22805, doi:10.1029/2010GL045081, 2010.
Held, I. M. and Soden, B. J.: Robust Responses of the hydrological cycle to global warming, J. Climate, 19, 5686–5699, 2006. Heywood, G. S. P.: Surface pressure-patterns & weather around the
year in Hong Kong, Technical Memoirs 6, Hong Kong Observa-tory, 19 pp., 1953.
IPCC: Climate Change 2007: The Physical Science Basis. Contri-bution of Working Group I to the Fourth Assessment Report of the Intergovernmental Panel on Climate Change (IPCC), edited by: Solomon, S., Qin, D., Manning, M., Chen, Z., Marquis, M., Averyt, K. B., Tignor, M., and Miller, H. L., Cambridge Univer-sity Press, Cambridge, UK and New York, NY, 2007.
Kishtawal, C. M., Niyogi, D., Tewari, M., Pielke, R. A., and Shep-herd, J. M.: Urbanization signature in the observed heavy rain-fall climatology over India, Int. J. Climatol., 30, 1908–1916, doi:10.1002/joc.2044, 2010.
Lee, T.-C., Leung, W.-M., and Chan, K.-W.: Climatological Nor-mals for Hong Kong 1971–2000, Hong Kong Observatory Tech-nical Note 83, Hong Kong Observatory, 33 pp., 2006.
Lee, T.-C., Chan, K.-Y., and Ginn, W.-L.: Projection of Extreme Temperatures in Hong Kong in the 21st Century, Acta Meteor. Sinica, 25, 1–20, 2011.
Lenderink, G. and van Meijgaard, E.: Increase in hourly precipi-tation extremes beyond expecprecipi-tations from temperature changes, Nat. Geosci., 1, 511–514, doi:10.1038/ngeo262, 2008.
in extreme precipitation caused by a shift in rain type?, Nat. Geosci., 2, p. 373, doi:10.1038/ngeo524, 2009.
Lenderink, G. and van Meijgaard, E.: Linking increases in hourly precipitation extremes to atmospheric temperature and mois-ture changes, Environ. Res. Lett., 5, 025208, doi:10.1088/1748-9326/5/2/025208, 2010.
Lenderink, G., van Ulden, A., van den Hurk, B., and Keller, F.: A study on combining global and regional climate model re-sults for generating climate scenarios of temperature and pre-cipitation for the Netherlands, Clim. Dynam., 29, 157–176, doi:10.1007/s00382-007-0227-z, 2007.
Lenderink, G., van Meijgaard, E., and Selten, F.: Intense coastal rainfall in the Netherlands in response to high sea water temper-atures: analysis of the event of August 2006 from the perspective of a changing climate., Clim. Dynam., 32, 19–33, 2009. Muller, C. J., O’Gorman, P. A., and Back, L. E.:
In-tensification of precipitation extremes with warming in a cloud-resolving model., J. Climate, 24, 2784-2800, doi:10.1175/2011JCLI3876.1, 2011.
O’Gorman, P. A. and Muller, C. J.: How closely do changes in sur-face and column water vapor follow Clausius-Clapeyron scaling in climate change simulations?, Environ. Res. Lett., 5, 025207, doi:10.1088/1748-9326/5/2/025207, 2010.
O’Gorman, P. A. and Schneider, T.: The physical basis for increases in precipitation extremes in simulations of 21st-century climate change, Proc. Nat. Aca. Sci., 106, 14773–14777, 2009. Pall, P., Allen, M., and Stone, D.: Testing the Clausius-Capeyron
constraint on changes in extreme precipitation under CO2
warm-ing, Clim. Dynam., 28, 351–363, 2007.
Romps, D. M.: Response of Tropical Precipitation to Global Warm-ing, J. Atmos. Sci., 68, 123–138, doi:10.1175/2010JAS3542.1, 2011.
Santer, B. D., Mears, C., Wentz, F. J., Taylor, K. E., Gleckler, P. J., Wigley, T. M. L., Barnett, T. P., Boyle, J. S., Br¨uggemann, W., Gillett, N. P., Klein, S. A., Meehl, G. A., Nozawa, T., Pierce, D. W., Stott, P. A., Washington, W. M., and Wehner, M. F.: Identification of human-induced changes in atmospheric mois-ture content, Proc. Nat. Aca. Sci., 104, 15248–15253, 2007. Schneider, T. and O’Gorman, P. A.: Precipitation and its extremes
in changed climates, in Proceedings of Hawaiian Aha Huliko’a Winter Workshop, University of Hawaii, 61–66, 2007.
Shaw, S. B., Royem, A. A., and Riha, S. J.: The relationship be-tween extreme hourly precipitation and surface temperature in different hydroclimatic regions of the U.S., J. Hydrometeorol., 12, 319–325, doi:10.1175/2011JHM1364.1, 2011.
Sherwood, S. C., Ingram, W., Tsushima, Y., Satoh, M., Roberts, M., Vidale, P. L., and O’Gorman, P. A.: Relative humidity changes in a warmer climate, J. Geophys. Res., 115, D09104, doi:10.1029/2009JD012585, 2010.
Sugiyama, M., Shiogama, H., and Emori, S.: Precipitation extreme changes exceeding moisture content increases in MIROC and IPCC climate models, Proc. Nat. Aca. Sci., 107, 571–575, 2010. Trenberth, K. E. and Shea, D. J.: Relationships between precipita-tion and surface temperature, Geophys. Res. Lett., 32, L14703, doi:10.1029/2005GL022760, 2005.
Trenberth, K. E., Dai, A., Rasmussen, R., and Parsons, D.: The changing character of precipitation., B. Am. Meteorol. Soc., 84, 1205–1217, 2003.
Utsumi, N., Seto, S., Kanae, S., Maeda, E. E., and Oki, T.: Does higher surface temperature intensify extreme precipitation?, Geophys. Res. Lett., 38, L16708, doi:10.1029/2011GL048426, 2011.
van den Hurk, B., Tank, A., Lenderink, G., van Ulden, A., van Old-enborgh, G., Katsman, C., van den Brink, H., Keller, F., Bessem-binder, J., Burgers, G., Komen, G., Hazeleger, W., and Drijfhout, S.: New climate change scenarios for the Netherlands, Water Sci. Technol., 56, 27–33, 2007.
Vautard, R., Yiou, P., D’Andrea, F., de Noblet, N., Viovy, N., Cassou, C., Polcher, J., Ciais, P., Kageyama, M., and Fan, Y.: Summertime European heat and drought waves induced by win-tertime Mediterranean rainfall deficit, Geophys. Res. Lett., 34, L07711, doi:10.1029/2006GL028001, 2007.
Willett, K. M., Jones, P. D., Thorne, P. W., and Gillett, N. P.: A comparison of large scale changes in surface humidity over land in observations and CMIP3 general circulation models, Environ. Res. Lett., 5, 025210, doi:10.1088/1748-9326/5/2/025210, 2010. Wong, M. C., Mok, H. Y., and Lee, T. C.: Observed changes in extreme weather indices in Hong Kong, International Journal of Climatology, published online, doi:10.1002/joc.2238, 2010. Xu, M., Chang, C.-P., Fu, C., Qi, Y., Robock, A., Robinson,