www.nat-hazards-earth-syst-sci.net/13/2513/2013/ doi:10.5194/nhess-13-2513-2013
© Author(s) 2013. CC Attribution 3.0 License.
Natural Hazards
and Earth System
Sciences
Anomalies of total column CO and O
3
associated with great
earthquakes in recent years
Y. Cui1,2, J. Du2, D. Zhang1, and Y. Sun2
1School of the Earth Science and Resources, China University of Geosciences, Beijing, 100083, China
2CEA Key Laboratory of Earthquake Prediction (Institute of Earthquake Science), China Earthquake Administration, Beijing, 100036, China
Correspondence to:J. Du ([email protected]) and D. Zhang ([email protected])
Received: 15 December 2012 – Published in Nat. Hazards Earth Syst. Sci. Discuss.: – Revised: 31 July 2013 – Accepted: 15 August 2013 – Published: 9 October 2013
Abstract.Variations of total column CO and O3in the
atmo-sphere over the epicenter areas of 35 great earthquakes that occurred throughout the world in recent years were studied based on the hyper-spectrum data from Atmospheric Infrared Sounder (AIRS). It was found that anomalous increases of CO and/or O3concentrations occurred over the epicenter ar-eas of 12 earthquakes among the 35 studied ones. However, increases in both CO and O3concentrations were found for 6 earthquakes. The O3anomalies appeared in the month when the earthquake occurred and lasted for a few months, whereas CO anomalies occurred irregularly. The duration of CO and O3anomalies related to the earthquakes ranged from 1 to 6 months. The anomalies of CO concentration related to the earthquake can be mainly attributed to gas emission from the lithosphere and photochemical reaction, while the anomalous increases in O3concentration can be mainly due to the trans-port of O3-enriched air and photochemical reaction. How-ever, more work needs to be done in order to understand the mechanism of the CO and O3anomalies further.
1 Introduction
Emissions of Rn, He and greenhouse gases (CO, CO2, CH4, etc) from the fault zones to the atmosphere, especially from the structurally weak zones such as intersections or bends of faults, can be enhanced by the action of tectonic stress. Numerous field investigations in many cosmically active ar-eas have indicated that the faults act as the conduit for mi-gration of terrestrial gases. For example, increases of gas concentrations in groundwater and soil were correlated to
the known crustal vibrations and stress changes (Weinlich et al., 2006; Du et al., 2008; Walia et al., 2009). The correla-tion between 8 yr measurements of radon flux in gravel and hundreds of earthquakes (4.6≥ML≥0) indicated that earth-quakes preferentially occurred in three pull-apart grabens of the Dead Sea rift valley within the time interval of the first 3 days after the start time of 110 Rn anomalies (Steinitz et al., 2003), indicating gas emission from solid earth to the atmosphere during seismic activity. It was summarized that terrestrial gas anomalies, such as Rn, He, H2, Hg and CO2, for the duration of a few hours to dozens of months related to the large earthquakes were found in the areas where the epicentral distances of hundreds of kilometers (larger for larger earthquakes, up to 1000 km or more for magnitude 8), and the amplitude of the anomalies did not show con-sistent correlation with either earthquake magnitude or epi-central distance (King, 1986; King et al., 2006). Moreover, numbers of pre-earthquake anomalies of the thermal, sur-face latent heat flux and outgoing long-wave radiation appar-ently resulted from the earthquake-related gas emission from the lithosphere (Tronin, 2000, 2002; Dey and Singh, 2003; Tronin et al., 2006; Ouzounov et al., 2007).
theMs=6.9 earthquake of 8 June 2000 in northern Myan-mar (Yao et al., 2005). An anomalous variation of the total column water vapor after the Gujarat earthquake was also re-trieved using SSM/I microwave radiometer on Tropical Rain-fall Measuring Mission (TRMM) satellite (Dey et al., 2004). Therefore, this paper aims at extracting the anomalies of total column CO and O3over the epicenters of great earthquakes from AIRS standard products and correlating the anomalies with the earthquakes that occurred in recent years in order to promote the application of hyper-spectrum data in monitor-ing earthquake.
2 Data and methods
2.1 Data
The monthly data from the Atmospheric Infrared Sounder (AIRS) Version 5 Level 3 standard gridded products were selected as interesting. This data set was represented by the Gaussian grid with spatial resolution of 90 km×90 km at nadir, approximately 1◦ (latitude)×1◦ (longitude) on the
earth’s surface and downloaded from the Goddard Earth Sci-ences (GES) Data and Information Services Center (DISC) (http://disc.sci.gsfc.nasa.gov/AIRS/data-holdings) (Aumann et al., 2003; Won, 2008). We have taken the data of earth-quakes from the Center for Earthquake Network of China (http://www.csi.ac.cn/).
2.2 Method
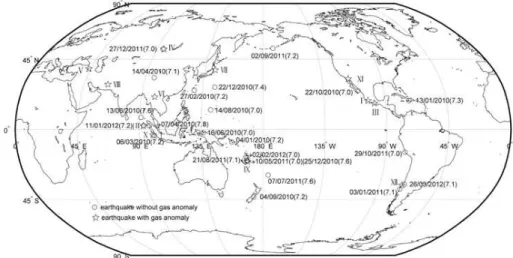
A total of 35 earthquakes withMs≥7.0 and focal depth less than 35 km, which occurred throughout the world from Jan-uary 2010 to August 2012, were selected as interest (Fig. 1). Background values of CO and O3were represented by the mean values that were calculated based on the AIRS data of multiple years by extracting total column CO and O3 data over the epicenter areas of the earthquakes, which is de-scribed by Eq. (1).
Gbac(x, y, t )= 1 N
N X
i=1
Gi(x, y, t ) (1)
concentrations in the year (Gmon) and background value (Gbac)of the corresponding month and comparing the im-ages over the epicentral area before and after a seismic event in order to find the CO or O3 anomalies. The value of1G was calculated by Eq. (2). The anomalies were identified by 1G >σ¯.
1G(x, y)=Gmon(x, y)−Gbac(x, y) (2)
3 Results and discussion
Increases in 1G of CO (1GCO) and1G of O3 (1GO3) before and after 12 earthquakes were found (Fig. 1). The parameters of earthquakes and the general features of gas anomalies are described in Table 2. The anomaly intensities of1GCOand1GO3 for one pixel related to 12 earthquakes ranged from 1.48×10¹⁷to 2.79×10¹⁷molecules cm−2and from 28 to 68 DU, respectively. The largest values of1GCO and 1GO3 were found in the month and one month after the 5 April 2010 Baja California earthquake in Mexico oc-curred, respectively. The durations of the O3and CO anoma-lies ranged from 1 to 6 months and 1 to 4 months, respec-tively. The areas of the gas anomalies had a wide range of more than 1000 km2.
3.1 Anomalies of CO concentration
The anomalies of CO concentration observed before and af-ter the great earthquakes can mainly be attributed to gas emission, photochemical oxidation, as well as 14N(np) de-cay.
Fig. 1.Epicenter distributions of the 35 studied earthquakes. Arabic numerals are dates in day/month/year and magnitude in brackets. Roman numerals are numbers of earthquake with gas anomaly as shown in Table 2.
Table 1.Mean standard deviation of CO (1016molecules cm−2)and O3(DU) in every month.
Jan Feb Mar Apr May Jun July Aug Sep Oct Nov Dec
¯
σco 5.8 6.4 6.3 5.8 5.2 5.0 4.9 5.4 6.6 7.9 6.9 5.7
¯
σO3 15 17 16 14 13 12 13 13 12 14 16 15
Note:σ¯is mean standard deviation of the whole globe.
demonstrated that the active fault zones were the preferential pathways for upward migration of gases in the solid earth (King et al., 2006). Variations both in nitric oxide (Matsuda and Ikeya, 2001) and atmospheric Rn concentration (Yasuka et al., 2006) prior to the January 1995 Kobe earthquake indi-cated gases emitted from the crust in the epicentral area. In addition, higher values of CO concentrations deduced from MOPITT satellite at the levels of 1000 and 850 hPa one week prior to the 26 January 2001 GujaratMs=7.6 earthquake were found (Singh et al., 2010a). In the studied cases, obvi-ous anomalies of CO concentration along the San Andreas Fault in March and April associated with the 5 April 2010 Baja CaliforniaMs=7.1 earthquake (Fig. 2a) indicated that the CO anomalies mainly resulted from the emission of CO and CH4from the fault zone. Meanwhile O3increased, but did not distribute along the fault (Fig. 2b), which indicated that the high values of O3concentration could not be directly attributed to O3emission.
Additionally, the CO in the atmosphere can be produced by methane oxidation. Oxidation of CH4by OH in the at-mosphere occurs under the condition of OH radical concen-trations of the order of 2.3×10⁶molecule cm−3, resulting in the increase of CO concentration. The photochemical oxida-tion chain is described by Eq. (3) (Fishman et al., 1979; Fish-man and Seiler, 1983). Both anomalies of CO concentration and land surface temperature prior to many earthquakes, e.g., the 26 January 2001 GujaratMs=7.6 earthquake (Singh et
al., 2010a), the 6 June 2000 JingtaiMs=5.9 earthquake in Gansu Province, northwestern China (Yao et al., 2005), the Ms=6.9 earthquake of 8 June 2000 in northern Myanmar (Yao et al., 2005) and the 15 January 2001 TaiwanMs=7.5 earthquake (Guo et al., 2006), were reported. Therefore, the photochemical oxidation of optically active gases (CH4, CO2, O3, etc.) from the solid earth was considered as one of the mechanisms of thermal and chemical anomalies (Tronin, 2006).
CH4+4O2+2hv1+hv2→H2O+CO+H2+2O3 (3) Furthermore, radiation reaction of 14N is likely another source of CO. The ionospheric perturbations resulted from a modification of the atmospheric electric field during the earthquake preparation (Trigunait et al., 2004), which may cause air ionization. The air ionization can stimulate the14N decay to produce14C. Consequently,14C is first fixed as CO before being converted into CO2(Pandow et al., 1960; Dabas et al., 2007):
n+14N→14C+H (4)
214C+O2→214CO (5)
CO+2O2→CO2+O3. (6)
X 25/10/2010 Kepulauan Mentawai region, Indonesia −3.5 100.0 10 7.3 – 31 – – – 6 XII 05/04/2010 Baja California, Mexico 32.3 −115.1 33 7.1 2.79 62 2 1 1 3 1 2 XIII 27/02/2010 Offshore Bio-Bio, Chile −35.8 −72.7 22 8.8 – 44 1 – – 2 1
Note: data of earthquakes from center for earthquake network of China; total column CO (1017molecules cm−2)and total column O3(DU) from Atmospheric Infrared Sounder. 1 Dobson unit (DU) is about 2.7×10¹⁶molecules cm−2. Max. of1GCOand Max. of1GO3stand for the anomaly intensities of1GCOand1GO3for one pixel, respectively. B, W and A stand for before, when and after the earthquake, respectively.
Fig. 2.Distributions of1GCO(A)and1GO3(B)associated with 5 April 2010 Baja California earthquake from February to May 2010, red star stands for the epicenter, CO unit: mole cm−2, O
3unit: DU.
were measured respectively by MOPITT and TOMS (Singh et al., 2010a; Tronin, 2002). The anomalies of both CO and O3concentrations have been found for six earthquakes among the studied cases (Table 2).
3.2 Anomalies of O3concentration
Anomalies of O3concentration in the atmosphere can be at-tributed to photochemical reaction, gas emission and convec-tion in the atmosphere.
The anomalies of atmospheric O3 may be derived from the photochemical production of the gases (vapor, CH4and CO) emitted from the lithosphere (Crutzen, 1974). The pho-tochemical oxidation reactions of CH4and CO are described by Eqs. (3) and (6) (Fishman et al., 1979).
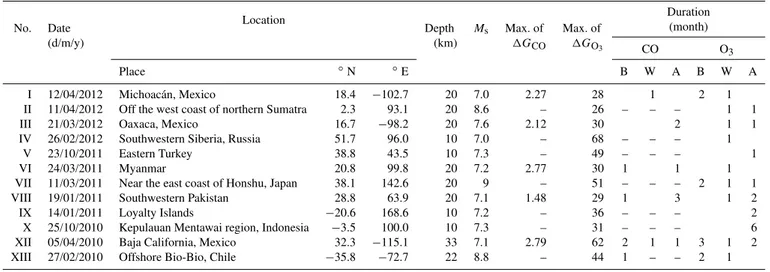
Fig. 3. Distributions of1GO3associated with 25 October 2010 Indonesia earthquake from September 2010 to April 2011, red star stands for the epicenter, unit: DU.
different amounts of O3, and rhyolite produced the strongest O3emission. This suggests that O3emission from fracturing rocks can serve as an indicator of impending earthquake.
Moreover, the anomaly of O3concentration can be caused by the transport of enriched-O3 air from higher latitudes. Advection of gaseous compounds of nitrogen oxides (NOx) from the neighboring high-pressure regions where the earth-quake occurred and the atmospheric pressure is intensively low may contribute to the anomalies of O3 concentration (Ganguly, 2009). Meanwhile, the heat energy can be trans-mitted from the surface to the upper layers during the pro-cess of earthquake activities in the region of low atmospheric pressure that was created by gravity waves (Pal, 2002). Therefore, the convection favors the formations of O3 con-centration and surface air temperature anomalies.
3.3 Case study
3.3.1 Earthquakes without anomalies
No CO or O3 anomalies were found for 23 earthquakes among the 35 cases (Table 2), which can result from the fol-lowing factors: the sensitivity of the sensor was not sensitive enough to measure the minor changes of gas concentrations, the data were affected by thick cloud, and/or there were no anomalies at all.
3.3.2 Earthquakes only with O3anomalies
Just 6 cases among the studied earthquakes were with O3 anomalies. High O3 anomalies mostly appeared in the month when the earthquake occurred and a few months af-ter the event, e.g., the 25 October 2010 Indonesia earth-quake (Fig. 3), which could result from dynamical transport (Kondratyev and Varotsos, 2001) and photochemical reac-tion caused by the earthquake generareac-tion. The anomaly of O3concentration was found in the week that the Haiti earth-quake of 12 January 2010 occurred (Singh et al., 2010b).
3.3.3 Earthquakes with both CO and O3anomalies
2008–2009 in the epicenter area of 5 April 2010 Baja California earthquake.
of photolysis and OH radical production in the troposphere, which consequently changes the concentrations of CO, O3 and other trace gases (Fishman et al., 1979; Fishman and Seiler, 1983; Yurganov et al., 1995; Varotsos et al., 2001; Kato et al., 2004).
In addition, O3 anomalies are well correlated with CO ones when photochemical oxidations of CH4 occurred (Yurganov et al., 1995; Kato et al., 2004). For instance, the varied trend of differences of CO and O3concentrations be-tween 8-day mean value of CO in 2010 and the correspond-ing 8-day mean values of 2008–2009 in the epicenter area of the 5 April 2010 Baja CaliforniaMs=7.1 earthquake ap-peared concordant. Higher values of CO and O3differences were found 2 months before the earthquake, and then de-clined sharply to the mean values 1 month after the earth-quake (Fig. 4). Such phenomena indicate that photochemi-cal oxidation reaction of CH4and CO produces CO and O3 (Eqs. 3 and 6), which resulted in the increases of CO and O3 concentrations in the atmosphere.
4 Summary
Among the 35 studied earthquakes, 6 earthquakes were found to be with both CO and O3 anomalies, and 6 earth-quakes just with O3anomalies. The beginnings and durations of CO and O3anomalies were different from case to case.
The anomaly of CO concentration related to the earth-quake can be attributed to the gas emission from the solid earth, photochemical oxidation and14N(np) decay, while O
3 anomalies to transport of O3-enriched air, photochemical re-action and O3emission from fracturing rocks. Gas emission from the fissures that were produced by tectonic stress in the lithosphere during the earthquake generation and occur-rence resulted in the increases of CO and O3concentrations in the atmosphere. In addition, atmospheric electric field changes and ionospheric disturbances related to earthquake
and to acknowledge NASA for making AIRS data available to the user community. Earthquake data are provided by the Center for Earthquake Network of China.
Edited by: O. Katz
Reviewed by: A. A. Tronin and R. P. Singh
References
Aumann, H. H., Chahine, M. T., Gautier, C., Goldberg, M. D., Kalnay, E., Mcmilin, L. M., Revercomb, H., Rosenkranz, P. W., Smith, W. L., Staelin, D. H., Strow, L. L., and Susskind, J.: AIRS/AMSU/HSB on the Aqua mission: Design, science ob-jectives, data products and processing system, IEEE T. Geosci. Remote, 41, 253–264, 2003.
Baragiola, R. A., Dukes, C. A., and Hedges, D.: Ozone generation by rock fracture: Earthquake early warning?, Appl. Phys. Lett., 99, 204101, doi:10.1063/1.3660763, 2011.
Crutzen, P. J.: Photochemical reactions initiated by and influencing ozone in unpolluted tropospheric air, Tellus, 26, 47–57, 1974. Dabas, R. S., Das, R. M., Sharma, K., and Pillai, K. G. M.:
Iono-spheric precursors observed over low latitudes during some of the recent major earthquakes, J. Atmos. Sol-Terr. Phy., 69, 1813– 1824, 2007.
Dey, S. and Singh, R. P.: Surface latent heat flux as an earth-quake precursor, Nat. Hazards Earth Syst. Sci., 3, 749–755, doi:10.5194/nhess-3-749-2003, 2003.
Dey, S., Sarkar, S., and Singh, R. P.: Anomalous changes in column water vapor after Gujarat earthquake, Adv. Space Res., 33, 274– 278, 2004.
Du, J., Si, X., Chen, Y., Fu, H., and Jian, C.: Geochemical anoma-lies connected with great earthquakes in China, in: Geochemistry Research Advances, edited by: Stefánsson, Ó., New York: Nova Science Publishers, Inc., 57–92, 2008.
Fishman, J. and Seiler, W.: Correlative nature of ozone and carbon monoxide in the troposphere: implications for the tropospheric ozone budget, J. Geophys. Res., 88, 3662–3670, 1983.
Fishman, J., Solomon, S., and Crutzen, P. J.: Observational and the-oretical evidence in support of a significant in-situ photochemical source of tropospheric ozone, Tellus, 31, 432–446, 1979. Ganguly, N. D.: Variation in atmospheric ozone concentration
Guo, G. M., Cao, Y. G., and Gong, J. M.: Monitoring anomaly be-fore earthquake with MODIS and MOPITT data, Adv. Earth Sci., 2, 695–698, 2006.
Kato, S., Kajii, Y., and Itokazu, R.: Transport of atmospheric car-bon monoxide, ozone, and hydrocarcar-bons from Chinese coast to Okinawa Island in the Western Pacific during winter, Atmos. En-viron., 38, 2975–2981, 2004.
King, C. Y.: Gas geochemistry applied to earthquake prediction: An overview, J. Geophys. Res., 91, 12269–12281, 1986.
King, C. Y., Zhang, W., and Zhang, Z. C.: Earthquake-induced groundwater and gas changes, Pure Appl. Geophys., 163, 633– 645, 2006.
Kondratyev, K. Y. and Varotsos, C. A.: Global tropospheric ozone dynamics. Part I: Tropospheric ozone precursors, Part II: Numer-ical modelling of tropospheric ozone variability, Environ. Sci. Pollut. R., 8, 57–62, 2001.
Matsuda, T. and Ikeya, M.: Variation of nitric oxide concentra-tion before the Kobe earthquake,Japanese, Atmos. Environ., 35, 3097–3102, 2001.
Ouzounov, D., Liu, D. F., Kang, C. L., Cervone, G., Kafatos, M., and Taylor, P.: Outgoing long wave radiation variability from IR satellite data prior to major earthquakes, Tectonophysics, 431, 211–220, 2007.
Pal, D.: Extension of Aravalli basement below Garhwal Himalaya and its geological control over the occurrences of Natural Haz-ards in Uttaranchal State, National Seminar on Geodynamics and environment management of Himalaya, Department of Geology, H. N. B. University, Uttranchal, India, 2002.
Pandow, M., Mackay, C., and Wolfgang, R.: The reaction of atomic carbon with oxygen: significance for the natural radio-carbon cy-cle, J. Inorg. Nucl. Chem., 14, pp. 153–158, 1960.
Singh, R. P., Cervone, G., Singh, V. P., and Kafatos, M.: Generic precursors to coastal earthquakes: Inferences from Denali fault earthquake, Tectonophysics, 431, 231–240, 2007.
Singh, R. P., Kumar, S.J., Zlotnicki, J., and Kafatos, M. K.: Satel-lite detection of Carbon monoxide emission prior to the Gujarat earthquake of 26 January 2001, Appl. Geochem., 25, 580–585, 2010a.
Singh, Ramesh P., Waseem Mehdi, and Manish Sharma: Comple-mentary nature of surface and atmospheric parameters associ-ated with Haiti earthquake of 12 January 2010, Nat. Hazards Earth Syst. Sci., 10, 1299–1305, doi:10.5194/nhess-10-1299-2010, 2010b.
Steinitz, G., Begin, Z. B., and Gazit-Yaari, N.: Statistically signif-icant relation between radon flux and weak earthquakes in the Dead Sea rift valley, Geol., 31, 505–508, 2003.
Trigunait, A., Parrot, M., Pulinets, S., and Li, F.: Variations of the ionospheric electron density during the Bhuj seismic event, Ann. Geophys., 22, 4123–4131, doi:10.5194/angeo-22-4123-2004, 2004.
Tronin, A. A.: Thermal IR satellite sensor data application for earth-quake research in China, Int. J. Remote Sens., 21, 3169–3177, 2000.
Tronin, A. A.: Atmosphere–litosphere coupling, Thermal anoma-lies on the Earth surface in seismic processes, in: Seismo Elec-tromagnetics: Lithosphere–Atmosphere–Ionosphere Coupling, edited by: Hayakawa, M. and Molchanov, O. A., Terrapub, Tokyo, 173–176, 2002.
Tronin, A. A.: Remote sensing and earthquakes: A review, Phys. Chem. Earth, 31, 138–142, 2006.
Varotsos, C., Kondratyev, K. Y., and Efstathiou, M.: On the sea-sonal variation of the surface ozone in Athens, Greece, Atmos. Environ., 35, 315–320, 2001.
Walia, V., Yang, T. F., Hong, W. L., Lin, S. J., Fu, C. C., Wen, K. L., and Chen, C. H.: Geochemical variation of soil–gas com-position for fault trace and earthquake precursory studies along the Hsincheng fault in NW Taiwan, Appl. Radiat. Isotopes, 67, 1855–1863, 2009.
Weinlich, F. H., Faber, E., Boušková, A., Horálek, J., Teschner, M., and Poggenburg, J.: Seismically induced variations in Mariánské Láznˇe fault gas composition in the NW Bohemian swarm quake region, Czech Republic-A continuous gas monitoring, Tectono-physics, 421, 89–110, 2006.
Won, Y. I.: README Document for AIRS Level-3 Version 5 Stan-dard Products: Daily (AIRH3STD, AIRX3STD, AIRS3STD) 8-days (AIRH3ST8, AIRX3ST8, AIRS3ST8) & Monthly (AIRH3STM, AIRX3STM, AIRS3STM), 2008.
Yao, Q. L., Qiang, Z. J., and Wang, Y. P.: CO Release from the Tibetan plateau before earthquake and increasing temperature anomaly showing in thermal infrared images of satellite, Adv. Earth Sci., 20, 505–510, 2005.
Yasuka, Y., Igarashi, G., Ishikawa, T., Tokonami, S., and Shinogi, M.: Evidence of precursor phenomena in the Kobe earth-quake obtained from atmospheric radon concentration, Appl. Geochem., 21, 1064–1072, 2006.