________________________________________ 1
Licenciado em Matemática, Prof. Doutor, UNESP, Câmpus de Tupã - SP, e Faculdade de Ciências Agronômicas, UNESP, Botucatu - SP, Fone: (0XX14) 3404-4200, [email protected].
2
Licenciada em Matemática, Profa. Assistente, FATEC, Presidente Prudente - SP, Fone: (0XX18) 39167887, [email protected]
3
Graduando em Administração, UNESP, Câmpus de Tupã - SP, [email protected]
4
Médico Veterinário, Prof. Doutor, UNOESTE, Presidente Prudente - SP, Fone: (0XX18) 3229-2000, [email protected]. Recebido pelo Conselho Editorial em: 5-8-2010
SLAUGHTERING
LUÍS R. A. GABRIEL FILHO1, CAMILA P. CREMASCO2, FERNANDO F. PUTTI3, MARCELO G. M. CHACUR4
ABSTRACT: The fuzzy logic admits infinite intermediate logical values between false and true. With this principle, it developed in this study a system based on fuzzy rules, which indicates the body mass index of ruminant animals in order to obtain the best time to slaughter. The controller developed has as input the variables weight and height, and as output a new body mass index, called
Fuzzy Body Mass Index (Fuzzy BMI), which may serve as a detection system at the time of
livestock slaughtering, comparing one another by the linguistic variables "Very Low", "Low", "Average ", "High" and "Very High". For demonstrating the use application of this fuzzy system, an analysis was made with 147 Nellore beeves to determine Fuzzy BMI values for each animal and indicate the location of body mass of any herd. The performance validation of the system was based on a statistical analysis using the Pearson correlation coefficient of 0.923, representing a high positive correlation, indicating that the proposed method is appropriate. Thus, this method allows the evaluation of the herd comparing each animal within the group, thus providing a quantitative method of farmer decision. It was concluded that this study established a computational method based on fuzzy logic that mimics part of human reasoning and interprets the body mass index of any bovine species and in any region of the country.
KEYWORDS: corporal index, controlling mass fuzzy, quantitative method.
APLICAÇÃO DA LÓGICA FUZZY PARA AVALIAÇÃO NO ABATE DE REBANHOS BOVINOS
RESUMO: A lógica fuzzy admite infinitos valores lógicos intermediários entre o falso e o verdadeiro. Com esse princípio, foi elaborado neste trabalho um sistema baseado em regras fuzzy, que indicam o índice de massa corporal de animais ruminantes com objetivo de obter o melhor momento para o abate. O sistema fuzzy desenvolvido teve como entradas as variáveis massa e altura, e a saída um novo índice de massa corporal, denominado Índice de Massa Corporal Fuzzy (IMC Fuzzy), que poderá servir como um sistema de detecção do momento de abate de bovinos, comparando-os entre si através das variáveis linguísticas “Muito Baixa”, “Baixa”, “Média”, “Alta” e “Muito Alta”. Para a demonstração e aplicação da utilização deste sistema fuzzy, foi feita uma
análise de 147 vacas da raça Nelore, determinando os valores do IMC Fuzzy para cada animal e indicando a situação de massa corpórea de todo o rebanho. A validação realizada do sistema foi baseado em uma análise estatística, utilizando o coeficiente de correlação de Pearson 0,923, representando alta correlação positiva e indicando que o método proposto está adequado. Desta forma, o presente método possibilita a avaliação do rebanho, comparando cada animal do rebanho com seus pares do grupo, fornecendo desta forma um método quantitativo de tomada de decisão para o pecuarista. Também é possível concluir que o presente trabalho estabeleceu um método computacional baseado na lógica fuzzy capaz de imitar parte do raciocínio humano e interpretar o índice de massa corporal de qualquer tipo de espécie bovina e em qualquer região do País.
INTRODUCTION
Body mass index (BMI) is a parameter that can be estimated for any animal and is obtained by the ratio Mass/(Height)² (CHACUR et al., 2007). This parameter is also deserving of great prominence in the selection of breeding bulls within lots with homogeneous body mass index (BMI), proving to be effective when combined with qualitative and quantitative characteristics of semen in Nellore males of high fertility (SANCHEZ, 2004).
Another key association of BMI is on the meat quality at the time of slaughtering the animal, being a major variable in the decision of the farmer for a general evaluation of the herd.
The use of fuzzy logic in problems of assessing agricultural, biological and administrative phenomena is becoming an extremely efficient and effective alternative to recurrent stochastic methods. Applications in management of energy use (CREMASCO, 2008), characterization of the productive environment in springers (PANDORFI, 2007), and estimation of springers comfort (PEREIRA et al., 2008) comprise the various applications that this theory-based mathematical and computational intelligence method is able to cover.
Applications in problems involving imprecision, as knowledge on the state of the animal with FMD in cattle were studied in (MELO & CASTANHO, 2006) to assist the veterinarian with disease diagnose. BRANDL-BROWN et al. (2005) tested five simulation models of well being in 128 female calves, being two statistical regression models, two models of fuzzy inference and a neural network model. Studies using fuzzy logic in cattle also were studied by PANDORFI et al. (2007) relating the thermal comfort and physiological parameters in dairy cattle.
Fuzzy logic provides for the development of genetic algorithms, which are able to mimic part
of the human reasoning. These methods are synthesized by creating a computer program based on rules created from this logic, the so-called fuzzy rule-based system.
This theory, which seeks to apply mathematics to diffuse concepts, was introduced by Lotfi Asker Zadeh in 1965, aiming at approximating the human reasoning by fuzzy sets, also described by linguistic variables (ZADEH, 1965).
The objective of this work is to develop a rule-based fuzzy system for assessing body condition of cattle herds, thus establishing a new body mass index for these animals, which it was called Fuzzy Body Mass Index (Fuzzy BMI).
MATERIAL AND METHODS
Data collection of this experimental work was carried out in a farm located in Santa Rita do Pardo, state of Mato Grosso do Sul, and used 147 Nellore beeves varying from 5 to 7 years old.
Information on the animals was composed of three data sets, identified by "Mass" (in kilograms), "Height" (in meters) and "BMI" (body mass index in kg/m²). For an appropriate description of the variables, a descriptive analysis of this data was performed by creating box plot graphs and also determining the quartiles of these groups. It is noteworthy that BMI was calculated from the relationship:
2 Height
M ass
BM I (1)
FIGURE 1. Proposed system based on fuzzy rules for cattle.
The input variables of the proposed fuzzy rule-based system were "mass" and "height" of the animals. For each variable five pertinence functions were defined and called "Very Low" (VL), "Low" (L), "Medium" (M), "High" (H) and "Very High" (VH), as defined according to Table 1 and Figure 2, in which the quartiles of the data groups are represented by Q1, Q2 and Q3, as well as the use of maximum and minimum values, and the lower and upper limits defined by numbers respectively below or above the minimum and maximum, allowing the use of the system even for other animals that were not evaluated.
TABLE 1. Definition of pertinence functions of input variables.
Fuzzy System Type Delimitation
“Very Low” (VL) Trapezoidal [ Lower limit - 1, Lower Limit, Minimum, Q1 ] “Low” (L) Triangular [ Minimum, Q1, Q2 ]
“Medium” (M) Triangular [ Q1, Q2, Q3 ]
“High” (H) Triangular [ Q2, Q3, Maximum ]
“Very High” (VH) Trapezoidal [ Q3, Maximum, Upper Limit, Upper Limit + 1 ]
FIGURE 2. Pertinence functions defined for fuzzy sets of the input variable. Mass (kg) Heigh (m)
IMC Fuzzy
The output variable of the fuzzy system was called fuzzy body mass index (Fuzzy BMI), generating a real number in the interval [0.1]. The pertinence functions of this variable had the same names of the functions of the input variable and were all of the triangular type, and sets of VH and VL were represented by support roles 0.25 and the sets L, M and H presented support 0.5, according to Table 1 and Figure 2.
TABLE 2. Definition of pertinence functions of the input variable.
Fuzzy System Type Delimitation
“Very Low” (VL) Triangular [ -1; 0; 0.25 ] “Low” (L) Triangular [ 0; 0.25; 0.5 ] “Medium” (M) Triangular [ 0.25; 0.5; 0.75 ]
“High” (H) Triangular [ 0.5; 0.75; 1 ] “Very High” (VH) Triangular [ 0.75; 1; 2 ]
FIGURE 3. Pertinence functions defined for fuzzy sets of the output variable Fuzzy BMI.
To reach the fuzzy base rules, we considered the 25 (5 5) combinations of fuzzy sets of two input variables. The classification of each combination was done by calculating the values of body mass index (
Mass/Height2) of points with a degree of pertinence to each fuzzy set considered, and for the sets VH and VL we used, respectively, the highest and lowest points of input variables, thus creating 25 pairs of the form
Mass,Height
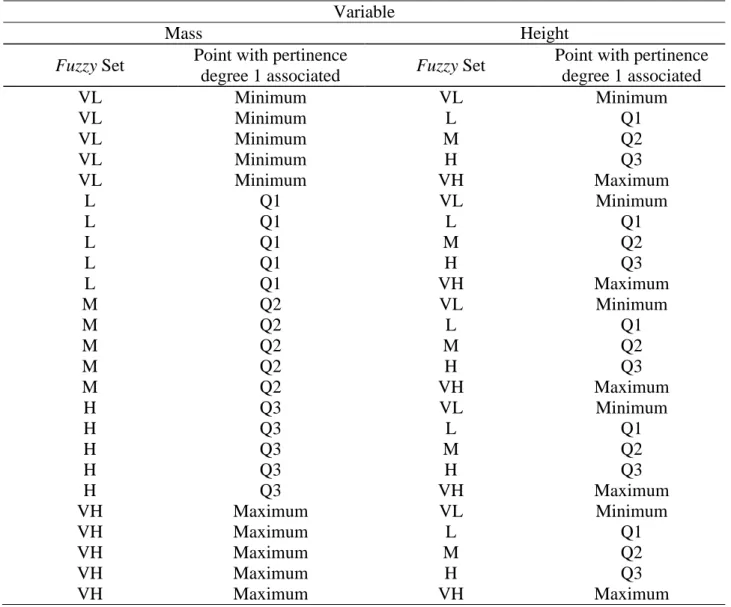
TABLE 3. Combinations of input variables with points of 1 degree of pertinence associated to fuzzy sets to generate the Rule Base.
Variable
Mass Height
Fuzzy Set Point with pertinence
degree 1 associated Fuzzy Set
Point with pertinence degree 1 associated
VL Minimum VL Minimum
VL Minimum L Q1
VL Minimum M Q2
VL Minimum H Q3
VL Minimum VH Maximum
L Q1 VL Minimum
L Q1 L Q1
L Q1 M Q2
L Q1 H Q3
L Q1 VH Maximum
M Q2 VL Minimum
M Q2 L Q1
M Q2 M Q2
M Q2 H Q3
M Q2 VH Maximum
H Q3 VL Minimum
H Q3 L Q1
H Q3 M Q2
H Q3 H Q3
H Q3 VH Maximum
VH Maximum VL Minimum
VH Maximum L Q1
VH Maximum M Q2
VH Maximum H Q3
VH Maximum VH Maximum
These calculated BMI values of the points with associated 1 degree of pertinence were classified with the output variable of the fuzzy sets. For this, the percentiles were determined at levels of 0% (minimum), 20%, 40%, 60%, 80% and 100% (maximum) of the BMI data group of 147 animals, making a subsequent BMI classification of the points with 1 degree of pertinence, according to the following convention, featuring the basis of the fuzzy rules:
- If
BMIP(20%) then FuzzyBMI is “Very Low” (VL);
- If
P(20%)BMIP(40%) then FuzzyBMI is “Low” (L);
- If
P(40%)BMI P(60%) then FuzzyBMI is “Medium” (M);
- If
P(60%)BMIP(80%) then FuzzyBMI is “High” (H);
- If
BMIP(80%) then FuzzyBMI is “Very High” (VH).
where P(x%) represents the percentile at the x% of the data set of BMI calculated values of the 147 animals.
The validation of this system based on fuzzy rules was made for all animals by determining the fuzzy body mass index (FBMI) and calculating the Pearson correlation coefficient between this group of data and BMI values of the animals.
With the help of the tool Fuzzy Logic Toolbox of MATLAB® 7.0 software, Copyright 1984-2004 The MathWorks Inc., it was possible to computationally create a system based on fuzzy rules, and also to determine a surface and a contour map representing the system.
RESULTS AND DISCUSSION
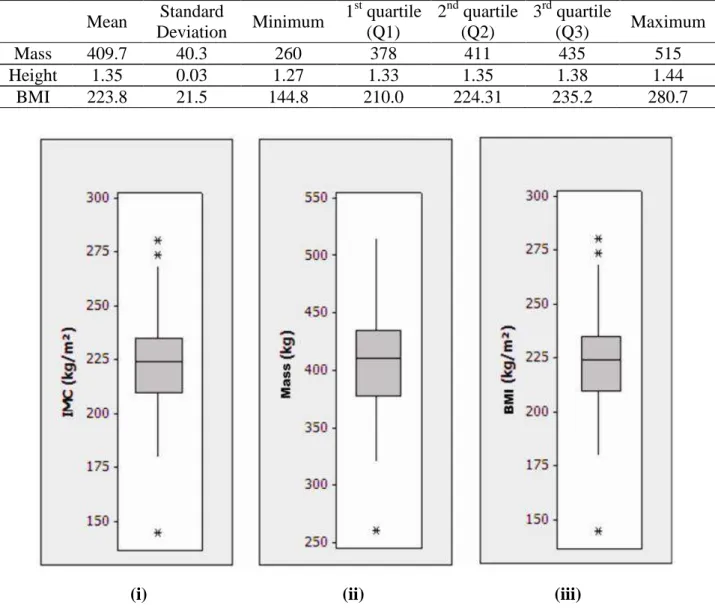
Descriptive statistical analysis of information on the analyzed animals for mass (kg), height (m) and body mass index (kg/m²) can be seen in Table 3 and Figure 4.
TABLE 4. Descriptive analysis of data for Mass, Height and BMI of the animals in this study.
(i) (ii) (iii)
FIGURE 4. Box plot of data sampling for (i) Mass, (ii) Height and (iii) BMI of the animals.
Using the minimum, maximum and quartiles values in Table 3, it was possible to build pertinence functions of the fuzzy sets for input variables, as shown in Figures 5 and 6.
Mean Standard
Deviation Minimum
1st quartile (Q1)
2nd quartile (Q2)
3rd quartile
(Q3) Maximum
Mass 409.7 40.3 260 378 411 435 515
Height 1.35 0.03 1.27 1.33 1.35 1.38 1.44
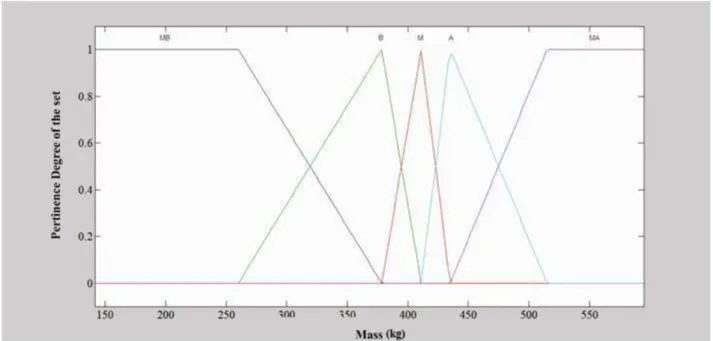
FIGURE 5. Pertinence functions of fuzzy sets for the input variable Mass.
FIGURE 6. Pertinence functions of fuzzy sets for the input variable Height.
The establishment of the rules of the fuzzy system can be structured with the percentile data of Table 4.
TABLE 4. Percentile values of BMI data from the animals in this study.
20th percentile P(20%)
40th percentile P(40%)
60th percentile P(60%)
80th percentile P(80%)
BMI 207.2 216.9 227.3 242.8
- If
BMI 207.2 then FuzzyBMI is is “Very Low” (VL);
- If 207.2
BMI 216.9 then FuzzyBMI is “Low” (L);
- If 216.9
BMI 227.3 then FuzzyBMI is “Medium” (M);
- If 227.3
BMI 242.8 then FuzzyBMI is “High” (H);
- If
BMI 242.8 then FuzzyBMI is “Very High” (VH).
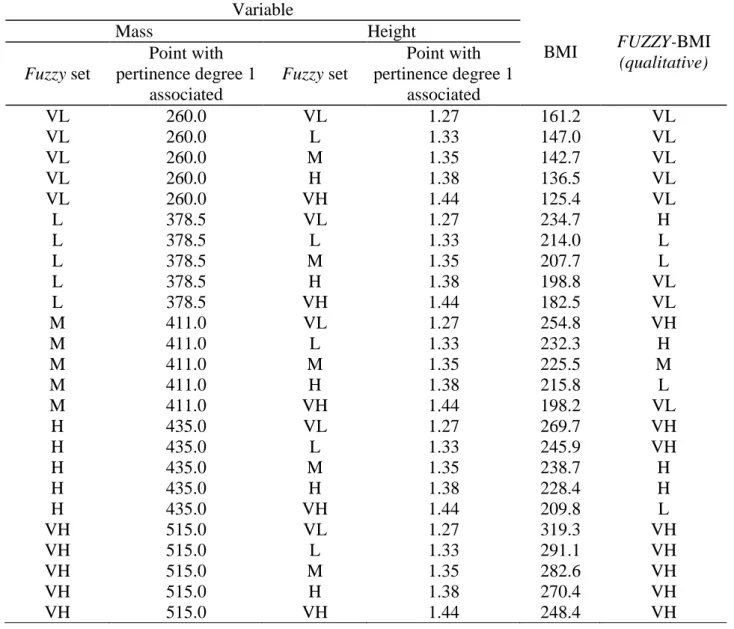
TABLE 5. Rule base of the system based on fuzzy rules.
Variable
BMI FUZZY-BMI
(qualitative)
Mass Height
Fuzzy set
Point with pertinence degree 1
associated
Fuzzy set
Point with pertinence degree 1
associated
VL 260.0 VL 1.27 161.2 VL
VL 260.0 L 1.33 147.0 VL
VL 260.0 M 1.35 142.7 VL
VL 260.0 H 1.38 136.5 VL
VL 260.0 VH 1.44 125.4 VL
L 378.5 VL 1.27 234.7 H
L 378.5 L 1.33 214.0 L
L 378.5 M 1.35 207.7 L
L 378.5 H 1.38 198.8 VL
L 378.5 VH 1.44 182.5 VL
M 411.0 VL 1.27 254.8 VH
M 411.0 L 1.33 232.3 H
M 411.0 M 1.35 225.5 M
M 411.0 H 1.38 215.8 L
M 411.0 VH 1.44 198.2 VL
H 435.0 VL 1.27 269.7 VH
H 435.0 L 1.33 245.9 VH
H 435.0 M 1.35 238.7 H
H 435.0 H 1.38 228.4 H
H 435.0 VH 1.44 209.8 L
VH 515.0 VL 1.27 319.3 VH
VH 515.0 L 1.33 291.1 VH
VH 515.0 M 1.35 282.6 VH
VH 515.0 H 1.38 270.4 VH
VH 515.0 VH 1.44 248.4 VH
Table 5 represents the rule basis of the fuzzy system. Thus, for example, the first 3 lines represent the relationship:
- If (the Mass is "Very Low") and (Height is "Very Low") then (Fuzzy BMI is "Very Low");
- If (the Mass is "Very Low") and (Height is "Low") then (Fuzzy BMI is "Very Low");
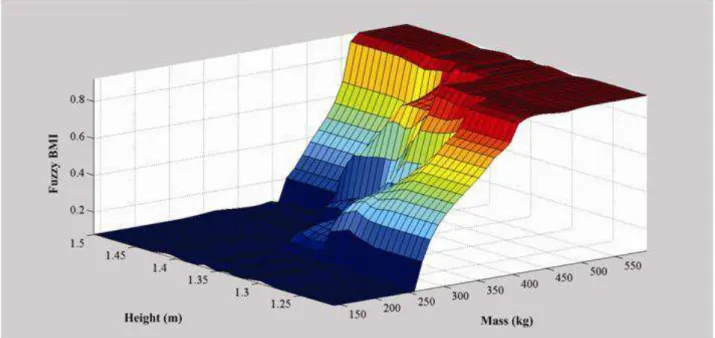
FIGURE 7. Fuzzy Body Mass Index (Fuzzy BMI) represented three-dimensionally possible evaluations of the herd.
FIGURE 8. Contour map of the surface Fuzzy BMI.
From Figure 8, it is possible to identify the region on the Mass Height establishing the
highest and lowest Fuzzy BMI, figuring an excellent tool for decision-making of the producer to slaughter or select animals. Region C represents the class of animals whose fuzzy BMI is Very Low, i.e., with a body mass below most animals in the herd, while animals in the class of region B have better body mass and the region has the best animals of the herd, in relation to this aspect.
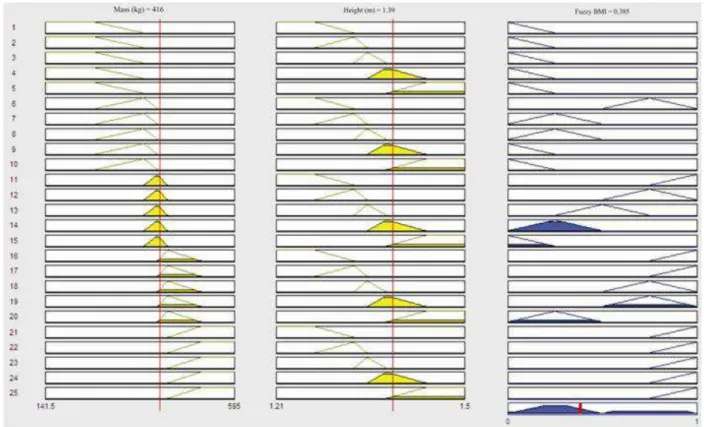
Figure 9 represents a simulation of the system based on fuzzy rules for the values of Mass and
Height obtained from an animal of the herd, also shown in Figure 8 at point P. Visually, this point
FIGURE 9. Using the Mamdani’s inference method, for Mass = 416 kg and Height = 1.39 m, resulted in a value of Fuzzy BMI = 0.385.
FIGURE 10. Indication of higher degree of pertinence to the fuzzy set "Medium" from the point
very close to 1, which represents a high positive correlation between these sets and indicates that the proposed method is suitable for the method previously used to conventionally calculate BMI.
FIGURE 11. Body mass index of animals and evaluation of herd the by fuzzy logic.
Moreover, it is possible to determine the equation that relates the values of BMI and Fuzzy
BMI by linear curve adjust between these variables, as shown in Figure 12.
CONCLUSIONS
This work provides a computational method able to interpret the body mass index of any bovine species and in any region of the country. This method, which is able to mimic part of the human reasoning, was based on fuzzy logic.
This interpretation of this index, defined as Fuzzy Body Mass Index (Fuzzy BMI) is unprecedented, since it aims at evaluating and comparing each animal of the herd with the other animals in the group, thereby providing a quantitative method of decision making for the rancher.
Thus, it was possible to establish a system based on fuzzy rules for classification of the animals in any herd through a body mass index and to establish the qualitative and quantitative identification for each animal.
According to the Pearson correlation coefficient obtained (0.923), very close to 1, it is clear that the proposed method is suitable for the method previously used to calculate BMI conventionally.
A significant innovation regarding the existing rule-based fuzzy systems is that the existing rule base system created in this work has not been prepared through interviews with experts in the field, but just by using pre-existing Body Mass Index (BMI).
The rule-based fuzzy system developed in this work is easy to use and can help ranchers in any region and of different cattle breeds, indicating Fuzzy BMI levels, which possibly would help determining the time for slaughtering, in order to maximize the farmer’s profits.
Finally, it can be concluded that this rule-based system can be expanded and used for a set of several herds of a region, allowing its utilization in large-scale by slaughtering houses for customer evaluation.
ACKNOWLEDGMENTS
The authors thank FUNDUNESP, the Foundation for the Development of UNESP, for the financial support that made the publication of this study possible.
REFERENCES
BROWN-BRANDL, T.M.; JONES, D.D.; WOLDT, W.E. Evaluating modeling techniques for cattle heat stress prediction. Biossystems Engineering, Harpenden, v.91, n.4, p.513-524, 2005.
CHACUR, M.G.M.; ARAÚJO, M.C.; KRONKA, S.N. Aspectos seminais e anatômicos do aparelho reprodutor da raça Canchim aos 14 e aos 48 meses de idade. In: CONGRESSO BRASILEIRO DE REPRODUÇÃO ANIMAL, 17., 2007, Curitiba. Anais... Belo Horizonte: CBRA, 2007.
CREMASCO, C. P. Aplicação da lógica fuzzy para avaliação do faturamento do consumo de
energia elétrica e demanda de uma empresa de avicultura de postura. Botucatu. 1998. 97f. Tese
(Doutorado em Energia na Agricultura) - Faculdade de Ciências Agronômicas, Universidade Estadual Paulista, Jaboticabal, 1998.
MELO, E.R.; CASTANHO, M.J.P. Diagnóstico fuzzy da febre aftosa em bovinos. In:
CONGRESSO LATINO AMERICANO DE BIOMATEMÁTICA, 2007., Campinas. Anais... Campinas: UNICAMP - IMECC - DMA, 2007.
SANCHEZ, A.I. Lemenphysical and morphological characteristics and corporal mass index of Nelore (Bos taurus indicus). In: INTERNATIONAL CONGRESS ON ANIMAL
REPRODUCTION, 15., 2004, Porto Seguro. Proceedings… v.1, p.196, 2004.