www.atmos-chem-phys.net/12/7517/2012/ doi:10.5194/acp-12-7517-2012
© Author(s) 2012. CC Attribution 3.0 License.
Chemistry
and Physics
Humidity-dependent phase state of SOA particles from biogenic and
anthropogenic precursors
E. Saukko1, A. T. Lambe2,3, P. Massoli3, T. Koop4, J. P. Wright2, D. R. Croasdale2, D. A. Pedernera4,*, T. B. Onasch2,3, A. Laaksonen5,6, P. Davidovits2, D. R. Worsnop3,7, and A. Virtanen1,6
1Department of Physics, Tampere University of Technology, Tampere, Finland 2Chemistry Department, Boston College, Chestnut Hill, MA, USA
3Aerodyne Research Inc., Billerica, MA, USA
4Faculty of Chemistry, Bielefeld University, Bielefeld, Germany 5Finnish Meteorological Institute, Helsinki, Finland
6Department of Applied Physics, University of Eastern Finland, Kuopio, Finland
7Division of Atmospheric Sciences, Department of Physics, University of Helsinki, Helsinki, Finland
*now at: Faculty of Mathematics, Astronomy and Physics, National University of Córdoba, Córdoba, Argentina
Correspondence to: A. Virtanen ([email protected])
Received: 22 December 2011 – Published in Atmos. Chem. Phys. Discuss.: 8 February 2012 Revised: 16 July 2012 – Accepted: 7 August 2012 – Published: 17 August 2012
Abstract. The physical phase state (solid, semi-solid, or liq-uid) of secondary organic aerosol (SOA) particles has impor-tant implications for a number of atmospheric processes. We report the phase state of SOA particles spanning a wide range of oxygen to carbon ratios (O / C), used here as a surrogate for SOA oxidation level, produced in a flow tube reactor by photo-oxidation of various atmospherically relevant surro-gate anthropogenic and biogenic volatile organic compounds (VOCs). The phase state of laboratory-generated SOA was determined by the particle bounce behavior after inertial im-paction on a polished steel substrate. The measured bounce fraction was evaluated as a function of relative humidity and SOA oxidation level (O / C) measured by an Aerodyne high resolution time of flight aerosol mass spectrometer (HR-ToF AMS).
The main findings of the study are: (1) biogenic and an-thropogenic SOA particles are found to be amorphous solid or semi-solid based on the measured bounced fraction (BF), which was typically higher than 0.6 on a 0 to 1 scale. A de-crease in the BF is observed for most systems after the SOA is exposed to relative humidity of at least 80 % RH, corre-sponding to a RH at impaction of 55 %. (2) Long-chain alka-nes have a low BF (indicating a “liquid-like”, less viscous phase) particles at low oxidation levels (BF<0.2±0.05 for O / C = 0.1). However, BF increases substantially upon
in-creasing oxidation. (3) Inin-creasing the concentration of sul-phuric acid (H2SO4) in solid SOA particles (here tested
for longifolene SOA) causes a decrease in BF levels. (4) In the majority of cases the bounce behavior of the vari-ous SOA systems did not show correlation with the particle O / C. Rather, the molar mass of the gas-phase VOC precur-sor showed a positive correlation with the resistance to the RH-induced phase change of the formed SOA particles.
1 Introduction
The direct and indirect effects of aerosol particles on the Earth’s radiative budget remain the largest source of uncer-tainty in climate change modeling (IPCC, 2007, ch. 2). In many locations, organic matter (OM) forms up to 90 % of observed submicron aerosol particulate mass, and secondary organic aerosol (SOA) represents up to half of the organic fine fraction (Jimenez et al., 2009; Hallquist et al., 2009).
formation process under natural conditions is complicated and it involves a multitude of gaseous precursors and a greater number of particle product compounds. Up to now, the modeling of formation and aging of SOA has been mostly based on gas-particle equilibrium partitioning of volatile and semivolatile species (Pankow, 1994; Kanakidou et al., 2005). This implies fast enough condensed phase diffusion rates to keep the condensed phase in equilibrium with the gas phase as the particles’ size increases and the concentration of VOCs decreases.
However, several recent studies show that at least under some conditions natural and laboratory-produced SOA par-ticles have an amorphous solid state (Virtanen et al., 2010; Cappa and Wilson, 2011; Vaden et al., 2011). The solid amor-phous state of SOA particles has important implications for a number of atmospheric processes. First, a solid phase im-plies surface-confined chemistry and kinetic limitations to achieve equilibrium partitioning between the gas phase and the particle phase. More importantly, chemical reactions are impeded in viscous aerosol particles (Zahardis and Petrucci, 2007; Shiraiwa et al., 2011; Pfrang et al., 2011; Ziemann, 2010), because mass transport (diffusion) of reactants within the aerosol particle bulk may become the rate limiting step. Shiraiwa et al. (2011) showed that these kinetic limitations can increase the chemical lifetime of (semi-)solid particles by more than an order of magnitude. The water uptake of highly viscous SOA particles may also be diminished or even fully inhibited, in particular at low temperatures, with impli-cations for the particles’ size and scattering properties and their direct effect on climate (Zobrist et al., 2008; Murray, 2008; Mikhailov et al., 2009; Koop et al., 2011). The par-ticles in a glassy state can also catalyse ice formation in cirrus conditions and thus have significant implications on the water-particle interactions at upper atmosphere (Murray et al., 2010).
All recent studies reporting a solid phase of SOA parti-cles (Virtanen et al., 2010; Cappa and Wilson, 2011; Vaden et al., 2011) have focused on studying the properties of lab-oratory or ambient SOA in dry conditions (RH<40 %). In order to assess how general is the occurrence of the amor-phous solid state of the SOA, and how other factors might affect particle phase state, we report a systematic characteri-zation of the phase of laboratory SOA as a function of O / C and relative humidity (RH). The SOA particles were gener-ated from the∗OH oxidation of several atmospherically rele-vant anthropogenic and biogenic precursors. A low pressure impactor (LPI) equipped with an optical counting arrange-ment provided a measurearrange-ment of the phase of the SOA par-ticles, based on the idea that “liquid-like” particles are col-lected on the impactor stage with minimal bounce, whereas detection of particles downstream of the impactor indicates that particles are bouncing off of the impactor stage and sug-gests the presence of an amorphous semi-solid or solid state. Other chemical and microphysical properties of the SOA par-ticles were characterized with a Scanning Mobility Particle
Sizer (SMPS) (TSI), Cloud Condensation Nuclei Counter (CCNC), and High-Resolution Time-of-Flight Aerosol Mass Spectrometer (HR-ToF-AMS).
2 Experimental
2.1 SOA particle generation
SOA particles were generated with a Potential Aerosol Mass (PAM) flow tube reactor, which is a horizontal 15 l glass cylindrical chamber 46 cm long ×22 cm ID. The details of the reactor used are described in Lambe et al. (2011a). The reactor is capable of simulating atmospheric oxidation timescales of days to weeks with actual residence times of minutes. Previous studies have shown that the PAM reactor can produce SOA at a level of oxidation that is atmospherically-relevant (Massoli et al., 2010; Lambe et al., 2011b, 2012) but unattainable by conventional smog cham-ber techniques that are limited to∼1 day of equivalent at-mospheric oxidation (e.g. Ng et al., 2010).
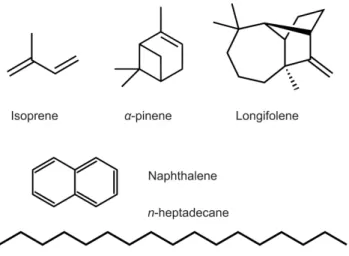
SOA was generated via gas-phase oxidation of precur-sors (shown in Fig. 1), followed by homogeneous nucle-ation. Volatile organic compound (VOC) precursors used in this study were isoprene andα-pinene. VOC precursors were prepared in compressed gas cylinders or in glass bubblers and introduced into the PAM reactor with N2 carrier gas
at controlled rates using a mass-flow controller. Intermedi-ate volatility organic compound (IVOC) precursors used in this study were n-heptadecane, longifolene, and naphthalene. With the exception of naphthalene, IVOCs were introduced into the carrier gas flow using a permeation tube placed in a temperature-controlled oven. Naphthalene vapor was in-troduced by flowing N2 over solid naphthalene placed in a
Teflon tube.
Organic species were transported through the PAM reactor by a carrier gas consisting of 8.5 lpm N2and 0.5 lpm O2. The
average species residence time in the PAM reactor was typi-cally 100 s. Four mercury lamps (BHK Inc.) with peak emis-sion intensity atλ=254 nm were mounted in teflon-coated quartz cylindrical sleeves inside the chamber, and were con-tinually purged with N2.
OH radicals (∗OH) were produced via the reaction O3 +
hν →O2 + O(1D)followed by the reaction O(1D)+ H2O →2∗OH. O3was generated by irradiating O2 with a
mer-cury lamp (λ=185 nm) outside the PAM reactor. Oxygen (O(1D)) radicals were produced by UV photolysis of O3
Fig. 1. Molecular structures of the VOC and IVOC gaseous
precur-sors used to generate SOA for the experiment: biogenic precurprecur-sors are in the top row, anthropogenic model precursors are on the bot-tom.
The∗OH exposure, which is the product of the∗OH con-centration and the average residence time in the PAM reac-tor, was varied by changing the UV light intensity through stepping the voltage applied to the lamps between 0 and 110 V. The ∗OH exposure was determined indirectly by measuring the decay of SO2 due to reaction with ∗OH in
the PAM reactor. SO2 calibration measurements were
con-ducted as a function of UV lamp intensity and O3
con-centration (Lambe et al., 2011a). Typical ∗OH exposures ranged from 2.7×10¹¹ to 2.2×10¹²molec cm−3 s. These
values are equivalent to 2 to 17 days of atmospheric oxida-tion assuming an average atmospheric∗OH concentration of 1.5×10⁶molec cm−3(Mao et al., 2009). However, we note that this equivalent “atmospheric age” may be a factor of 2 or more uncertain depending on the assumed ambient∗OH concentration.
While∗OH concentrations in these experiments (approxi-mately 2.7×10⁹to 2.2×10¹⁰molec cm−3) are higher than ambient∗OH concentrations, the integrated∗OH exposures are similar. Previous work suggests that, to first order, ex-trapolation of flow tube reactor conditions (high [∗OH], short exposure times) to atmospheric conditions (low [∗OH], long exposure times) is reasonable (Renbaum and Smith, 2011). Even though both O3and∗OH can oxidize organic species,
∗OH was the principal oxidant in all experiments except for selected studies, where experiments with O3as the oxidizing
agent were conducted by turning the lamps off. Prior to each experiment, the PAM reactor was conditioned with∗OH rad-icals until a particle background less than 10 particles cm−3 was attained.
In some experiments, internally mixed SOA – sulfuric acid particles were produced by introducing SO2along with the
SOA precursor, which is oxidized by∗OH to produce sulfuric
acid (H2SO4) in the presence of water vapor (Seinfeld and
Pandis, 1998, ch. 6.13).
2.2 Particles phase state measurement
The device used in this study to measure the particle bounce is described in detail in Saukko et al. (2012). The system con-sists of a low pressure impactor and a polished steel substrate. Size-selected aerosol is guided through a sampling cell (see Fig. 2) at low pressure until the system is stabilized, after which the cell is closed and re-pressurised to bring the sam-ple to the working conditions of a TSI Ultrafine Water Con-densation Particle Counter (WCPC), i.e. ambient pressure. This particle number concentration is compared to the par-ticle concentration measured upstream of the impactor. The bounced fraction is the ratio of the particle concentrations measured after and before the impactor, divided by a similar ratio (baseline sample) obtained without the impaction sub-strate. The method is conceptually similar to that used by Vir-tanen et al. (2010), but the optical detection of particles em-ployed here removes the effect of charge transfer processes. Accurate scales relating the bounced fraction to mechanical or other properties of the particles have not, however, been established yet.
The RH of the sampled aerosol is adjusted between 28 and 91 % RH by a Nafion humidifier (PermaPure). The Nafion capillaries are fed with a mixture of∼100 % RH air from water-fed micro-pore humidifier (Enerfuel) and <5 % RH pressurized air. The aerosol sample flows around the Nafion capillaries and the water vapor is transferred from the humid-ifying flow. The output humidity is adjusted with the ratio of the saturated and<5 % RH airflows.
CPC Neutralizer
Humidity control
unit
DMA
Impactor
Sample cell
Filter
Vacuum pump Sample
Fig. 2. The measurement system for the particle phase
measure-ment.
2.3 SOA CCNC measurements
The CCN activity of SOA particles was measured with a continuous flow CCN counter (CCNC) (Roberts and Nenes, 2005; Lance et al., 2006). The PAM-generated SOA was size-selected using a TSI 3080 DMA prior to CCN number concentration measurements with the CCNC and total par-ticle number concentration measurements with a CPC (TSI 3022A). CCN activation curves were generated by holding the particle size constant while systematically varying the CCNC column temperature gradient to obtain controlled wa-ter vapor supersaturation between 0.1–1.5 % or until 100 % activation was reached, as described in Massoli et al. (2010) and Lambe et al. (2011a). The CCN activity,κ, was calcu-lated using the approach by Petters and Kreidenweis (2007). Selected dry mobility diameters ranged from 55 to 85 nm for SOA.
2.4 SOA elemental ratios
The chemical composition of the laboratory gener-ated SOA were obtained with an Aerodyne HR-ToF-AMS (DeCarlo et al., 2006). Elemental analysis yield-ing oxygen-to-carbon (O / C) and hydrogen-to-carbon (H / C) ratios was performed on the high-resolution measurements using ToF-AMS analysis software (Squir-rel and Pika: http://cires.colorado.edu/jimenez-group/ ToFAMSResources/ToFSoftware/index.html).
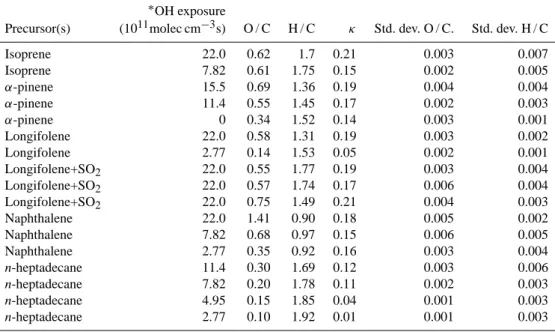
The absolute accuracies for O / C and H / C, determined by comparison to laboratory standards (Aiken et al., 2007, 2008), are 31 % and 10 %, respectively. These values rep-resent upper limits to the uncertainty of measurements for complex OA (Chhabra et al., 2010). The variability of the measurements can be captured by the precision error (stan-dard deviation) which for these laboratory conditions was less than±5 %. Table 1 shows the range of O / C ratio, H / C ratio and CCNκvalues for the SOA particles that were
stud-20 30 40 50 60
0 0.2 0.4 0.6 0.8 1
Impactor RH % Bounced fraction BSAAS
LG
30 40 50 60 70 80 90
Humidifier RH, %
Fig. 3. Reference bounce characteristics of ammonium sulfate (AS)
(crystalline), bovine albumin serum (BSA) (amorphous) and lev-oglucosan (LG) (amorphous).
ied in this work, along with the corresponding ∗OH expo-sures in the PAM reactor.
3 Results
Table 1. SOA generation parameters and measurements. The thirdα-pinene line with∗OH exposure of 0 refers to an ozonolysis experiment. ∗OH exposure
Precursor(s) (1011molec cm−3s) O / C H / C κ Std. dev. O / C. Std. dev. H / C
Isoprene 22.0 0.62 1.7 0.21 0.003 0.007
Isoprene 7.82 0.61 1.75 0.15 0.002 0.005
α-pinene 15.5 0.69 1.36 0.19 0.004 0.004
α-pinene 11.4 0.55 1.45 0.17 0.002 0.003
α-pinene 0 0.34 1.52 0.14 0.003 0.001
Longifolene 22.0 0.58 1.31 0.19 0.003 0.002
Longifolene 2.77 0.14 1.53 0.05 0.002 0.001
Longifolene+SO2 22.0 0.55 1.77 0.19 0.003 0.004
Longifolene+SO2 22.0 0.57 1.74 0.17 0.006 0.004
Longifolene+SO2 22.0 0.75 1.49 0.21 0.004 0.003
Naphthalene 22.0 1.41 0.90 0.18 0.005 0.002
Naphthalene 7.82 0.68 0.97 0.15 0.006 0.005
Naphthalene 2.77 0.35 0.92 0.16 0.003 0.004
n-heptadecane 11.4 0.30 1.69 0.12 0.003 0.006
n-heptadecane 7.82 0.20 1.78 0.11 0.002 0.003
n-heptadecane 4.95 0.15 1.85 0.04 0.001 0.003
n-heptadecane 2.77 0.10 1.92 0.01 0.001 0.003
Semi-solid/solid amorphous materials have very wide vis-cosity range. By definition the visvis-cosity of the liquids is <102 Pas, viscosity of the semisolids varies from 102Pas up to 1012Pas. Material having viscosity>1012Pas can be con-sidered as “glass” (e.g. Koop et al., 2011). Thus “more solid” refers to the (amorphous) material having higher viscosity and higher BF value than some other (amorphous) material.
3.1 Phase state and humidity-induced phase transitions of biogenic SOA particles
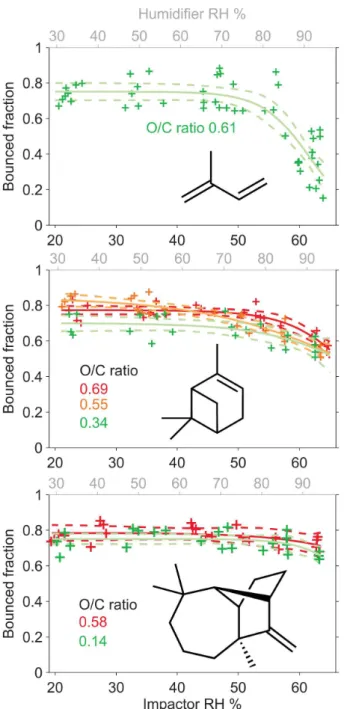
The fraction of bounced SOA particles formed from biogenic precursors (isoprene,α-pinene, and longifolene) as a func-tion of RH in the impactor is shown in Fig. 4. As menfunc-tioned in Sect. 2.2, the relative humidity in the impactor is approx-imately 30 % lower than the initial humidified sample RH because of the pressure drop in the impactor stage. Therefore we define the RH value inside the impactor as the impactor RH, or RHI.
For 20 %<RHI<50 %, the bounced fraction of biogenic SOA particles was between 0.65 and 0.9 in all cases and for all O / C levels ranging from 0.14 to 0.69. Thus, we conclude that biogenic SOA particles generated in the PAM reactor are solid or semi-solid at RHI<50 % over the range of mea-sured conditions. For RHI>50 %, the measured BF of bio-genic SOA particles decreased. This decrease in bounce sug-gests a decrease in viscosity as a result of a humidity-induced phase change from solid to liquid-like particles. It should be noted that in the case of highly viscous, glassy particles the possibility of formation of liquid layer of adsorbed water on the particle surface can not be entirely excluded. The forma-tion of such a layer may then reduce the bounced fracforma-tion of the particles. The HTDMA studies of SOA particles,
how-ever show modest but gradual particle water uptake with in-creasing humidity (Varutbangkul et al., 2006; Prenni et al., 2007). This behaviour suggests that water uptake is not pure adsorption only, but the water is able to diffuse to the particle bulk.
The decrease in BF above RHI of 55 % was most pro-nounced for isoprene SOA particles for which BF decreased to 0.25±0.1 at RHI=65 % (Fig. 4, top panel). The BF vs RHI relatiosnhip in the case of isoprene could only be ex-plored for one O / C value (0.61). However, similar measure-ments of bounced fraction as a function of RHI performed for SOA particles generated from α-pinene (Fig. 4 middle panel) and longifolene (Fig. 4 lower panel) showed that there was no systematic difference in the measured bounced frac-tion for as a funcfrac-tion of O / C ratio (O / C = 0.34 to 0.69 for α-pinene and 0.14 to 0.58 for longifolene SOA). For SOA particles generated fromα-pinene, the bounced fraction de-creased from 0.75±0.1 (at RHI ∼22 %) to 0.55±0.1 (at RHI=65 %). For SOA particles generated from longifolene, the bounced fraction decreased from 0.78±0.05 to 0.7±0.1 across the same RHI range. These decreases in bounce were significantly less than for SOA produced from isoprene, sug-gesting that phase changes were less pronounced.
Fig. 4. Bounce behavior of SOA from photo-oxidation experiments
of biogenic precursors, solid lines are sigmoid fits to guide the eye, dashed lines give the 95 % confidence bounds for the fits. Upper panel: isoprene SOA, middle panel:α-pinene SOA, lower panel: longifolene SOA.
3.2 Phase state and humidity-induced phase transitions of mixed SOA-sulphuric acid particles
In most cases, ambient oxygenated organic aerosol (OOA) is mixed with inorganic species such as particulate nitrate and sulphate, (e.g. Jimenez et al., 2009), which may influence the viscosity or phase of the aerosols. In a separate set of
exper-iments, we measured the bounced fraction of SOA/sulphuric acid mixtures generated from the simultaneous oxidation of longifolene and SO2in the PAM reactor. The longifolene
sys-tem was chosen because the bounced fraction of longifolene SOA resulted particularly insensitive to increasing RHI (cf. Fig. 4). Therefore, any changes in particle bounce are due to changes in the organics-to-sulphate ratio of the particles (measured by the HR-ToF-AMS).
It is important to consider that in the case of multi-component inorganic-organic particles it is possible that a liquid-liquid phase separation may occur (Marcolli and Krieger, 2006; Ciobanu et al., 2009; Bertram et al., 2011; Song et al., 2012; Zuend and Seinfeld, 2012). Since we can-not distinguish phase separation in the 100 nm particles stud-ied here, we discuss below whether the observed bounce be-havior is consistent with one or both of the two possible cases, i.e. liquid-liquid phase-separated aerosol particles and well-mixed aerosol particles.
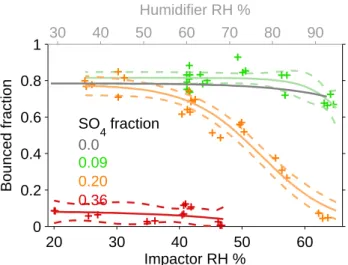
Figure 5 shows the measured bounced fraction as a func-tion of RHIfor longifolene SOA-sulphate mixtures, with sul-phate mass fractions ranging from 0.09 to 0.36. The sulfate fraction is calculated as the fraction of sulfate mass with re-spect to the measured AMS total mass (mostly ORG, with small concentrations of NH4within instrumental noise). The
O / C measured for the pure longifolene SOA was 0.58, and with sulfate fractions of 0.9, 0.20 and 0.36 the respective O / C-ratios were 0.55, 0.57 and 0.75 while keeping other pa-rameters constant.
As is evident from Fig. 5, a sulphate mass fraction of 0.09 does not decrease the particle bounce relative to that of pure longifolene SOA. However, increasing the sulphate mass fraction to 0.20 results in a continual decrease in particle bounced fraction as a function of RHI, with the sharpest decrease at RHI 55 %, to a final bounced fraction of 0.1±0.05 at RHI=62 %. This suggests a solid-to-liquid phase transition of the mixed SOA/sulfate particles in this range of RHI. Increasing the sulphate mass fraction to 0.36 results in a constant particle bounced fraction 0.10±0.05 for 20 %<RHI<62 %, suggesting a liquid-like behavior over the entire RHI range investigated.
20 30 40 50 60 0
0.2 0.4 0.6 0.8 1
Impactor RH %
Bounced fraction
0.09
0.20 0.36
SO
4 fraction
0.0
30 40 50 60 70 80 90
Humidifier RH %
Fig. 5. Addition of SO2to precursor flow for longifolene SOA
ex-periment decreases the phase transition relative humidity. The SO4
fraction indicates the fraction of SO4with respect to the total mea-sured AMS mass (ORG+SO4+NO3+NH4).
the particle core may be liquid for the entire range of inves-tigated humidity studied here. In contrast, the organic-rich outer “shell” consisting of SOA/SA mixtures might be in a solid, semi-solid or liquid state depending on experimental conditions. For the case of a sulphate fraction of 0.09 it ap-pears that the bounce is very similar to that of pure SOA particles suggesting that neither the minor inorganic frac-tion contained in the outer shell nor the liquid SA core sig-nificantly decrease the bounce of the particle. For a larger SA fraction of 0.2 the reduced bounce at higher humidity suggests at least a partial liquefaction. This might have two causes. First, the liquid core is larger due to an enhanced SA content when compared to the 0.09 SA case and, hence, more significant water uptake occurs at higher humidity. Secondly, in addition a larger SA content in the organic outer shell might reduce its viscosity when compared to the pure SOA particle phase. Finally, at an SA content of 0.36 the particles show a liquid-like bounced fraction over the entire humidity range. Again this might indicate an even larger SA core that is liquid-like even at low humidity and in addition a possible further increased SA content in the organic shell, also further reducing the outer organic shell’s viscosity even at lower hu-midity.
The behavior of longifolene SOA/sulphuric acid mixtures seen in Fig. 5 might therefore be attributed to the particles’ SA core being liquid, with potential effects of SA also in the organic shell. As far as the liquid content is concerned, a very rough estimate of the liquid content (water and sulfuric acid) can be made by assuming phase separation and water uptake of sulphuric acid according to Kim et al. (1994). Based on this, the water+H2SO4-volume concentration of the particles
is above 60 % for the case of 0.36 SO4 fraction, and below
31 % for the case of 0.09 SO4fraction. The intermediate case
of SO4 fraction of 0.20 has the water+H2SO4-volume
con-centration ranging from 0.46 at 30 % RH to 0.52 at 0.52 at 60 % RHI.
For these reasons, it is useful to discuss how increasing sulphate content would affect the phase state of well-mixed SOA/SA particles. In principle, empirical mixing laws that are based on data from various mixtures of a range of dif-ferent compounds predict that the glass transition tempera-ture (Tg) of a mixture is between theTg’s of the individual
compounds (Koop et al., 2011). However, this has not been confirmed so far for a sulphuric acid /organic mixture. There-fore, the principle behavior of well-mixed organic/sulphate solutions was further examined using differential scanning calorimetry (DSC) (Höhne et al., 2003) by measuringTgof
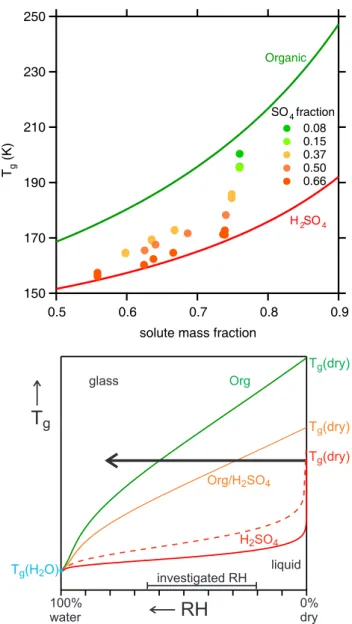
a model mixtures of glucose and sulphuric acid, for experi-mental details see Zobrist et al. (2008). (We were not able to use SOA material for such purposes, because the SOA sam-ple mass required for such measurements is in the microgram range and thus far beyond that available from the PAM reac-tor.) Figure 6 shows that increasing the mass fraction of sul-phuric acid decreases the glass transition temperature of the mixture at constant solute mass fraction (i.e. constant wa-ter content). Our results are therefore consistent with studies showing that mixing compounds with differentTgvalues
nor-mally results in a glass transition temperature of the mixture that is betweenTgvalues of the individual mixture
compo-nents (Zobrist et al., 2008; Koop et al., 2011).
Accordingly, because sulphuric acid shows a lower Tg
than the SOA organics investigated here, its presence would soften the SOA particles. Moreover, owing to its larger hy-groscopicity sulphuric acid (and similarly ammonium bisul-fate or ammonium sulbisul-fate) also leads to an increase in wa-ter content of the particles at the same RH, further softening the particles, thereby leading to a humidity-induced liquefac-tion of the particles at humidities that are lower when com-pared to those of pure SOA particles. This is shown schemat-ically in the bottom panel of Fig. 6 , which is a sketch of Tgversus equilibrium relative humidity for various organics
and/or sulphuric acid mixtures. When humidity is increased at constant temperature (black arrow) the pure organic (green curve) with the highest glass transition temperature in the dry state, Tg (dry), shows a humidity-induced liquefaction
at the highest RH (intersection between the black arrow and the greenTg curve), close to the upper end of investigated
RH range. In contrast, pure sulphuric acid or a mixture with high sulphuric acid content (red) show the lowest Tg(dry)
and, hence, are liquid over the full range of investigated RH without any bounce. Finally, a mixture with a high organics content (orange) shows an intermediateTg(dry), thus
lique-fying at an intermediate RH in the middle of the investigated RH range.
250
230
210
190
170
150
Tg
(K)
0.9 0.8
0.7 0.6
0.5
solute mass fraction
SO4 fraction
0.08
0.15
0.37
0.50
0.66
H2SO4
Organic
T
gRH
0%dry 100%
water
Org
H SO2 4 Org/H SO2 4
glass
liquid investigated RH
T (H O)g 2
T (dry)g
T (dry)g
T (dry)g
Fig. 6. Top: addition of H2SO4to an organic (here: glucose) leads
to a strong reduction in Tg at the same water content
(Pedern-era, 2008). The effect is even more pronounced when plotted as a function of relative humidity (because of the different hygroscop-icities of organics and sulfate). The bottom panel is a schematic picture ofTgversus equilibrium relative humidity for various or-ganic/sulphuric acid mixtures.
acid plays an important role in atmospheric nucleation pro-cesses, as suggested by Sipilä et al. (2010) and Kirkby et al. (2011), our results suggest that freshly nucleated particles containing appreciable amounts of sulphuric acid are initially liquid. The discussion above indicates that this might be true independently of whether the sulphate and organic fraction are phase-separated or not. As the particles grow via conden-sation of oxygenated organic species, the mass fraction and, hence, the effectiveTgmight increase and the particles may
solidify (Virtanen et al., 2010, 2011).
3.3 Phase state and humidity-induced phase transitions of anthropogenic SOA particles
In addition to bounce measurements of biogenic SOA parti-cles, we also studied the bounce behavior of anthropogenic SOA particles generated from the oxidation of naphthalene and n-heptadecane. Naphthalene was chosen as a model aro-matic precursor, and n-heptadecane as a model aliphatic pre-cursor. The upper panel in Fig. 7 shows the bounced fraction of SOA particles generated from naphthalene as a function of RHI. The bounce behavior for naphthalene SOA is similar to that ofα-pinene SOA, with a decrease in bounced fraction from 0.65±0.1 (average value among several O / C ratios) at RHI<50 % to 0.4±0.1 at RHI=64 %.
The lower panel in Fig. 7 shows the bounce behavior of n-heptadecane SOA as a function of RHI. Unlike the other sys-tems that were studied, the bounced fraction of SOA particles generated from n-heptadecane was strongly correlated with the O / C ratio of the SOA. At O / C=0.10, the SOA bounced fraction was low (0.2±0.05) and was unaffected by RHI, implying an organic liquid-like phase. At O / C=0.15, the bounced fraction was above 0.5 at RHI =20 % and exhibited a monotonic decrease to slightly below 0.3 at RHI=64 %. At O / C=0.20, a constant bounced fraction of 0.55±0.05 was measured for RHI <50 %, with a decrease in bounced fraction to 0.4 at RHI =64 %. Finally, at an O / C ratio of 0.30, we measured a constant bounced fraction of above 0.8 at RHI <50 % before the bounced fraction decreased to be-low 0.7 at RHI=60 %. This bounce behavior was similar to that observed in the other systems that were studied. Thus, SOA particles generated from n-heptadecane were initially liquid-like at low O / C ratio and solidified with increasing O / C ratio.
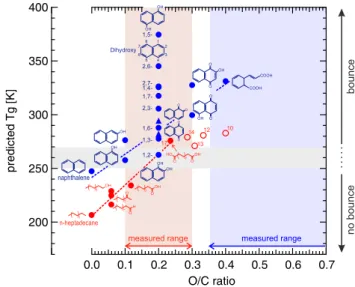
In order to rationalize the observed behavior of the an-thropogenic SOA particles, in Fig. 8 we show the predicted Tg values for naphthalene (∼247 K) and n-heptadecane
(∼207 K). TheseTgvalues were predicted from the observed
dependence of Tg upon melting temperature Tm, i.e. Tg≈
0.7×Tm(Koop et al., 2011). Also shown in Fig. 8 are the
predictedTgfor various oxygenated compounds originating
from the parent structure of n-heptadecane (red) and naphtha-lene (blue). The red-shaded and blue-shaded vertical bars in-dicate the range of investigated O / C ratio for each SOA. The grey horizontal bar indicates the suggested turnover from liq-uid behavior at room temperature (no bounce) for substances with a Tgless than ∼250 K to solid behavior (bounce) for
substances with aTgabove∼270 K.
The predictedTgof naphthalene is already close to 250 K,
and just adding one O-atom (e.g. 1-naphthol and 2-naphthol, with an O / C ratio of 0.1) might initiate (partial) bounce in such particles at room temperature. Further increase in O / C ratio to values between 0.2–0.4 leads to predictedTgvalues
Fig. 7. Bounce behavior of SOA from photo-oxidation of
naphtha-lene (upper panel) and n-heptadecane (lower panel).
measured range of O / C>0.35 (light blue shading) nearly all substances are expected to bounce independently of their actual O / C ratio.
In contrast, the predictedTgfor n-heptadecane and those
of mildly oxygenated compounds (1-alcohol, 1-aldehyde, 2-ketone) with an O / C ratio of 0.06 are so low that these com-pounds are liquid at room temperature and, thus, would not show bounce. Only at significant oxygenation (e.g. the 1,17-dicarboxylic acid, with an O / C ratio of 0.24) bounce is to be expected. We note that oxygenation of n-heptadecane is likely to lead to fragmentation (Lambe et al., 2012). How-ever, it appears that at least an oxidation to a dicarboxylic acid is required for bounce, more or less independently of the length of the remaining carbon chain (see red open cir-cles with number of C-atoms indicated). For n-heptadecane, theTg goes from∼207 K to greater than∼280 K with
in-creasing O / C (pink shading), in agreement with the mea-surements.
Similarly to previous studies that suggest a correlation of bounced fraction with the glass transition temperature (Virta-nen et al., 2010) the same correlation is observed here. Based on an idealized comparison of predicted Tg values shown
400
350
300
250
200
pre
di
ct
ed
T
g
[K]
0.7 0.6 0.5 0.4 0.3 0.2 0.1 0.0
O/C ratio
measured range measured range
OH OH
OH O O 1
2 4 3 78 6
5
Dihydroxy
1,5-
2,6- 2,7- 1,4- 1,7-
2,3-
1,2-OH ( )7 O
( )7
OH ( )7
OOH ( )7
O OH O HO( )
7
( )7
OH OH
1,3-O O
COOH COOH
1,6- O
O
OH O O OH OH
bo
un
ce
no
b
ou
nce
naphthalene
n-heptadecane
13 14 12 10 17
Fig. 8. Predicted glass transition temperaturesTgas a function of the
molecular O / C ratio for various oxygenated compounds originating from the parent structure of n-heptadecane (red) and naphthalene (blue). Open circles are predictedTgfor n-dicarboxylic acids with the number of C-atoms indicates for each point. For details see text.
in Fig. 8, it is no surprise that n-heptadecane SOA shows a “bounce transition” with increasing O / C in the gated range while naphthalene SOA bounced at all investi-gated O / C ratios.
3.4 Discussion
The main factors affecting the bounce behavior of SOA par-ticles are likely their viscosity, elasticity and the surface ad-hesion. For amorphous particles, the viscosity and mechani-cal properties are sensitive to the glass transition temperature (Shiraiwa et al., 2011; Koop et al., 2011). The glass transi-tion temperature and thus the viscosity at constant temper-ature are sensitive to the solvent concentration, molar mass and the functional groups of the particulate matter (Zobrist et al., 2008; Koop et al., 2011). As discussed above, we sug-gest that humidity-induced changes in bounced fraction of the SOA particle are related to a humidity-induced glass tran-sition of SOA particles (Mikhailov et al., 2009).
The conditions for a humidity-induced glass transition (i.e. liquefaction) are connected to Tg (dry) of the SOA
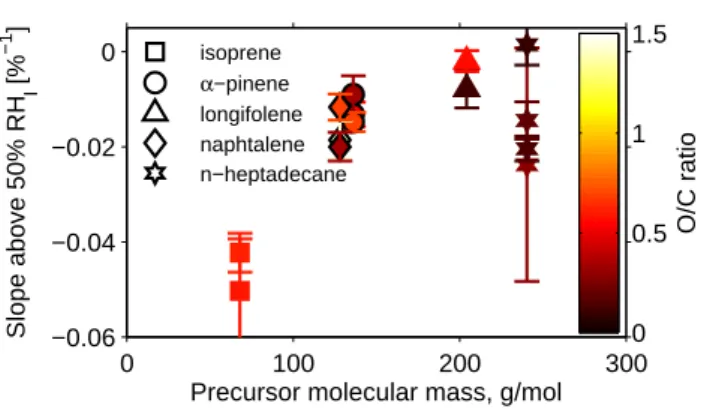
0 100 200 300 −0.06
−0.04 −0.02 0
Precursor molecular mass, g/mol
Slope above 50% RH
I
[%
−1
]
O/C ratio
0 0.5 1 1.5
isoprene α−pinene longifolene naphtalene n−heptadecane
Fig. 9. The slope of the bounce at RHI>50 % versus precursor molar mass for the studied systems. Error bars mark the standard error of the slope of each fit.
mass and SOA particle growth factor was also shown by Varutbangkul et al. (2006). SOA particles produced from n-heptadecane did not follow the same trend as the particles generated by the other precursors.
According to several studies SOA particles may con-tain oligomers, polymers and other high molecular weight molecules (Tolocka et al., 2004; Gao et al., 2004; Kalberer et al., 2004; Hallquist et al., 2009; Hall IV and Johnston, 2011; Kundu et al., 2012). Such oligomers and polymers are likely to affect the phase state of SOA particles. There is experimental evidence from different types of materials that oligomerisation and polymerisation do lead to an increase of the glass transition temperature of a chemical compound, and semi-empirical formulations exist (e.g., the Fox-Flory rela-tion) that describe the molar mass dependence ofTg(Fox and
Flory, 1950; Rietsch et al., 1976; Koop et al., 2011). More-over, there is also mounting evidence that cross-linking of polymers also leads to an increase inTgwhen compared to
the same linear polymer, independently of whether the poly-mers are cross-linked in a linear or even branched fashion (Nielsen, 1969; Rietsch et al., 1976), owing to a reduced seg-mental motion of the individual monomeric chain units. This, oligomer and polymer formation in SOA particles will nor-mally favor the formation of semi-solid or solid amorphous phases. It should be noted, however, that oligomeric com-pounds do not automatically lead to the formation of amor-phous solids at room temperature. For example, in a recent study by Perraud et al. (2012) it was shown that, in contrast to α-pinene SOA, aerosolized poly(ethyleneglycol) oligomers (PEG 400, molar mass ∼400 g mol−1, equivalent to 9
re-peating units) did show liquid-like behavior in terms of their phase partitioning of oxidation products, in agreement with the fact that PEG 400 is liquid and known to be a good plas-ticizer for polymers. Thus the chemical nature of oligomers in SOA as well as their mass fraction in the organic phase of a particle is crucial to quantify their effect on the formation of amorphous solids. To obtain such detailed data is beyond the present study, as the HR-ToF-AMS does not retain
in-formation regarding high MW compounds and/or oligomers in the SOA due to the high degree of fragmentation of the molecular vapor via standard electron impact (Canagaratna et al., 2007), and is an interesting topic for future studies. To the extent that the “bounce slope” is proportional to the av-erage molar mass (AMM) of the SOA, Fig. 9 suggests that the AMM of SOA generated from n-heptadecane does not scale with precursor AMM in the same way as the SOA in the other experiments. One possible explanation for this observa-tion is that fragmentaobserva-tion reacobserva-tions that cleave carbon-carbon bonds and lower the AMM are more important in SOA pro-duced from n-heptadecane than in the other systems. The im-portance of fragmentation reactions has not been extensively characterized for precursors studied in this work. However, Chacon-Madrid et al. (2010) and Chacon-Madrid and Don-ahue (2011) showed that the∗OH oxidation of linear aldehy-des/ketones formed SOA in lower yields than linear alkanes with equivalent vapor pressures, suggesting that fragmenta-tion is important for SOA generated from alkane precursors. If SOA generated from the other precursors experienced less fragmentation than SOA generated from n-heptadecane, this may explain the trends observed in Fig. 9.
4 Conclusions
Our results suggest that most types of atmospherically-relevant SOA form amorphous solid or semi-solid particles at RHI.60 %. These SOA particles can undergo phase transi-tions as a result of changes in relative humidity, and/or O / C level. Addition of hygroscopic sulphuric acid to the SOA liq-uefied the mixed particles at low RHI, which is consistent with aerosol bounce observations from Virtanen et al. (2011) andTgmeasurements from Koop et al. (2011). The phase of
the SOA affects corresponding timescales for mass transfer and heterogeneous reactions within the particles (Cappa and Wilson, 2011; Vaden et al., 2011; Shiraiwa et al., 2011), and may influence their ability to serve as cloud condensation nu-clei or ice nunu-clei in the atmosphere.
In most cases, humidity-induced phase changes measured for the SOA were not correlated with O / C ratio or the CCN activity, κ. However, our measurements suggest that humidity-induced phase changes were related to the average molar mass of the SOA. These observations are consistent with the results of Koop et al. (2011), who showed thatTg
was more strongly influenced by molar mass than O / C ratio of model organic compounds.
well as the ability of the bounce measurement to provide quantitative measurements of particle viscosity, diffusivity, and glass transition temperature.
Acknowledgements. This work was supported by a grant from the
Nessling Foundation to the Tampere University of Technology. The research was also supported by the Office of Science (BER), Department of Energy (Atmospheric Science Program) grant No. DE-SC0006980 and the Atmospheric Chemistry Program of the National Science Foundation grants No. ATM-0525355 and ATM-0854916 to Boston College and Aerodyne Research, Inc, and the EU integrated project 505390-GOCE-CT-2004.
Edited by: B. Ervens
References
Aiken, A. C., DeCarlo, P. F., and Jimenez, J. L.: Elemental Analysis of Organic Species with Electron Ionization High-Resolution Mass Spectrometry, Anal. Chem., 79, 8350–8358, doi:10.1021/ac071150w, 2007.
Aiken, A. C., DeCarlo, P. F., Kroll, J. H., Worsnop, D. R., Huff-man, J. A., Docherty, K. S., Ulbrich, I. M., Mohr, C., Kimmel, J. R., Sueper, D., Sun, Y., Zhang, Q., Trimborn, A., Northway, M., Ziemann, P. J., Canagaratna, M. R., Onasch, T. B., Alfarra, M. R., Prevot, A. S. H., Dommen, J., Duplissy, J., Metzger, A., Baltensperger, U., and Jimenez, J. L.: O / C and OM/OC Ratios of Primary, Secondary, and Ambient Organic Aerosols with High-Resolution Time-of-Flight Aerosol Mass Spectrometry, Environ. Sci. Technol., 42, 4478–4485, doi:10.1021/es703009q, 2008. Bertram, A. K., Martin, S. T., Hanna, S. J., Smith, M. L.,
Bodsworth, A., Chen, Q., Kuwata, M., Liu, A., You, Y., and Zorn, S. R.: Predicting the relative humidities of liquid-liquid phase separation, efflorescence, and deliquescence of mixed par-ticles of ammonium sulfate, organic material, and water using the organic-to-sulfate mass ratio of the particle and the oxygen-to-carbon elemental ratio of the organic component, Atmos. Chem. Phys., 11, 10995–11006, doi:10.5194/acp-11-10995-2011, 2011. Canagaratna, M., Jayne, J., Jimenez, J., Allan, J., Alfarra, M., Zhang, Q., Onasch, T., Drewnick, F., Coe, H., Middlebrook, A., Delia, A., Williams, L., Trimborn, A., Northway, M., DeCarlo, P., Kolb, C., Davidovits, P., and Worsnop, D.: Chemical and micro-physical characterization of ambient aerosols with the aerodyne aerosol mass spectrometer, Mass Spectrom. Rev., 26, 185–222, doi:10.1002/mas.20115, 2007.
Cappa, C. D. and Wilson, K. R.: Evolution of organic aerosol mass spectra upon heating: implications for OA phase and partitioning behavior, Atmos. Chem. Phys., 11, 1895–1911, doi:10.5194/acp-11-1895-2011, 2011.
Chacon-Madrid, H. J. and Donahue, N. M.: Fragmentation vs. functionalization: chemical aging and organic aerosol forma-tion, Atmos. Chem. Phys., 11, 10553–10563, doi:10.5194/acp-11-10553-2011, 2011.
Chacon-Madrid, H. J., Presto, A. A., and Donahue, N. M.: Function-alization vs. fragmentation: n-aldehyde oxidation mechanisms and secondary organic aerosol formation, Phys. Chem. Chem. Phys., 12, 13975–13982, doi:10.1039/C0CP00200C, 2010.
Chhabra, P. S., Flagan, R. C., and Seinfeld, J. H.: Elemental analysis of chamber organic aerosol using an aerodyne high-resolution aerosol mass spectrometer, Atmos. Chem. Phys., 10, 4111–4131, doi:10.5194/acp-10-4111-2010, 2010.
Ciobanu, V. G., Marcolli, C., Krieger, U. K., Weers, U., and Peter, T.: Liquid-Liquid Phase Separation in Mixed Organic/Inorganic Aerosol Particles, J. Phys. Chem. A, 113, 10966–10978, doi:10.1021/jp905054d, 2009.
DeCarlo, P., Kimmel, J., Trimborn, A., Northway, M., Jayne, J., Aiken, A., Gonin, M., Fuhrer, K., Horvath, T., Docherty, K., Worsnop, D. R., and Jimenez, J. L.: Field-deployable, high-resolution, time-of-flight aerosol mass spectrometer, Anal. Chem., 78, 8281–8289, 2006.
Donahue, N. M., Kroll, J. H., Pandis, S. N., and Robinson, A. L.: A two-dimensional volatility basis set – Part 2: Diagnostics of organic-aerosol evolution, Atmos. Chem. Phys., 12, 615–634, doi:10.5194/acp-12-615-2012, 2012.
Fox, T. and Flory, P.: Second-order transition temperatures and re-lated properties of polystyrene. I. Influence of molecular weight, J. Appl. Phys., 21, 581–591, 1950.
Gao, S., Keywood, M., Ng, N. L., Surratt, J., Varutbangkul, V., Bahreini, R., Flagan, R. C., and Seinfeld, J. H.: Low-Molecular-Weight and Oligomeric Components in Secondary Organic Aerosol from the Ozonolysis of Cycloalkenes and α-Pinene, J. Phys. Chem. A, 108, 10147–10164, doi:10.1021/jp047466e, 2004.
Hall IV, W. and Johnston, M.: Oligomer content ofα-pinene sec-ondary organic aerosol, Aerosol Sci. Technol., 45, 37–45, 2011. Hallquist, M., Wenger, J. C., Baltensperger, U., Rudich, Y., Simp-son, D., Claeys, M., Dommen, J., Donahue, N. M., George, C., Goldstein, A. H., Hamilton, J. F., Herrmann, H., Hoff-mann, T., Iinuma, Y., Jang, M., Jenkin, M. E., Jimenez, J. L., Kiendler-Scharr, A., Maenhaut, W., McFiggans, G., Mentel, Th. F., Monod, A., Prévôt, A. S. H., Seinfeld, J. H., Surratt, J. D., Szmigielski, R., and Wildt, J.: The formation, properties and im-pact of secondary organic aerosol: current and emerging issues, Atmos. Chem. Phys., 9, 5155–5236, doi:10.5194/acp-9-5155-2009, 2009.
Höhne, G., Hemminger, W., and Flammersheim, H.: Differential scanning calorimetry, Springer Verlag, 2003.
IPCC: Changes in Atmospheric Constituents and in Radiative Forc-ing. In: Climate Change 2007: The Physical Science Basis. Con-tribution of Working Group I to the Fourth Assessment Report of the Intergovernmental Panel on Climate Change, available at: http://www.ipcc.ch/ipccreports/ar4-wg1.htm, 2007.
C. E., Baltensperger, U., and Worsnop, D. R.: Evolution of Or-ganic Aerosols in the Atmosphere, Science, 326, 1525–1529, doi:10.1126/science.1180353, 2009.
Kalberer, M., Paulsen, D., Sax, M., Steinbacher, M., Dommen, J., Prevot, A. S. H., Fisseha, R., Weingartner, E., Frankevich, V., Zenobi, R., and Baltensperger, U.: Identification of Polymers as Major Components of Atmospheric Organic Aerosols, Science, 303, 1659–1662, doi:10.1126/science.1092185, 2004.
Kanakidou, M., Seinfeld, J. H., Pandis, S. N., Barnes, I., Dentener, F. J., Facchini, M. C., Van Dingenen, R., Ervens, B., Nenes, A., Nielsen, C. J., Swietlicki, E., Putaud, J. P., Balkanski, Y., Fuzzi, S., Horth, J., Moortgat, G. K., Winterhalter, R., Myhre, C. E. L., Tsigaridis, K., Vignati, E., Stephanou, E. G., and Wilson, J.: Organic aerosol and global climate modelling: a review, At-mos. Chem. Phys., 5, 1053–1123, doi:10.5194/acp-5-1053-2005, 2005.
Kim, Y. P., Pun, B. K.-L., Chan, C. K., Flagan, R. C., and Seinfeld, J. H.: Determination of Water Activity in Ammonium Sulfate and Sulfuric Acid Mixtures Using Levitated Single Particles, Aerosol Sci. Technol., 20, 275–284, doi:10.1080/02786829408959683, 1994.
Kirkby, J., Curtius, J., Almeida, J., Dunne, E., Duplissy, J., Ehrhart, S., Franchin, A., Gagné, S., Ickes, L., Kürten, A., Kupc, A., Met-zger, A., Riccobono, F., Rondo, L., Schobesberger, S., Tsagko-georgas, G., Wimmer, D., Amorim, A., F, B., Breitenlechner, M., David, A., Dommen, J., Downard, A., Ehn, M., Flagan, R., Haider, S., Hansel, A., Hauser, D., Jud, W., Junninen, H., Kreissl, F., Kvashin, A., A., L., Lehtipalo, K., Lima, J., Lovejoy, E., Makhmutov, F., Mathot, S., Mikkilä, J., Minginette, P., Mogo, S., Nieminen, T., Onnela, A., Pereira, P., Petäjä, T., Schnitzhofer, R., Seinfeld, S. P., Sipilä, M., Stozhkov, Y., Stratmann, F., Tome, A., Vanhanen, J., Viisanen, Y., Vrtala, A., Wagner, P., Walther, H., Weingartner, E., Wex, H., Winkler, P., Carslaw, K., Worsnop, D., Baltensberger, U., and Kulmala, M.: Role of sulphuric acid, ammonia and galactic cosmic rays in atmospheric aerosol nucle-ation, Nature, 476, 429–433, 2011.
Koop, T., Bookhold, J., Shiraiwa, M., and Pöschl, U.: Glass tran-sition and phase state of organic compounds: dependency on molecular properties and implications for secondary organic aerosols in the atmosphere, Phys. Chem. Chem. Phys., 13, 19238–19255, doi:10.1039/C1CP22617G, 2011.
Krieger, U. K., Marcolli, C., and Reid, J. P.: Exploring the com-plexity of aerosol particle properties and processes using sin-gle particle techniques, Chem. Soc. Rev., p. Advance article, doi:10.1039/C2CS35082C, 2012.
Kundu, S., Fisseha, R., Putman, A. L., Rahn, T. A., and Maz-zoleni, L. R.: High molecular weight SOA formation during limonene ozonolysis: insights from ultrahigh-resolution FT-ICR mass spectrometry characterization, Atmos. Chem. Phys., 12, 5523–5536, doi:10.5194/acp-12-5523-2012, 2012.
Lambe, A. T., Ahern, A. T., Williams, L. R., Slowik, J. G., Wong, J. P. S., Abbatt, J. P. D., Brune, W. H., Ng, N. L., Wright, J. P., Croasdale, D. R., Worsnop, D. R., Davidovits, P., and Onasch, T. B.: Characterization of aerosol photooxidation flow reactors: het-erogeneous oxidation, secondary organic aerosol formation and cloud condensation nuclei activity measurements, Atmos. Meas. Tech., 4, 445–461, doi:10.5194/amt-4-445-2011, 2011a. Lambe, A. T., Onasch, T. B., Massoli, P., Croasdale, D. R., Wright,
J. P., Ahern, A. T., Williams, L. R., Worsnop, D. R., Brune, W. H.,
and Davidovits, P.: Laboratory studies of the chemical composi-tion and cloud condensacomposi-tion nuclei (CCN) activity of secondary organic aerosol (SOA) and oxidized primary organic aerosol (OPOA), Atmos. Chem. Phys., 11, 8913–8928, doi:10.5194/acp-11-8913-2011, 2011b.
Lambe, A. T., Onasch, T. B., Croasdale, D. R., Wright, J. P., Mar-tin, A. T., Franklin, J. P., Massoli, P., Kroll, J. H., Canagaratna, M. R., Brune, W. H., Worsnop, D. R., and Davidovits, P.: Transi-tions from Functionalization to Fragmentation ReacTransi-tions of Lab-oratory Secondary Organic Aerosol (SOA) Generated from the OH Oxidation of Alkane Precursors, Environ. Sci. Technol., 46, 5430–5437, doi:10.1021/es300274t, 2012.
Lance, S., Nenes, A., Medina, J., and Smith, J. N.: Map-ping the Operation of the DMT Continuous Flow CCN Counter, Aerosol Science and Technology, 40, 242–254, doi:10.1080/02786820500543290, 2006.
Mao, J., Ren, X., Brune, W. H., Olson, J. R., Crawford, J. H., Fried, A., Huey, L. G., Cohen, R. C., Heikes, B., Singh, H. B., Blake, D. R., Sachse, G. W., Diskin, G. S., Hall, S. R., and Shetter, R. E.: Airborne measurement of OH reactivity during INTEX-B, Atmos. Chem. Phys., 9, 163–173, doi:10.5194/acp-9-163-2009, 2009.
Marcolli, C. and Krieger, U.: Phase changes during hygroscopic cy-cles of mixed organic/inorganic model systems of tropospheric aerosols, J. Phys. Chem. A, 110, 1881–1893, 2006.
Massoli, P., Lambe, A., Ahern, A., Williams, L., Ehn, M., Mikkilä, J., Canagaratna, M., Brune, W., Onasch, T., Jayne, J., Petäjä, T., Kulmala, M., A., L., Kolb, C. E., Davidovits, P., and Worsnop, D.: Relationship between aerosol oxidation level and hygroscopic properties of laboratory generated secondary or-ganic aerosol (SOA) particles, Geophys. Res. Lett, 37, L24801, doi:10.1029/2010GL045258, 2010.
Mikhailov, E., Vlasenko, S., Martin, S. T., Koop, T., and Pöschl, U.: Amorphous and crystalline aerosol particles interacting with water vapor: conceptual framework and experimental evidence for restructuring, phase transitions and kinetic limitations, At-mos. Chem. Phys., 9, 9491–9522, doi:10.5194/acp-9-9491-2009, 2009.
Murray, B., Wilson, T., Dobbie, S., Cui, Z., Al-Jumur, S., Möhler, O., Schnaiter, M., Wagner, R., Benz, S., Niemand, M., et al.: Het-erogeneous nucleation of ice particles on glassy aerosols under cirrus conditions, Nature Geosci., 3, 233–237, 2010.
Murray, B. J.: Inhibition of ice crystallisation in highly viscous aqueous organic acid droplets, Atmos. Chem. Phys., 8, 5423– 5433, doi:10.5194/acp-8-5423-2008, 2008.
Ng, N. L., Canagaratna, M. R., Zhang, Q., Jimenez, J. L., Tian, J., Ulbrich, I. M., Kroll, J. H., Docherty, K. S., Chhabra, P. S., Bahreini, R., Murphy, S. M., Seinfeld, J. H., Hildebrandt, L., Donahue, N. M., DeCarlo, P. F., Lanz, V. A., Prévôt, A. S. H., Dinar, E., Rudich, Y., and Worsnop, D. R.: Organic aerosol components observed in Northern Hemispheric datasets from Aerosol Mass Spectrometry, Atmos. Chem. Phys., 10, 4625– 4641, doi:10.5194/acp-10-4625-2010, 2010.
Nielsen, L. E.: Cross-Linking-Effect on Physical Properties of Poly-mers, Journal of Macromolecular Science, Part C: Polymer Re-views, 3, 69–103, doi:10.1080/15583726908545897, 1969. Pankow, J.: An absorption model of the gas/aerosol partitioning
Pedernera, D. A.: Glass formation in upper tropospheric aerosol particles, Ph.D. thesis, Bielefeld University, http://pub. uni-bielefeld.de/publication/2303351, 2008 (in German). Perraud, V., Bruns, E. A., Ezell, M. J., Johnson, S. N.,
Yu, Y., Alexander, M. L., Zelenyuk, A., Imre, D., Chang, W. L., Dabdub, D., Pankow, J. F., and Finlayson-Pitts, B. J.: Nonequilibrium atmospheric secondary organic aerosol for-mation and growth, P. Natl. Acad. Sci., 109, 2836–2841, doi:10.1073/pnas.1119909109, 2012.
Petters, M. D. and Kreidenweis, S. M.: A single parameter repre-sentation of hygroscopic growth and cloud condensation nucleus activity, Atmos. Chem. Phys., 7, 1961–1971, doi:10.5194/acp-7-1961-2007, 2007.
Pfrang, C., Shiraiwa, M., and Pöschl, U.: Chemical ageing and transformation of diffusivity in semi-solid multi-component or-ganic aerosol particles, Atmos. Chem. Phys., 11, 7343–7354, doi:10.5194/acp-11-7343-2011, 2011.
Prenni, A., Petters, M., Kreidenweis, S., DeMott, P., and Ziemann, P.: Cloud droplet activation of secondary organic aerosol, J. Geo-phys. Res., 112, D10223, doi:10.1029/2006JD007963, 2007. Renbaum, L. H. and Smith, G. D.: Artifacts in measuring aerosol
uptake kinetics: the roles of time, concentration and adsorption, Atmos. Chem. Phys., 11, 6881–6893, doi:10.5194/acp-11-6881-2011, 2011.
Rietsch, F., Daveloose, D., and Froelich, D.: Glass transition tem-perature of ideal polymeric networks, Polymer, 17, 859–863, doi:10.1016/0032-3861(76)90251-2, 1976.
Roberts, G. and Nenes, A.: A continuous-flow streamwise thermal-gradient CCN chamber for atmospheric measurements, Aerosol Sci. Technol., 39, 206–221, 2005.
Saukko, E., Kuuluvainen, H., and Virtanen, A.: A method to resolve the phase state of aerosol particles, Atmos. Meas. Tech., 5, 259– 265, doi:10.5194/amt-5-259-2012, 2012.
Seinfeld, J. and Pandis, S.: Atmospheric chemistry and physics: from air pollution to climate change, Wiley New York, 2nd edn., 1998.
Shiraiwa, M., Ammann, M., Koop, T., and Pöschl, U.: Gas up-take and chemical aging of semisolid organic aerosol particles, Proceedings of the National Academy of Sciences, 108, 11003– 11008, doi:10.1073/pnas.1103045108, 2011.
Sipilä, M., Berndt, T., Petäjä, T., Brus, D., Vanhanen, J., Strat-mann, F., Patokoski, J., Mauldin, R. L., Hyvärinen, A.-P., Lihavainen, H., and Kulmala, M.: The Role of Sulfuric Acid in Atmospheric Nucleation, Science, 327, 1243–1246, doi:10.1126/science.1180315, 2010.
Song, M., Marcolli, C., Krieger, U. K., Zuend, A., and Peter, T.: Liquid-liquid phase separation and morphology of internally mixed dicarboxylic acids/ammonium sulfate/water particles, At-mos. Chem. Phys., 12, 2691–2712, doi:10.5194/acp-12-2691-2012, 2012.
Tolocka, M. P., Jang, M., Ginter, J. M., Cox, F. J., Kamens, R. M., and Johnston, M. V.: Formation of Oligomers in Sec-ondary Organic Aerosol, Environ. Sci. Technol., 38, 1428–1434, doi:10.1021/es035030r, 2004.
Vaden, T. D., Imre, D., Beránek, J., Shrivastava, M., and Zelenyuk, A.: Evaporation kinetics and phase of laboratory and ambient secondary organic aerosol, P. Natl. Acad. Sci., 108, 2190–2195, doi:10.1073/pnas.1013391108, 2011.
Varutbangkul, V., Brechtel, F. J., Bahreini, R., Ng, N. L., Keywood, M. D., Kroll, J. H., Flagan, R. C., Seinfeld, J. H., Lee, A., and Goldstein, A. H.: Hygroscopicity of secondary organic aerosols formed by oxidation of cycloalkenes, monoterpenes, sesquiter-penes, and related compounds, Atmos. Chem. Phys., 6, 2367– 2388, doi:10.5194/acp-6-2367-2006, 2006.
Virtanen, A., Joutsensaari, J., Koop, T., Kannosto, J., Yli-Pirilä, P., Leskinen, J., Mäkelä, J., Holopainen, J., Pöschl, U., Kulmala, M., Worsnop, D. R., and Laaksonen, A.: An amorphous solid state of biogenic secondary organic aerosol particles, Nature, 467, 824– 827, 2010.
Virtanen, A., Kannosto, J., Kuuluvainen, H., Arffman, A., Joutsen-saari, J., Saukko, E., Hao, L., Yli-Pirilä, P., Tiitta, P., Holopainen, J. K., Keskinen, J., Worsnop, D. R., Smith, J. N., and Laaksonen, A.: Bounce behavior of freshly nucleated biogenic secondary organic aerosol particles, Atmos. Chem. Phys., 11, 8759–8766, doi:10.5194/acp-11-8759-2011, 2011.
Zahardis, J. and Petrucci, G. A.: The oleic acid-ozone heteroge-neous reaction system: products, kinetics, secondary chemistry, and atmospheric implications of a model system – a review, At-mos. Chem. Phys., 7, 1237–1274, doi:10.5194/acp-7-1237-2007, 2007.
Ziemann, P.: Atmospheric Chemistry: Phase matters for aerosols, Nature, 467, 797–798, 2010.
Zobrist, B., Marcolli, C., Pedernera, D. A., and Koop, T.: Do atmo-spheric aerosols form glasses?, Atmos. Chem. Phys., 8, 5221– 5244, doi:10.5194/acp-8-5221-2008, 2008.
Zobrist, B., Soonsin, V., Luo, B. P., Krieger, U. K., Marcolli, C., Peter, T., and Koop, T.: Ultra-slow water diffusion in aque-ous sucrose glasses, Phys. Chem. Chem. Phys., 13, 3514–3526, doi:10.1039/C0CP01273D, 2011.