www.atmos-chem-phys.net/17/143/2017/ doi:10.5194/acp-17-143-2017
© Author(s) 2017. CC Attribution 3.0 License.
Study of the footprints of short-term variation in
XCO
2
observed by TCCON sites using NIES and
FLEXPART atmospheric transport models
Dmitry A. Belikov1,2,3,a, Shamil Maksyutov1, Alexander Ganshin3,4, Ruslan Zhuravlev3,4, Nicholas M. Deutscher5,6, Debra Wunch7, Dietrich G. Feist8, Isamu Morino1, Robert J. Parker9, Kimberly Strong10, Yukio Yoshida1,
Andrey Bril11, Sergey Oshchepkov11, Hartmut Boesch9, Manvendra K. Dubey12, David Griffith5, Will Hewson9, Rigel Kivi13, Joseph Mendonca10, Justus Notholt6, Matthias Schneider14, Ralf Sussmann15, Voltaire A. Velazco5, and Shuji Aoki16
1National Institute for Environmental Studies, Tsukuba, Japan 2National Institute of Polar Research, Tokyo, Japan
3Faculty of Mechanics and Mathematics, Tomsk State University, Tomsk, Russia 4Central Aerological Observatory, Dolgoprudny, Russia
5Centre for Atmospheric Chemistry, School of Chemistry, University of Wollongong, Wollongong, NSW, Australia 6Institute of Environmental Physics, University of Bremen, Bremen, Germany
7California Institute of Technology, Pasadena, CA, USA 8Max Planck Institute for Biogeochemistry, Jena, Germany 9Earth Observation Science, University of Leicester, Leicester, UK 10Department of Physics, University of Toronto, Toronto, ON, Canada 11Institute of Physics of the National Academy of Sciences, Minsk, Belarus
12Earth System Observations, Los Alamos National Laboratory, Los Alamos, New Mexico 13Finnish Meteorological Institute, Sodankylä, Finland
14Agencia Estatal de Meteorología (AEMET), CIAI, Santa Cruz de Tenerife, Spain 15Karlsruhe Institute of Technology, IMK-IFU, Garmisch-Partenkirchen, Germany
16Center for Atmospheric and Oceanic Studies, Graduate School of Science, Tohoku University, Sendai, Japan acurrently at: Faculty of Environmental Earth Science, Hokkaido University, Sapporo, Japan
Correspondence to:Dmitry A. Belikov ([email protected]) Received: 8 March 2016 – Published in Atmos. Chem. Phys. Discuss.: 4 May 2016 Revised: 25 November 2016 – Accepted: 1 December 2016 – Published: 3 January 2017
Abstract. The Total Carbon Column Observing Network
(TCCON) is a network of ground-based Fourier transform spectrometers (FTSs) that record near-infrared (NIR) spec-tra of the sun. From these specspec-tra, accurate and precise ob-servations of CO2 column-averaged dry-air mole fractions (denoted XCO2) are retrieved. TCCON FTS observations have previously been used to validate satellite estimations of XCO2; however, our knowledge of the short-term spatial and temporal variations in XCO2surrounding the TCCON sites is limited.
ap-proach with a standard geographic method shows a higher number of collocation points and an average bias reduction up to 0.15 ppm for a subset of 16 stations for the period from January 2010 to January 2014. Case studies of the Dar-win and Reunion Island sites reveal that when the footprint area is rather curved, non-uniform and significantly differ-ent from a geographical rectangular area, the differences be-tween these approaches are more noticeable. This empha-sises that the collocation is sensitive to local meteorological conditions and flux distributions.
1 Introduction
Satellite observations of the column-averaged dry-air mole fraction of CO2 (XCO2) have the potential to significantly advance our knowledge of carbon dioxide (CO2) distri-butions globally and provide new information on regional CO2 sources and sinks. Observations of XCO2 are avail-able from space-based instruments such as the SCanning Imaging Absorption spectroMeter for Atmospheric CHartog-raphY (SCIAMACHY; data available for the period 2002– 2012; Bovensmann et al., 1999), the Greenhouse Gases Ob-serving Satellite (GOSAT; data available since 2009; Kuze et al., 2009, 2016; Yokota et al., 2009) and the Orbiting Car-bon Observatory-2 (OCO-2; available since the middle of 2014; Crisp et al., 2004). These satellites provide unprece-dented spatial coverage of the variability in XCO2 around the world, with the exception of polar regions and areas with dense clouds. These observations are, however, limited by the orbit of the satellites, which typically measure in the lo-cal afternoon.
Ground-based Fourier transform spectrometer (FTS) ob-servations available from the Total Carbon Column Observ-ing Network (TCCON) (Deutscher et al., 2010; Geibel et al., 2010; Messerschmidt et al., 2010, 2012; Ohyama et al., 2009; Washenfelder et al., 2006; Wunch et al., 2011, 2015) provide dense temporal resolution and are more precise and accurate than space-based instruments. However, the num-ber of ground-based FTS sites is limited, with just 23 oper-ational sites and several approved for the future. These sites are sparsely distributed, and Siberia, Africa, South America and the oceans from middle to high latitudes are poorly cov-ered. Despite this limitation, FTS observations are used to validate satellite retrievals in order to assess bias, variability and other key parameters (e.g. Wunch et al., 2011; Lindqvist et al., 2015).
The spatial and temporal coverage of satellite observa-tions over TCCON sites is sparse in space and time due to cloud and aerosol filters, retrieval selection criteria and post-retrieval data quality filters. To obtain satellite observa-tion data at the locaobserva-tion and time of interest it is necessary to apply a collocation method for aggregating neighbouring soundings. All collocation methodologies implement
inter-polation techniques. It is important to minimise the interpo-lation errors, which cause an uncertainty that is incorporated into the variability of the colocated/validation data compar-ison (Nguyen et al., 2014). Currently available methods for XCO2 collocation include geographical (e.g. Cogan et al., 2012; Inoue et al., 2013; Reuter et al., 2013), T700 (it im-plies that the air with the same history of transport derived from the 700 hPa potential temperature has the same XCO2; Wunch et al., 2011), model-based (Guerlet et al., 2013) and geostatistical approaches (Nguyen et al., 2014).
In the geographical collocation method a spatial region around a TCCON site is selected together with a temporal window for selecting the satellite data. Inoue et al. (2013) used daily mean observations within a 10◦×10◦area, Reuter
et al. (2013) selected the monthly median of all observa-tions within a 10◦×10◦ area, and Cogan et al. (2012)
im-plemented narrower limits, using a 2 h mean period within a
±5◦× ±5◦area.
To increase the number of soundings, the spatial region may be expanded and additional selection criteria imposed. In the T700 collocation method proposed by Wunch et al. (2011), all observations within±30◦longitude,±10◦
lat-itude, and±2 K of the selected TCCON location and within ±5 days window are employed.
The model-based method proposed by Oshchepkov et al. (2012) and improved by Guerlet et al. (2013) uses daily mean values within 0.5 ppm of the 3-day-averaged model XCO2 values and is located within ±25◦ longitude and ±7.5◦latitude of a TCCON site.
Nguyen et al. (2014) developed a geostatistical colloca-tion methodology that selects observacolloca-tions using a “distance” function, which is a modified Euclidian distance in terms of latitude, longitude, time and mid-tropospheric temperature at 700 hPa.
The majority of collocation methods described above have a common disadvantage; i.e. they work with a rectangu-lar spatial domain, which is convenient for technical han-dling but does not reflect the impact of surface sources or sinks of CO2 and the local meteorology in the area of in-terest. The spatial domains in collocations should take into account these features to ensure that only appropriate ob-servations are selected. Keppel-Aleks et al. (2011, 2012) showed that the largest gradient in XCO2is formed mainly by the north–south flux distribution, with variations in XCO2 caused mainly by large-scale advection. TCCON and satel-lite XCO2observations have pronounced temporal variabil-ity and are thus important in studies of short-term variations in XCO2.
The remainder of this paper is organised as follows: an overview of the method for estimating the footprints of TC-CON sites is presented in Sect. 2. The results of the footprint estimation and a new method for collocation are presented and discussed in Sects. 3 and 4, and the conclusions are given in Sect. 5.
2 Method
To estimate the footprints of TCCON sites we used forward simulations employing the NIES Eulerian three-dimensional transport model (TM) and backward trajectory tracking using the FLEXPART LPDM model.
The key features of the NIES TM are as follows: a reduced horizontal latitude–longitude grid with a spatial resolution of 2.5◦×2.5◦near the equator (Belikov et al., 2011), a vertical
flexible hybrid sigma–isentropic (σ–θ) grid with 32 levels up
to the level of 5 hPa (Belikov et al., 2013b), separate param-eterisation of the turbulent diffusivity in the PBL and free troposphere (provided by the European Centre for Medium-Range Weather Forecasts (ECMWF) ERA-Interim reanaly-sis) and a modified Kuo-type parameterisation scheme for cumulus convection (Belikov et al., 2013a).
The NIES model has previously been used to study the seasonal and interannual variability in CO2. Belikov at al. (2013b) reported that the NIES model is able to success-fully reproduce the vertical profile of CO2as well as the sea-sonal and interannual variability in XCO2. A comparison of modelled output with TCCON observations (Belikov et al., 2013b) revealed model biases of±0.2 % for XCO2; on this
basis we assume that the NIES TM is able to successfully reproduce the vertical profile of CO2at the locations of TC-CON sites.
Firstly we run NIES TM for the target period (Jan-uary 2010–Febr(Jan-uary 2011) using 10 year’s spin-up to ensure reduction of initialization errors. Then NIES TM CO2 con-centrations sampled at the location of TCCON sites at the level of 1 km above ground at 13:00 local time were used to initialise backward tracer simulations with the FLEXPART model.
FLEXPART is used to identify the source–receptor rela-tionship of the CO2tracer. The CO2emission is the “source”, and the TCCON site is the “receptor”. Like other Lagrangian particle dispersion models (LPDMs), FLEXPART approxi-mates a plume of atmospheric tracer by a cloud of parti-cles. An efficient way of calculating sensitivity at the re-ceptor is by solving the adjoint equation of tracer transport, which requires backward transport (Hourdin and Talagrand, 2006). Lagrangian models provide a efficient tool for back-ward transport modelling of a compact plume of particles, one plume representing a single observation. By tracking the pathway of each individual particle back in time and count-ing the particle residence times in the mixed layer at each grid cell the sensitivity coefficient or the footprint can be obtained
(Stohl et al., 2009). The sensitivitySof CO2concentrationC to emissionsFis the ratio of the change inCto an incremen-tal change ofF:S=∂C/ ∂F. Surface emissions change the concentration in the surface layer, while FLEXPART sensi-tivity to concentration in a surface grid cell at a given time is given by the number of particles that reside in the each surface grid cell divided by the total number of particles re-leased.
The level of 1 km above ground typically corresponds to the top of the daytime planetary boundary layer (PBL). The PBL is the lowest part of the atmosphere and its behaviour is directly influenced by its contact with the planetary surface. Turbulence causes intensive vertical mixing of the air within the PBL, so CO2released from the surface is roughly uni-formly distributed throughout the column of air in the PBL at local noon, when the maximum extent of vertical mix-ing occurs. The selected samplmix-ing time is also favourable for minimising errors in the initial CO2concentration calculated by NIES TM, as this type of chemical transport model has proved to be successful in resolving the diurnal vertical pro-files of tracers (Belikov et al., 2013a).
To run the NIES TM and FLEXPART models we use fluxes obtained with the GELCA-EOF (Global Eulerian– Lagrangian Coupled Atmospheric model with Empirical Or-thogonal Function) inverse modelling scheme (Zhuravlev et al., 2013). A priori fluxes consist of four types:
1. the Open-source Data Inventory of Anthropogenic CO2 (ODIAC) (Oda et al., 2011) and the Carbon Dioxide Information Analysis Center’s (CDIAC) (Andres et al., 2011) anthropogenic fluxes;
2. the Vegetation Integrative SImulator for Trace gases (VISIT) (Ito, 2010) biosphere fluxes;
3. the offline Ocean Tracer Transport Model (OTTM) (Valsala et al., 2013) oceanic fluxes;
4. the Global Fire Emissions Database (GFED) (Van der Werf et al., 2010) biomass burning emissions. Both models are driven by the Japanese Meteorological Agency Climate Data Assimilation System (JCDAS) data sets (Onogi et al., 2007).
Variations in TCCON XCO2 are influenced by a large-scale processes. Keppel-Aleks et al. (2012) presented a ro-bust relationship between weekly and monthly aggregated total column CO2 and local net ecosystem exchange, while column drawdown has only a weak correlation with the re-gional flux on daily timescales. Thus the maximum trajectory duration for the FLEXPART was, therefore, set to 1 week. The FLEXPART model was run with resolution of 1◦ and
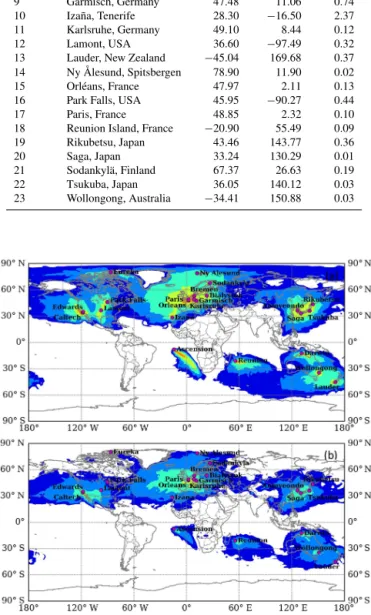
Table 1.Details of operational TCCON sites.
Number Site Latitude Longitude Altitude (degrees) (degrees) (km)
1 Anmyeondo, Korea 36.54 126.33 0.03
2 Ascension Island 7.92 −14.33 0.03
3 Białystok, Poland 53.23 23.03 0.18
4 Bremen, Germany 53.10 8.85 0.03
5 Caltech, USA 34.14 −118.13 0.23
6 Darwin, Australia −12.42 130.89 0.03
7 Edwards, USA 34.96 −117.88 0.70
8 Eureka, Canada 80.05 −86.42 0.61
9 Garmisch, Germany 47.48 11.06 0.74
10 Izaña, Tenerife 28.30 −16.50 2.37
11 Karlsruhe, Germany 49.10 8.44 0.12
12 Lamont, USA 36.60 −97.49 0.32
13 Lauder, New Zealand −45.04 169.68 0.37
14 Ny Ålesund, Spitsbergen 78.90 11.90 0.02
15 Orléans, France 47.97 2.11 0.13
16 Park Falls, USA 45.95 −90.27 0.44
17 Paris, France 48.85 2.32 0.10
18 Reunion Island, France −20.90 55.49 0.09
19 Rikubetsu, Japan 43.46 143.77 0.36
20 Saga, Japan 33.24 130.29 0.01
21 Sodankylä, Finland 67.37 26.63 0.19
22 Tsukuba, Japan 36.05 140.12 0.03
23 Wollongong, Australia −34.41 150.88 0.03
Figure 1.Global distribution of the sensitivity of CO2 concentra-tions (ppm (µmol (m2s)−1)−1) with respect to the concentrations in adjacent cells, calculated using the FLEXPART model with a resolution of 1.0◦for the 23 TCCON operational sites:(a)tracer
simulation initialised at the level of 1000 m,(b)tracer simulation initialised at the level of 3000 m that corresponds to 700 hPa based on the International Standard Atmosphere for dry air.
Figure 2. Distribution of the sensitivity of CO2 concentrations (ppm (µmol (m2s)−1)−1) in Europe with respect to the concentra-tions in adjacent cells, calculated using the FLEXPART model with a resolution of 1.0◦ for TCCON operational sites within Europe,
using a tracer simulation initialised at the level of 1000 m.
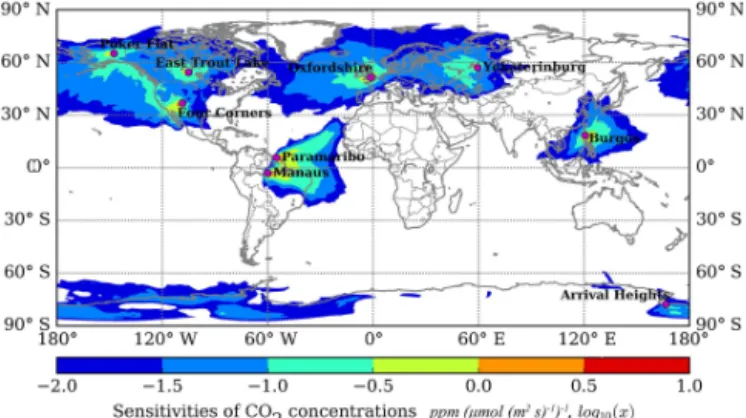
Table 2.Past, future and possible TCCON sites.
Number Site Latitude Longitude Altitude (degrees) (degrees) (km) 1 Arrival Heights, Antarctica −77.83 166.66 0.25
2 Burgos, Philippines 18.50 120.85 0.10 3 East Trout Lake, Canada 54.35 −104.98 0.49 4 Four Corners, USA 36.80 −108.48 1.64
5 Manaus, Brazil −3.10 −60.02 0.09
6 Oxfordshire, UK 51.57 −1.32 0.07
7 Paramaribo, Suriname 5.80 −55.20 0.05
8 Poker Flat, USA 65.12 −147.47 0.21
9 Yekaterinburg, Russia 57.04 59.55 0.30
3 Results
3.1 Sensitivity of TCCON site footprints
We analysed two groups of TCCON sites: operational sites (Table 1; Figs. 1 and 2) and past, future and possible sites (Ta-ble 2; Fig. 3). We included Arrival Heights (Antarctica) and Yekaterinburg (Russia) in the second group, though the status of these monitoring stations is unclear. The footprint estima-tion is restricted to the summer season for high-latitude sites (Arrival Heights, Eureka, Ny Ålesund, Poker Flat and So-dankylä), due to limitations relating to the solar zenith angle.
3.1.1 Operational sites
North America
Figure 3.Global distribution of the sensitivity of CO2 concentra-tions (ppm (µmol (m2s)−1)−1) with respect to the concentrations in adjacent cells, calculated using the FLEXPART model with a res-olution of 1.0◦for 9 past, future and possible TCCON operational
sites, using a tracer simulation initialised at the level of 1000 m.
of North America, the northern part of Canada and Greenland and the eastern part of the Pacific Ocean. There are no TC-CON sites in Alaska or on the east coast of North America, which is a region of intense anthropogenic activity (Fig. 1).
European sites
The European region contains eight operational sites (Fig. 2). We also include Izaña, which does not belong to this region but is located very close to it. This region has a good spatial coverage of operational TCCON sites; however, most sites are located near the coast and are thus very sensitive to the Atlantic and Arctic oceans. The maximum footprint sensitiv-ity occurs in western Europe where there is a high denssensitiv-ity of operational TCCON sites; five sites (Bremen, Garmisch, Karlsruhe, Orléans and Paris) are concentrated within a small area. The sensitivity decreases quite rapidly towards the east and south, and only parts of eastern Europe and northern Africa are covered.
Asia
The footprints of Asian sites mainly span countries border-ing the Sea of Japan, i.e. Japan, Korea, the Russian Far East and eastern China. These sites are also able to capture sig-nals from Mongolia, eastern Siberia and South-east Asia. Although the coverage of these sites is relatively small, the main industrial centres in the region are included.
Australia and New Zealand
The footprint sensitivity of TCCON sites in this region cov-ers almost all of Australia. Chevallier et al. (2011) show that TCCON data could constrain flux estimates over Aus-tralia equally as well as the existing in situ measurements. Our footprint estimations are, however, more sensitive to the
ocean regions between Australia and New Zealand as well as adjacent coastal areas.
Oceanic sites: Ascension Island and Reunion Island
Ascension Island is in the trade wind belt of the tropical Atlantic, ideally located to measure the South Atlantic ma-rine boundary layer. The south-eastern trade winds, which are almost invariant and are derived from the deep South At-lantic Ocean with little contact with Africa. Surface measure-ments of CO2at Ascension Island are used as a background (Gatti et al., 2010). However, above the trade wind inver-sion (TWI), at about 1200–2000 m above sea level, the air masses are very different, coming dominantly from tropical Africa and occasionally South America (Swap et al., 1996). The FLEXPART simulation with tracers released at an alti-tude of 3000 m detected some hotspots in Africa (Fig. 1b). The study of biomass burning in Africa is essential, but lies outside of the scope of this paper.
Reunion Island is situated in the Indian Ocean, about 800 km east of Madagascar. For this site the seasonal trend of wind mainly remains in the easterly sector, so the foot-print covers mainly ocean regions. The Reunion Island site is further discussed in Sect. 4.3.2.
3.1.2 Past, future and possible TCCON sites
The footprints of past, future and possible TCCON sites are presented in Fig. 3. The Oxfordshire site enhances the sen-sitivity of the region, which is already well covered by ex-isting TCCON sites in Europe. The East Trout Lake, Four Corners and Poker Flat sites fill sensitivity gaps in the Cana-dian boreal forest, the south-western US, northern Mexico and Alaska. Nevertheless, there are no TCCON sites near the Atlantic coast of North America, which is a key region of interest.
In South America, the Manaus site (briefly in operation during 2014 and will operate after reconstruction) was ide-ally located in central Amazonia. However, meteorological conditions meant that a signal was only detected in a very narrow section towards the east. Observations at this site are more sensitive to anthropogenic activity on the Atlantic coast of South America, compared with the surrounding Amazo-nian biosphere. Additional use of CO observations will be necessary to isolate the net primary production signal in central Amazonia (Keppel-Aleks et al., 2012). Another site in this region is Paramaribo, located in Suriname, which is part of Caribbean South America. The footprint of the Para-maribo site is narrowly focused towards the Atlantic Ocean due to site location and meteorological conditions as stated above.
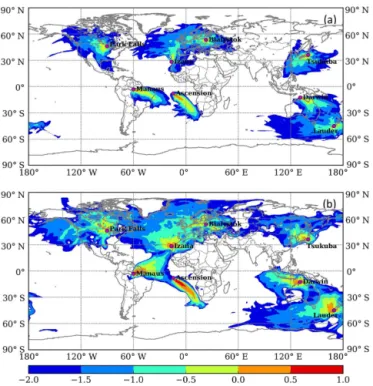
Figure 4.Footprints for different seasons for Ascension Island, Bi-ałystok, Darwin, Izaña, Manaus, Park Falls and Tsukuba, for(a)the summer (June, July and August) of 2010 and(b)the winter (De-cember, January and February) of 2010–2011.
TCCON domains. The Arrival Heights site is located on the Antarctic coast and currently cannot be used for satellite data validation. Given the air circulation near the South Pole, this site can be useful for measuring the background value of XCO2.
In general, the operational stations cover some regions well (North America, Europe, the Far East, South-east Asia, Australia and New Zealand), and the planned sites will im-prove this coverage. However, on a global scale there are ma-jor gaps that highlight the difficulty in generalising the avail-able data along latitude for bias correction.
The short-term variations in CO2in the near surface and free troposphere (< 3000 m) have the same form, but different intensities (Fig. 1b), as a smaller number of tracers from the middle troposphere reached the surface during the simulation time.
Seasonal variability in footprints
Some TCCON stations have strong seasonal variations in their footprint due to changes in wind direction, i.e. Białys-tok, Darwin, Izaña, Park Falls and Tsukuba (Fig. 4). For other sites (e.g. Ascension Island and Manaus) the weather con-ditions are less variable throughout the year. The depth of the PBL changes with season and is thus an important factor that influences the footprint. In winter weak vertical mixing causes the shallow PBL. This leads to enhanced horizontal tracer transport and a wider spatial coverage of the footprints.
Figure 5.Monthly average residuals of modelled XCO2compared with TCCON ground-based FTS for methods C1, C4, C5 and C8, for(a)Darwin and(b)Garmisch.
4 Applying the model-derived footprints to the collocation of XCO2
In the next two sections we assess the performance of the footprint-based method of collocating TCCON XCO2 against the NIES model and GOSAT product data sets. The collocation domain size for each site is determined by sen-sitivity values (ppm (µmol (m2s)−1)−1) with the limits of
log10(x) equal to −0.5, −1.0, −1.5 and −2.0 (cases C1–
C4). These sensitivity values were selected to approximately correspond to the domain sizes in standard geographical col-location techniques, which have rectangular dimensions of 2.5◦×2.5◦,±5.0◦
× ±5.0◦, ±5.0◦
× ±10.0◦ and ±7.5◦
× ±22.5◦ (cases C5–C8). Only coincident observations were
used, and observations with differences of≥3 ppm were
dis-carded from the comparison. The considered period for com-parison is January 2010 and January 2014.
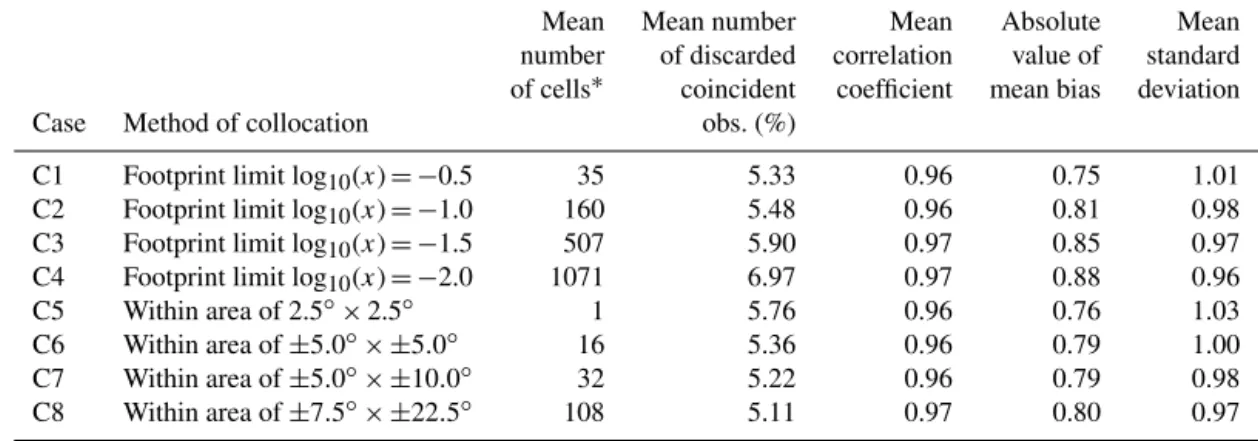
Table 3.Averaged results of different collocation methods implemented for XCO2from NIES TM calculated for 16 TCCON sites.
Mean Mean number Mean Absolute Mean number of discarded correlation value of standard of cells∗ coincident coefficient mean bias deviation
Case Method of collocation obs. (%)
C1 Footprint limit log10(x)= −0.5 35 5.33 0.96 0.75 1.01 C2 Footprint limit log10(x)= −1.0 160 5.48 0.96 0.81 0.98 C3 Footprint limit log10(x)= −1.5 507 5.90 0.97 0.85 0.97 C4 Footprint limit log10(x)= −2.0 1071 6.97 0.97 0.88 0.96 C5 Within area of 2.5◦×2.5◦ 1 5.76 0.96 0.76 1.03
C6 Within area of±5.0◦× ±5.0◦ 16 5.36 0.96 0.79 1.00 C7 Within area of±5.0◦× ±10.0◦ 32 5.22 0.96 0.79 0.98 C8 Within area of±7.5◦× ±22.5◦ 108 5.11 0.97 0.80 0.97
∗The number of FLEXPART cells with resolution 1.0◦×1.0◦is counted for methods based on the footprint (1–4), while for other methods
NIES TM cells (2.5◦×2.5◦) are used.
Table 4.Averaged results of different collocation methods implemented for XCO2from the GOSAT ACOS product calculated for 16 TCCON sites.
Mean Mean number Mean Absolute Mean number of of discarded correlation value of standard observations coincident coefficient mean bias deviation Case Method of collocation obs. (%)
C1 Footprint limit log10(x)= −0.5 1190 9.85 0.93 0.65 1.18 C2 Footprint limit log10(x)= −1.0 3046 7.75 0.92 0.61 1.21 C3 Footprint limit log10(x)= −1.5 4880 7.82 0.93 0.62 1.15 C4 Footprint limit log10(x)= −2.0 6016 7.06 0.93 0.64 1.12 C5 Within area of 2.5◦×2.5◦ 976 10.29 0.93 0.81 1.11
C6 Within area of±5.0◦× ±5.0◦ 2042 8.68 0.92 0.67 1.19 C7 Within area of±5.0◦× ±10.0◦ 3111 8.18 0.92 0.65 1.19 C8 Within area of±7.5◦× ±22.5◦ 5002 7.27 0.93 0.64 1.16
observations were obtained from the 2014 release of TCCON data (GGG2014), available from the TCCON Data Archive (http://tccon.ornl.gov).
4.1 Collocation of XCO2from TCCON and the NIES
model
The TCCON and NIES TM data sets are initially compared using a geographical collocation of 2.5◦×2.5◦, which
corre-sponds to selecting the nearest NIES TM cell (Table 3). The resolution of the model grid is rather coarse, so we observe that the results depend mainly on the size of the collocation area but not on the form. As the size of the collocation area increases, the correlation between XCO2from TCCON and NIES TM slightly increases from 0.96 to 0.97 and the stan-dard deviation decreases from 1.1 to 0.96 ppm. This is due to an increase in the number of observations.
There are several reasons for the larger discrepancy (≥3 ppm) of GOSAT observations. Systematic errors due to
imperfect characterisation of clouds and aerosols dominate the error budget. Other effects, such as spectroscopy errors, pointing errors, imperfect radiometric and spectral
charac-terisation of the instrument are clearly present in retrievals. Additional real-world issues, such as forest canopy effects, partial cloudiness, cloud shadows and plant fluorescence will further increase the retrieval errors (O’Dell et al., 2012). The mean number of discarded coincident observation is about 5–7 %.
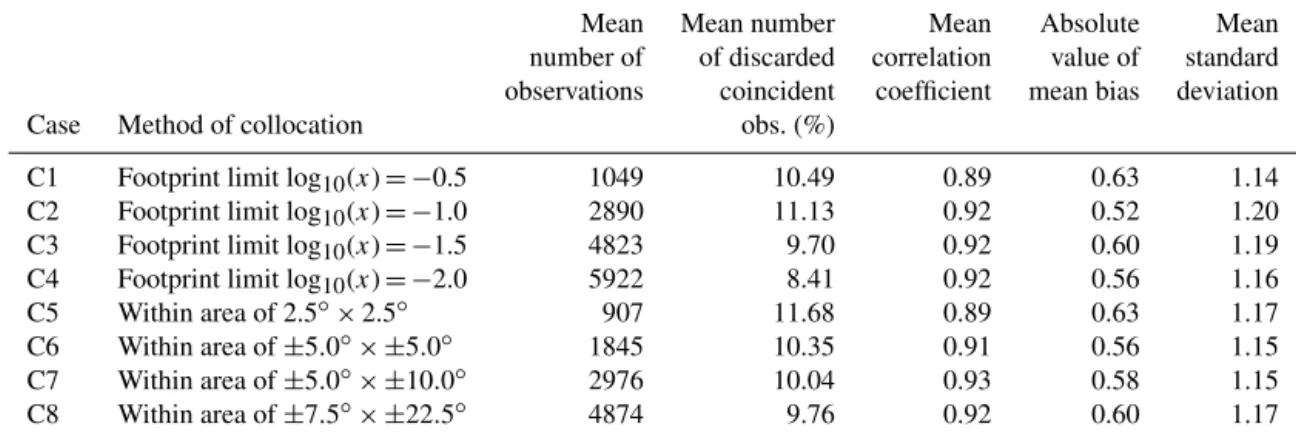
Table 5.Averaged results of different collocation methods implemented for XCO2from the GOSAT NIES product calculated for 16 TCCON sites.
Mean Mean number Mean Absolute Mean number of of discarded correlation value of standard observations coincident coefficient mean bias deviation Case Method of collocation obs. (%)
C1 Footprint limit log10(x)= −0.5 1049 10.49 0.89 0.63 1.14 C2 Footprint limit log10(x)= −1.0 2890 11.13 0.92 0.52 1.20 C3 Footprint limit log10(x)= −1.5 4823 9.70 0.92 0.60 1.19 C4 Footprint limit log10(x)= −2.0 5922 8.41 0.92 0.56 1.16 C5 Within area of 2.5◦×2.5◦ 907 11.68 0.89 0.63 1.17
C6 Within area of±5.0◦× ±5.0◦ 1845 10.35 0.91 0.56 1.15 C7 Within area of±5.0◦× ±10.0◦ 2976 10.04 0.93 0.58 1.15 C8 Within area of±7.5◦× ±22.5◦ 4874 9.76 0.92 0.60 1.17
Table 6.Averaged results of different collocation methods implemented for XCO2from the GOSAT PPDF product calculated for 16 TCCON sites.
Mean Mean number Mean Absolute Mean number of of discarded correlation value of standard observations coincident coefficient mean bias deviation Case Method of collocation obs. (%)
C1 Footprint limit log10(x)= −0.5 357 7.80 0.84 0.50 1.11 C2 Footprint limit log10(x)= −1.0 870 9.07 0.86 0.62 1.12 C3 Footprint limit log10(x)= −1.5 1536 7.81 0.81 0.73 1.16 C4 Footprint limit log10(x)= −2.0 1911 6.46 0.81 0.67 1.17 C5 Within area of 2.5◦×2.5◦ 331 7.02 0.86 0.66 1.02
C6 Within area of±5.0◦× ±5.0◦ 749 7.53 0.85 0.64 1.15 C7 Within area of±5.0◦× ±10.0◦ 1114 8.46 0.83 0.69 1.19 C8 Within area of±7.5◦× ±22.5◦ 1733 7.43 0.86 0.68 1.17
4.2 Collocation of XCO2from TCCON and GOSAT
products
A comparison of collocation methods was performed for five GOSAT XCO2 products: NIES v02.11 (Yoshida et al., 2013) and the photon path length probability density function method retrievals (PPDF-S v02.11; Oshchepkov et al., 2013) from the NIES, Japan; the NASA Atmo-spheric CO2Observations from Space retrieval (ACOS B3.4; O’Dell et al., 2012); the Netherlands Institute for Space Research/Karlsruhe Institute of Technology, Germany (Re-moTeC v2.11; Butz et al., 2011; Guerlet et al., 2013); and the University of Leicester Full Physics retrieval (UoL-FP v4; Boesch et al., 2011; Cogan et al., 2012). The mean percent-age of discarded coincident TCCON–GOSAT observation is around 7–14 %. Results from PPDF and UoL-FP methods are closer to lower and upper limits.
The results of the comparison of eight collocation meth-ods employed for the five GOSAT XCO2products are pre-sented in Tables 4–8. Only coincident observations were used, and observations with differences of≥3 ppm were
dis-carded from the comparison. The number of observations
se-lected for collocation between the methods with the small-est areas (C1 and C5) and largsmall-est areas (C4 and C8) differs approximately by a factor of 5. There is, however, no clear dependence of the collocation efficiency on the number of observations. The correlation coefficient and standard devi-ation are within 0.81–0.93 and 1.02–1.22 ppm, respectively, regardless of the method used. Mean bias values are within 0.50–0.87 ppm, with the footprint method typically having a slightly lower bias by 0.02–0.15 ppm and a higher number of collocations. For individual stations, these statistics may lie slightly outside the specified ranges.
4.3 Case study
In this section we demonstrate the developed collocation method for GOSAT observations over the Darwin and Re-union Island TCCON sites.
4.3.1 Darwin site
Table 7.Averaged results of different collocation methods implemented for XCO2from the GOSAT RemoTeC product calculated for 16 TCCON sites.
Mean Mean number Mean Absolute Mean number of of discarded correlation value of standard observations coincident coefficient mean bias deviation Case Method of collocation obs. (%)
C1 Footprint limit log10(x)= −0.5 795 10.20 0.81 0.71 1.17 C2 Footprint limit log10(x)= −1.0 1898 9.63 0.83 0.66 1.19 C3 Footprint limit log10(x)= −1.5 3212 9.19 0.83 0.61 1.22 C4 Footprint limit log10(x)= −2.0 4091 8.12 0.83 0.59 1.21 C5 Within area of 2.5◦×2.5◦ 769 11.20 0.90 0.87 1.15
C6 Within area of±5.0◦× ±5.0◦ 1491 9.91 0.85 0.63 1.18 C7 Within area of±5.0◦× ±10.0◦ 2325 9.46 0.86 0.70 1.19 C8 Within area of±7.5◦× ±22.5◦ 3818 8.57 0.86 0.64 1.25
Table 8.Averaged results of different collocation methods implemented for XCO2 from the GOSAT UoL-FP product calculated for 16 TCCON sites.
Mean Mean number Mean Absolute Mean number of of discarded correlation value of standard observations coincident coefficient mean bias deviation Case Method of collocation obs. (%)
C1 Footprint limit log10(x)= −0.5 634 11.04 0.88 0.78 1.31 C2 Footprint limit log10(x)= −1.0 1454 12.78 0.87 0.76 1.34 C3 Footprint limit log10(x)= −1.5 2450 10.88 0.88 0.80 1.28 C4 Footprint limit log10(x)= −2.0 3017 10.22 0.89 0.70 1.23 C5 Within area of 2.5◦×2.5◦ 629 11.90 0.86 0.73 1.33
C6 Within area of±5.0◦× ±5.0◦ 1215 13.15 0.88 0.76 1.30 C7 Within area of±5.0◦× ±10.0◦ 1852 13.58 0.86 0.74 1.27 C8 Within area of±7.5◦× ±22.5◦ 2799 11.93 0.85 0.72 1.25
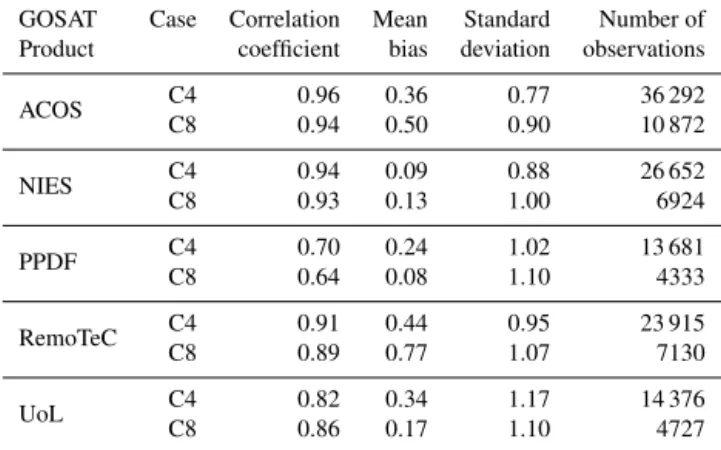
Table 9. Comparison of collocation methods C4 and C8 using ACOS, NIES, PPDF, RemoTeC and UoL GOSAT products near the Darwin site.
GOSAT Case Correlation Mean Standard Number of Product coefficient bias deviation observations
ACOS C4C8 0.960.94 0.360.50 0.770.90 36 29210 872
NIES C4C8 0.940.93 0.090.13 0.881.00 26 6526924
PPDF C4C8 0.700.64 0.240.08 1.021.10 13 6814333
RemoTeC C4C8 0.910.89 0.440.77 0.951.07 23 9157130
UoL C4C8 0.820.86 0.340.17 1.171.10 14 3764727
dry season (May–September), the build-up season (high hu-midity, but little rain: October–December) and the wet sea-son, associated with tropical cyclones and monsoon rains (December–April). The average maximum temperature is
re-Table 10.Comparison of collocation methods C4 and C8 using ACOS, NIES, RemoTeC and UoL GOSAT products near the Re-union Island site. The PPDF GOSAT product does not include any observations near the Reunion Island site.
GOSAT Case Correlation Mean Standard Number of Product coefficient bias deviation observations
ACOS C4C8 0.820.83 0.700.65 0.830.76 11 8739640
NIES C4C8 0.700.73 0.250.45 1.071.02 77206505
RemoTeC C4C8 0.510.61 0.921.16 1.071.04 24823414
UoL C4 0.45 0.75 0.94 860
C8 0.36 0.71 1.00 2239
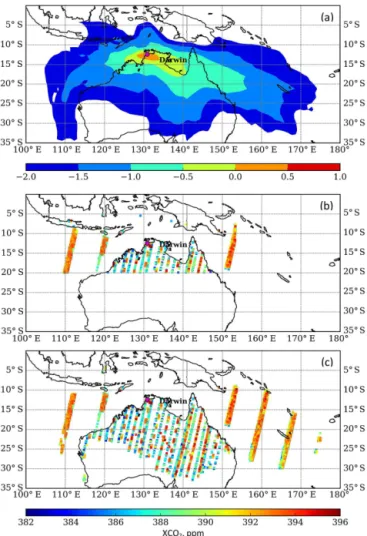
Figure 6. (a)Annual average footprint for the Darwin TCCON ob-servation site; ACOS GOSAT XCO2observations selected using (b)the geostatistical method within an area of±7.5◦× ±22.5◦and (c)the footprint-based method with the limit log10(x)= −2.0.
affects the spatial and temporal distribution of CO2and thus the footprint (Figs. 4 and 6a).
Figure 6b and c show the locations of GOSAT observa-tions selected using a geographical method within an area of
±7.5◦× ±22.5◦and a footprint-based method with the limit
log10(x)= −2.0. Sizes of selected collocation areas (C4 and
C8 methods) are close to ones used in others works (Wunch et al., 2011; Guerlet et al., 2013; Inoue et al., 2013; Reuter et al., 2013; Nguyen et al., 2014).
For ACOS, NIES and RemoTeC GOSAT products the dis-tributions of XCO2 data sets for the Darwin site are sim-ilar and cover an area to the west of Darwin, including ground-based observations from central Australia (Fig. 6c). The comparison of collocation methods shows that the footprint-based method (C4) outperforms the geographical method (C8) for these three GOSAT products (Fig. 7, Ta-ble 9), with approximately three times as many observations. Although currently the UoL GOSAT XCO2version 6 in-cludes ocean-glint observations, in this study we use the
Figure 7.Difference (denoted as d[]) in correlation coefficients, mean bias (ppm), SD (ppm) and number of observational points between methods C4 (the collocation domain size is determined by sensitivity values (ppm (µmol (m2s)−1)−1) with the limit of log10(x) equal to −2.0) and C8 (the collocation domain size is rectangular with dimension±7.5◦× ±22.5◦) using ACOS, NIES, PPDF, RemoTeC and UoL GOSAT products near the Darwin site. Please note that the scale of number of observational points is 105.
slightly outdated UoL-FP GOSAT product v4, which has only overland points. In this case the difference between col-location subsets is the observations towards the south over land, which provide a similar distribution to the ACOS prod-uct, but without marine observations (Fig. 6b and c). These differences in the covered areas have a significant negative effect on the result (Fig. 7). From that it can be concluded that XCO2 patterns towards the south over land are rather different from those around Darwin, the sun-glint observa-tion over the ocean are important and must be included into analysis. Thus, XCO2 at the Darwin site is under the influ-ence of the three different fluxes coming from surrounding land area, central part of Australia and oceanic regions. The oceanic observation over the Coral Sea is quite important, though substantially removed from the station.
4.3.2 Reunion Island site
Reunion Island is a small island east of Madagascar sur-rounded by the Indian Ocean. The nearest land territory to Reunion Island is Mauritius, located∼175 km to the
north-west. The meteorological conditions in the region mean that the footprint of the Reunion Island site mostly covers a large area of ocean to the south-east of the island and a small area of northern Madagascar (Fig. 8).
ob-Figure 8. (a) Annual average footprint for the Reunion Island TCCON observation site; ACOS GOSAT XCO2 observations se-lected using (b) the geostatistical method within an area of ±7.5◦× ±22.5◦and(c)the footprint-based method with the limit log10(x)= −2.0.
servations for this data set are located only over Madagascar (Fig. 9).
Unlike Darwin, Reunion Island receives clean air from the ocean and thus has very little CO2 variation. The selection of areas for collocation, therefore, did not reveal any signif-icant advantages of the footprint-based method, with the ex-ception of a slightly smaller bias for the NIES and RemoTec products (Fig. 10, Table 10). The comparison of the UoL-FP product for method C4 and method C8 shows that the XCO2 cycles over Madagascar and the eastern coast of Africa are quite different (Fig. 10). This highlights that the exclusion of marine observations leads to poor results over marine-based TCCON sites.
Figure 9. UoL-FP GOSAT XCO2 observations selected using (a)the geostatistical method within an area of±7.5◦× ±22.5◦and (b)the footprint-based method with the limit log10(x)= −2.0.
Figure 10.Difference (denoted asd[]) in correlation coefficients, mean bias (ppm), SD (ppm) and number of observational points between methods C4 (the collocation domain size is determined by sensitivity values (ppm (µmol (m2s)−1)−1) with the limit of
log10(x) equal to−2.0) and C8 (the collocation domain size is rect-angular with dimension±7.5◦× ±22.5◦) using ACOS, NIES, Re-moTeC and UoL GOSAT products near the Reunion Island site. Please note scale of number of observational points is 104.
cal-culated footprints have strongly curved shapes and an un-even distribution. We therefore expect the proposed footprint method to be useful for other sites with rather curved and non-uniform footprints, such as the Ascension Island and Manaus sites.
5 Summary
We have developed a method for assessing the footprints of short-term XCO2 variations observed by TCCON ground-based FTS sites. The method is ground-based on 1-week FLEXPART backward trajectory simulations that are initiated at an alti-tude of 1 km (the upper border of the PBL) in the afternoon using the vertical CO2 distribution calculated by the NIES transport model.
We applied this method to estimate footprints of the oper-ational, past, future and possible TCCON sites, and revealed some basic patterns. Most sites located near coastal regions are strongly influenced by ocean regions; thus, there is a large seasonal variability in footprints for Białystok, Darwin, Izaña, Park Falls and Tsukuba. The Ascension Island, Man-aus and Reunion Island sites have very narrow footprints that show small seasonal variations.
We proposed the footprint-based method for the colloca-tion of satellite observacolloca-tions with TCCON sites, and assessed the performance of the method using the NIES model and GOSAT product data sets. The collocation footprint area is determined by yearly averaged sensitivity values with limits of log10(x) equals−0.5, −1.0,−1.5 and−2.0. These were
selected to approximately correspond to the areas of stan-dard geographical collocation techniques that have rectangu-lar shapes of 2.5◦×2.5◦, ±5.0◦× ±5.0◦,±5.0◦× ±10.0◦
and±7.5◦× ±22.5◦, respectively. A comparison of the
pro-posed method with the geographical method showed simi-lar but smaller biases for a subset of 16 stations for the pe-riod from January 2009 to January 2014. Case studies of the Darwin and Reunion Island TCCON sites revealed that the footprint has a very different collocation area to that of the geographical method, especially near marine coast.
The geographical collocation (and other similar methods) is based on tracking long-term trends of tracers (i.e. derived from global model calculations) and is therefore less sensi-tive to the influence of local sources. This approach shows good performance for current precision of satellite XCO2 re-trievals, but it has its limitations and works up to a certain accuracy threshold. Given that the GOSAT XCO2products are sensitive to local sources, the proposed footprint method is promising and requires further fine-tuning. The potential for further improvement includes moving from gross annual averaging to more accurate seasonal or monthly averaging. In addition, it is possible to study the sensitivity of XCO2 obser-vations using the adjoint of the global Eulerian–Lagrangian coupled atmospheric transport model (Belikov et al., 2016),
which can resolve long-term, synoptic and hourly variation patterns.
We believe, however, that the footprint analysis should be considered important in the appraisal of new TCCON sites, along with assessments of the number of cloudless days, the surrounding landscape and the reflectivity of the earth’s sur-face.
6 Data availability
The data sets are available at ftp://tccon.ornl.gov/ 2014Public/documentation/ (Wunch et al., 2015).
The JRA-25/JCDAS meteorological data sets used in the simulations were provided by the Japan Meteorolog-ical Agency. The computational resources were provided by NIES. This study was performed by order of the Min-istry for Education and Science of the Russian Federation No. 5.628.2014/K and was supported by The Tomsk State University Academic D. I. Mendeleev Fund Program in 2014–2015 and by the GRENE Arctic project.
TCCON data were obtained from the TCCON Data Archive, hosted by the Carbon Dioxide Information Analy-sis Center (CDIAC) at Oak Ridge National Laboratory, Oak Ridge, Tennessee, USA, http://tccon.ornl.gov. The Ascen-sion Island site has been funded by the Max Planck Soci-ety. The Bremen, Białystok and Orléans TCCON sites are funded by the EU projects InGOS and ICOS-INWIRE, and by the Senate of Bremen. The Darwin and Wollongong TC-CON sites are funded by NASA grants NAG5-12247 and NNG05-GD07G, and Australian Research Council grants DP140101552, DP110103118, DP0879468, LE0668470 and LP0562346. We are grateful to the DOE ARM programme for technical support at the Darwin TCCON site. Nicholas Deutscher was supported by an Australian Research Council fellowship, DE140100178.
The Eureka measurements were made at the Polar Envi-ronment Atmospheric Research Laboratory (PEARL) by the Canadian Network for the Detection of Atmospheric Change (CANDAC) led by James R. Drummond, and in part by the Canadian Arctic ACE Validation Campaigns led by Kaley A. Walker. They were supported by the AIF/NSRIT, CFI, CF-CAS, CSA, EC, GOC-IPY, NSERC, NSTP, OIT, ORF and PCSP.
The University of Leicester data were obtained with fund-ing from the UK National Centre for Earth Observation and the ESA GHG-CCI project, using the ALICE High Perfor-mance Computing Facility at the University of Leicester. R. Parker was funded by an ESA Living Planet Fellowship.
Acknowledgements. Authors thank Paul Wennberg for insightful
Edited by: Q. Errera
Reviewed by: two anonymous referees
References
Andres, R. J., Gregg, J. S., Losey, L., Marland, G., and Boden, T.: Monthly, global emissions of carbon dioxide from fossil fuel consumption, Tellus, 63B, 309–327, 2011.
Belikov, D., Maksyutov, S., Miyasaka, T., Saeki, T., Zhuravlev, R., and Kiryushov, B.: Mass-conserving tracer transport modelling on a reduced latitude-longitude grid with NIES-TM, Geosci. Model Dev., 4, 207–222, doi:10.5194/gmd-4-207-2011, 2011. Belikov, D. A., Maksyutov, S., Krol, M., Fraser, A., Rigby, M.,
Bian, H., Agusti-Panareda, A., Bergmann, D., Bousquet, P., Cameron-Smith, P., Chipperfield, M. P., Fortems-Cheiney, A., Gloor, E., Haynes, K., Hess, P., Houweling, S., Kawa, S. R., Law, R. M., Loh, Z., Meng, L., Palmer, P. I., Patra, P. K., Prinn, R. G., Saito, R., and Wilson, C.: Off-line algorithm for calculation of vertical tracer transport in the troposphere due to deep convec-tion, Atmos. Chem. Phys., 13, 1093–1114, doi:10.5194/acp-13-1093-2013, 2013a.
Belikov, D., Maksyutov, S., Sherlock, V., Aoki, S., Deutscher, N. M., Dohe, S., Griffith, D., Kyro, E., Morino, I., Nakazawa, T., Notholt, J., Rettinger, M., Schneider, M., Sussmann, R., Toon, G. C., Wennberg, P. O., and Wunch, D.: Simulations of column-average CO2and CH4using the NIES TM with a hybrid sigma– isentropic (σ–θ) vertical coordinate, Atmos. Chem. Phys., 13, 1713–1732, doi:10.5194/acp-13-1713-2013, 2013b.
Belikov, D. A., Maksyutov, S., Yaremchuk, A., Ganshin, A., Kaminski, T., Blessing, S., Sasakawa, M., Gomez-Pelaez, A. J., and Starchenko, A.: Adjoint of the global Eulerian–Lagrangian coupled atmospheric transport model (A-GELCA v1.0): de-velopment and validation, Geosci. Model Dev., 9, 749–764, doi:10.5194/gmd-9-749-2016, 2016.
Boesch, H., Baker, D., Connor, B., Crisp, D., and Miller, C.: Global characterization of CO2 column retrievals from shortwave-infrared satellite observations of the Orbiting Car-bon Observatory-2 Mission, Remote Sens., 3, 270–304, doi:10.3390/rs3020270, 2011.
Bovensmann, H., Burrows, J. P., Buchwitz, M., Frerick, J., Noël, S., Rozanov, V. V., Chance, K. V., and Goede, A. P. H.: SCIA-MACHY: Mission objectives and measurement modes, J. Atmos. Sci., 56, 127–150, 1999.
Butz, A., Guerlet, S., Jacob, D. J., Schepers, D., Galli, A., Aben, I., Frankenberg, C., Hartmann, J.-M., Tran, H., Kuze, A., Keppel-Aleks, G., Toon, G. C., Wunch, D., Wennberg, P. O., Deutscher, N. M., Griffith, D. W. T., Macatangay, R., Messerschmidt, J., Notholt, J., and Warneke, T.: Toward accurate CO2and CH4 ob-servations from GOSAT, Geophys. Res. Lett., 38, 2–7, 2011. Chevallier, F., Deutscher, N. M., Conway, T. J., Ciais, P., Ciattaglia,
L., Dohe, S., Frohlich, M., Gomez-Pelaez, A. J., Griffith, D., Hase, F., Haszpra, L., Krummel, P., Kyro, E., Labuschagne, C., Langenfelds, R., Machida, T., Maignan, F., Matsueda, H., Morino, I., Notholt, J., Ramonet, M., Sawa, Y., Schmidt, M., Sherlock, V., Steele, P., Strong, K., Sussmann, R., Wennberg, P., Wofsy, S., Worthy, D., Wunch, D., and Zimnoch, M.: Global CO2 fluxes inferred from surface air-sample measurements and from
TCCON retrievals of the CO2total column, Geophys. Res. Lett., 38, L24810, doi:10.1029/2011GL049899, 2011
Cogan, A. J., Boesch, H., Parker, R. J., Feng, L., Palmer, P. I., Blavier, J.-F. L., Deutscher, N. M., Macatangay, R., Notholt, J., Roehl, C., Warneke, T., and Wunch, D.: Atmospheric carbon dioxide retrieved from the Greenhouse gases Observing SATel-lite (GOSAT): Comparison with ground-based TCCON obser-vations and GEOS-Chem model calculations, J. Geophys. Res.-Atmos., 117, D21301, doi:10.1029/2012JD018087, 2012. Crisp, D., Atlas, R. M., Bréon, F.-M., Brown, L. R., Burrows, J. P.,
Ciais, P., Connor, B. J., Doney, S. C., Fung, I. Y., Jacob, D. J., Miller, C. E., O’Brien, D., Pawson, S., Randerson, J. T., Rayner, P., Salawitch, R. S., Sander, S. P., Sen, B., Stephens, G. L., Tans, P. P., Toon, G. C., Wennberg, P. O., Wofsy, S. C., Yung, Y. L., Kuang, Z., Chudasama, B., Sprague, G., Weiss, P., Pollock, R., Kenyon, D., and Schroll, S.: The Orbiting Carbon Observatory (OCO) mission, Adv. Space Res., 34, 700–709, 2004.
Deutscher, N. M., Griffith, D. W. T., Bryant, G. W., Wennberg, P. O., Toon, G. C., Washenfelder, R. A., Keppel-Aleks, G., Wunch, D., Yavin, Y., Allen, N. T., Blavier, J.-F., Jiménez, R., Daube, B. C., Bright, A. V., Matross, D. M., Wofsy, S. C., and Park, S.: Total column CO2measurements at Darwin, Australia-site de-scription and calibration against in situ aircraft profiles, Atmos. Meas. Tech., 3, 947–958, doi:10.5194/amt-3-947-2010, 2010. Gatti, L. V., Miller, J. B., D’Amelio, M. T. S., Martinewski, A.,
Basso, L. S., Gloor, M. E., Wofsy, S., and Tans, P.: Vertical pro-files of CO2above eastern Amazonia suggest a net carbon flux to the atmosphere and balanced biosphere between 2000 and 2009, Tellus B, 62, 581–594, doi:10.1111/j.1600-0889.2010.00484.x, 2010.
Geibel, M. C., Gerbig, C., and Feist, D. G.: A new fully automated FTIR system for total column measurements of greenhouse gases, Atmos. Meas. Tech., 3, 1363–1375, doi:10.5194/amt-3-1363-2010, 2010.
Guerlet, S., Butz, A., Schepers, D., Basu, S., Hasekamp, O. P., Kuze, A., Yokota, T., Blavier, J.-F., Deutscher, N. M., Griffith, D. W., Hase, F., Kyro, E., Morino, I., Sherlock, V., Sussmann, R., Galli, A., and Aben, I.: Impact of aerosol and thin cirrus on retrieving and validating XCO2from GOSAT shortwave infrared measurements, J. Geophys. Res. Atmos., 118, 4887–4905, 2013. Hourdin, F. and Talagrand, O.: Eulerian backtracking of atmo-spheric tracers. I: Adjoint derivation and parametrization of subgrid-scale transport, Q. J. Roy Meteor. Soc., 132: 567–583, doi:10.1256/qj.03.198.A, 2006.
Inoue, M., Morino, I., Uchino, O., Miyamoto, Y., Yoshida, Y., Yokota, T., Machida, T., Sawa, Y., Matsueda, H., Sweeney, C., Tans, P. P., Andrews, A. E., Biraud, S. C., Tanaka, T., Kawakami, S., and Patra, P. K.: Validation of XCO2 derived from SWIR spectra of GOSAT TANSO-FTS with aircraft measurement data, Atmos. Chem. Phys., 13, 9771–9788, doi:10.5194/acp-13-9771-2013, 2013.
Ito, A.: Changing ecophysiological processes and carbon budget in East Asian ecosystems under near-future changes in climate: Im-plications for long-term monitoring from a process-based model, J. Plant Res., 123, 577–588, 2010.
Keppel-Aleks, G., Wennberg, P. O., Washenfelder, R. A., Wunch, D., Schneider, T., Toon, G. C., Andres, R. J., Blavier, J.-F., Con-nor, B., Davis, K. J., Desai, A. R., Messerschmidt, J., Notholt, J., Roehl, C. M., Sherlock, V., Stephens, B. B., Vay, S. A., and Wofsy, S. C.: The imprint of surface fluxes and transport on vari-ations in total column carbon dioxide, Biogeosciences, 9, 875– 891, doi:10.5194/bg-9-875-2012, 2012.
Kuze, A., Suto H., Nakajima M., and Hamazaki, T.: Thermal and near infrared sensor for carbon observation Fourier-transform spectrometer on the Greenhouse Gases Observing Satellite for greenhouse gases monitoring, Appl. Opt., 48, 6716–6733, doi:10.1364/AO.48.006716, 2009.
Kuze, A., Suto, H., Shiomi, K., Kawakami, S., Tanaka, M., Ueda, Y., Deguchi, A., Yoshida, J., Yamamoto, Y., Kataoka, F., Taylor, T. E., and Buijs, H. L.: Update on GOSAT TANSO-FTS perfor-mance, operations, and data products after more than 6 years in space, Atmos. Meas. Tech., 9, 2445–2461, doi:10.5194/amt-9-2445-2016, 2016.
Lindqvist, H., O’Dell, C. W., Basu, S., Boesch, H., Chevallier, F., Deutscher, N., Feng, L., Fisher, B., Hase, F., Inoue, M., Kivi, R., Morino, I., Palmer, P. I., Parker, R., Schneider, M., Sussmann, R., and Yoshida, Y.: Does GOSAT capture the true seasonal cy-cle of carbon dioxide?, Atmos. Chem. Phys., 15, 13023–13040, doi:10.5194/acp-15-13023-2015, 2015.
Liu, J., Bowman, K. W., and Henze, D. K.: Source-receptor relation-ships of column-average CO2and implications for the impact of observations on flux inversions, J. Geophys. Res. Atmos., 120, 5214–5236, doi:10.1002/2014JD022914, 2015.
Messerschmidt, J., Macatangay, R., Notholt, J., Petri, C., Warneke, T., and Weinzierl, C.: Side by side measurements of CO2 by ground-based Fourier transform spectrometry (FTS), Tellus B, 62, 749–758, doi:10.1111/j.1600-0889.2010.00491.x, 2010. Messerschmidt, J., Chen, H., Deutscher, N. M., Gerbig, C., Grupe,
P., Katrynski, K., Koch, F.-T., Lavriˇc, J. V., Notholt, J., Röden-beck, C., Ruhe, W., Warneke, T., and Weinzierl, C.: Automated ground-based remote sensing measurements of greenhouse gases at the Białystok site in comparison with collocated in situ mea-surements and model data, Atmos. Chem. Phys., 12, 6741–6755, doi:10.5194/acp-12-6741-2012, 2012.
Nguyen, H., Osterman, G., Wunch, D., O’Dell, C., Mandrake, L., Wennberg, P., Fisher, B., and Castano, R.: A method for collo-cating satellite XCO2data to ground-based data and its appli-cation to ACOS-GOSAT and TCCON, Atmos. Meas. Tech., 7, 2631–2644, doi:10.5194/amt-7-2631-2014, 2014.
Oda, T. and Maksyutov, S.: A very high-resolution (1 km×1 km) global fossil fuel CO2emission inventory derived using a point source database and satellite observations of nighttime lights, At-mos. Chem. Phys., 11, 543–556, doi:10.5194/acp-11-543-2011, 2011.
O’Dell, C. W., Connor, B., Bösch, H., O’Brien, D., Frankenberg, C., Castano, R., Christi, M., Eldering, D., Fisher, B., Gunson, M., McDuffie, J., Miller, C. E., Natraj, V., Oyafuso, F., Polonsky, I., Smyth, M., Taylor, T., Toon, G. C., Wennberg, P. O., and Wunch, D.: The ACOS CO2retrieval algorithm – Part 1: Description and validation against synthetic observations, Atmos. Meas. Tech., 5, 99–121, doi:10.5194/amt-5-99-2012, 2012.
Ohyama, H., Morino, I., Nagahama, T., Machida, T., Suto, H., Oguma, H., Sawa, Y., Matsueda, H., Sugimoto, N., Nakane, H., and Nakagawa, K.: Column-averaged volume mixing
ra-tio of CO2 measured with ground-based Fourier transform spectrometer at Tsukuba, J. Geophys. Res., 114, D18303, doi:10.1029/2008JD011465, 2009.
Onogi, K., Tsutsui, J., Koide, H., Sakamoto, M., Kobayashi, S., Hat-sushika, H., Matsumoto, T., Yamazaki, N., Kamahori, H., Taka-hashi, K., Kadokura, S., Wada, K., Kato, K., Oyama, R., Ose, T., Mannoji, N., and Taira, R.: The JRA-25 Reanalysis, J. Meteor. Soc. Jpn., 85, 369–432, 2007.
Oshchepkov, S., Bril, A., Yokota, T., Morino, I., Yoshida, Y., Mat-sunaga, T., Belikov, D., Wunch, D., Wennberg, P. O., Toon, G. C., O’Dell, C. W., Butz, A., Guerlet, S., Cogan, A., Boesch, H., Eguchi, N., Deutscher, N. M., Griffith, D., Macatangay, R., Notholt, J., Sussmann, R., Rettinger, M., Sherlock, V., Robinson, J., Kyrö, E., Heikkinen, P., Feist, D. G., Nagahama, T., Kady-grov, N., Maksyutov, S., Uchino, O., and Watanabe, H.: Effects of atmospheric light scattering on spectroscopic observations of greenhouse gases from space: Validation of PPDF-based CO2 re-trievals from GOSAT, J. Geophys. Res., 117, 1–18, 2012. Oshchepkov, S., Bril, A., Yokota, T., Yoshida, Y., Blumenstock,
T., Deutscher, N. M., Dohe, S., Macatangay, R., Morino, I., Notholt, J., Rettinger, M., Petri, C., Schneider, M., Sussman, R., Uchino, O., Velazco, V., Wunch, D., and Belikov, D.: Simul-taneous retrieval of atmospheric CO2and light path modifica-tion from space-based spectroscopic observamodifica-tions of greenhouse gases: methodology and application to GOSAT measurements over TCCON sites, Appl. Optics, 52, 1339–1350, 2013. Patra, P. K., Houweling, S., Krol, M., Bousquet, P., Belikov, D.,
Bergmann, D., Bian, H., Cameron-Smith, P., Chipperfield, M. P., Corbin, K., Fortems-Cheiney, A., Fraser, A., Gloor, E., Hess, P., Ito, A., Kawa, S. R., Law, R. M., Loh, Z., Maksyutov, S., Meng, L., Palmer, P. I., Prinn, R. G., Rigby, M., Saito, R., and Wilson, C.: TransCom model simulations of CH4 and related species: linking transport, surface flux and chemical loss with CH4 vari-ability in the troposphere and lower stratosphere, Atmos. Chem. Phys., 11, 12813–12837, doi:10.5194/acp-11-12813-2011, 2011. Reuter, M., Bösch, H., Bovensmann, H., Bril, A., Buchwitz, M., Butz, A., Burrows, J. P., O’Dell, C. W., Guerlet, S., Hasekamp, O., Heymann, J., Kikuchi, N., Oshchepkov, S., Parker, R., Pfeifer, S., Schneising, O., Yokota, T., and Yoshida, Y.: A joint effort to deliver satellite retrieved atmospheric CO2concentrations for surface flux inversions: the ensemble median algorithm EMMA, Atmos. Chem. Phys., 13, 1771–1780, doi:10.5194/acp-13-1771-2013, 2013.
Stohl, A., Seibert, P., Arduini, J., Eckhardt, S., Fraser, P., Greally, B. R., Lunder, C., Maione, M., Mhle, J., O’Doherty, S., Prinn, R. G., Reimann, S., Saito, T., Schmidbauer, N., Simmonds, P. G., Vollmer, M. K., Weiss, R. F., and Yokouchi, Y.: An analytical inversion method for determining regional and global emissions of greenhouse gases: Sensitivity studies and application to halo-carbons, Atmos. Chem. Phys., 9, 1597–1620, doi:10.5194/acp-9-1597-2009, 2009.
Swap, R., Garstang, M., Macko, S. A., Tyson, P. D., Maenhaut, W., Artaxo, P., Kållberg, P., and Talbot R.: The long-range trans-port of southern African aerosols to the tropical South Atlantic, J. Geophys. Res., 101, 23777–23791, doi:10.1029/95JD01049, 1996.
Van der Werf, G. R., Randerson, J. T., Giglio, L., Collatz, G. J., Mu, M., Kasibhatla, P. S., Morton, D. C., DeFries, R. S., Jin, Y., and Van Leeuwen, T. T.: Global fire emissions and the contribution of deforestation, savanna, forest, agricultural, and peat fires (1997– 2009), Atmos. Chem. Phys., 10, 11707–11735, doi:10.5194/acp-10-11707-2010, 2010.
Washenfelder, R., Toon, G., Blavier, J., Yang, Z., Allen, N., Wennberg, P., Vay, S., Matross, D., and Daube, B.: Carbon diox-ide column abundances at the Wisconsin Tall Tower site, J. Geo-phys. Res, 111, D22305, doi:10.1029/2006JD007154, 2006. Wunch, D., Toon, G. C., Blavier, J.-F. L., Washenfelder, R.
A., Notholt, J., Connor, B. J., Griffith, D. W. T., Sherlock, V., and Wennberg, P. O.: The Total Carbon Column Ob-serving Network, Phil. Trans. R. Soc. A, 369, 2087–2112, doi:10.1098/rsta.2010.0240, 2011.
Wunch, D., Toon, G. C, Sherlock, V., Deutscher, N. M., Liu, C., Feist, D. G., and Wennberg, P. O.: The Total Car-bon Column Observing Network’s GGG2014 Data Version. Technical report, Carbon Dioxide Information Analysis Cen-ter, Oak Ridge National Laboratory, Oak Ridge, Tennessee, USA, doi:10.14291/tccon.ggg2014.documentation.R0/1221662, 2015.
Yokota, T., Yoshida, Y., Eguchi, N., Ota, Y., Tanaka, T., Watanabe, H., and Maksyutov, S.: Global concentrations of CO2and CH4 retrieved from GOSAT: First preliminary results, SOLA, 5, 160– 163, doi:10.2151/sola.2009-041, 2009.
Yoshida, Y., Kikuchi, N., Morino, I., Uchino, O., Oshchepkov, S., Bril, A., Saeki, T., Schutgens, N., Toon, G. C., Wunch, D., Roehl, C. M., Wennberg, P. O., Griffith, D. W. T., Deutscher, N. M., Warneke, T., Notholt, J., Robinson, J., Sherlock, V., Connor, B., Rettinger, M., Sussmann, R., Ahonen, P., Heikkinen, P., Kyrö, E., Mendonca, J., Strong, K., Hase, F., Dohe, S., and Yokota, T.: Improvement of the retrieval algorithm for GOSAT SWIR XCO2and XCH4and their validation using TCCON data, At-mos. Meas. Tech., 6, 1533–1547, doi:10.5194/amt-6-1533-2013, 2013.
![Figure 10. Difference (denoted as d[]) in correlation coefficients, mean bias (ppm), SD (ppm) and number of observational points between methods C4 (the collocation domain size is determined by sensitivity values (ppm (µmol (m 2 s) −1 ) −1 ) with the limit](https://thumb-eu.123doks.com/thumbv2/123dok_br/18135414.325801/11.918.474.846.599.794/figure-difference-correlation-coefficients-observational-collocation-determined-sensitivity.webp)
