ACPD
15, 15039–15086, 2015A synthesis of CCNC measurements within
the EUCAARI network
M. Paramonov et al.
Title Page
Abstract Introduction
Conclusions References
Tables Figures
◭ ◮
◭ ◮
Back Close
Full Screen / Esc
Printer-friendly Version Interactive Discussion
Discussion
P
a
per
|
Discussion
P
a
per
|
Discussion
P
a
per
|
Discussion
P
a
per
|
Atmos. Chem. Phys. Discuss., 15, 15039–15086, 2015 www.atmos-chem-phys-discuss.net/15/15039/2015/ doi:10.5194/acpd-15-15039-2015
© Author(s) 2015. CC Attribution 3.0 License.
This discussion paper is/has been under review for the journal Atmospheric Chemistry and Physics (ACP). Please refer to the corresponding final paper in ACP if available.
A synthesis of cloud condensation nuclei
counter (CCNC) measurements within the
EUCAARI network
M. Paramonov1, V.-M. Kerminen1, M. Gysel2, P. P. Aalto1, M. O. Andreae3,
E. Asmi16, U. Baltensperger2, A. Bougiatioti9, D. Brus16,17, G. Frank5, N. Good6,a, S. S. Gunthe3,b, L. Hao7, M. Irwin6,c, A. Jaatinen7, Z. Jurányi2,d, S. M. King8,e, A. Kortelainen7, A. Kristensson5, H. Lihavainen16, M. Kulmala1, U. Lohmann13, S. T. Martin8, G. McFiggans6, N. Mihalopoulos9, A. Nenes4,14,15, C. D. O’Dowd10, J. Ovadnevaite10, T. Petäjä1, U. Pöschl3, G. C. Roberts11,18, D. Rose3,f,
B. Svenningsson5, E. Swietlicki5, E. Weingartner2,d, J. Whitehead6, A. Wiedensohler12, C. Wittbom5, and B. Sierau13
1
Department of Physics, University of Helsinki, P.O. Box 64, 00014, Helsinki, Finland
2
Laboratory of Atmospheric Chemistry, Paul Scherrer Institute, 5232 Villigen PSI, Switzerland
3
Biogeochemistry and Multiphase Chemistry Departments, Max Planck Institute for Chemistry, Mainz, Germany
4
ACPD
15, 15039–15086, 2015A synthesis of CCNC measurements within
the EUCAARI network
M. Paramonov et al.
Title Page
Abstract Introduction
Conclusions References
Tables Figures
◭ ◮
◭ ◮
Back Close
Full Screen / Esc
Printer-friendly Version Interactive Discussion
Discussion
P
a
per
|
Discussion
P
a
per
|
Discussion
P
a
per
|
Discussion
P
a
per
|
5
Division of Nuclear Physics, Department of Physics, Lund University, P.O. Box 118, 22100 Lund, Sweden
6
Centre for Atmospheric Science, SEAES, The University of Manchester, Oxford Road, Manchester M13 9PL, UK
7
Department of Applied Physics, University of Eastern Finland, 70210, Kuopio, Finland
8
School of Engineering and Applied Sciences and Department of Earth and Planetary Sciences, Harvard University, Cambridge, MA 02138, USA
9
Environmental Chemical Processes Laboratory, University of Crete, Heraklion, Greece
10
School of Physics and Centre for Climate and Air Pollution Studies, Ryan Institute, National University of Ireland Galway, University Road, Galway, Ireland
11
Centre National de Recherches Météorologiques, Toulouse, France
12
Leibniz Institute for Tropospheric Research, Leipzig, Germany
13
Institute for Atmospheric and Climate Science, ETH Zurich, Zurich, Switzerland
14
School of Chemical and Biomolecular Engineering, Georgia Institute of Technology, Atlanta, GA 30332, USA
15
Institute of Chemical Engineering Sciences (ICE-HT), FORTH, Patras, Greece
16
Finnish Meteorological Institute, Erik Palménin aukio 1, P.O. Box 503, 00101 Helsinki, Finland
17
Laboratory of Aerosols Chemistry and Physics, Institute of Chemical Process
Fundamentals, Academy of Sciences of the Czech Republic, Rozvojová 135, 165 02 Prague 6, Czech Republic
18
Scripps Institution of Oceanography, University of California San Diego, La Jolla, CA 92093, USA
a
now at: Department of Mechanical Engineering, Colorado State University, Fort Collins, CO, USA
b
now at: Department of Civil Engineering, Indian Institute of Technology Madras, Chennai, India
c
now at: Cambustion Ltd., Cambridge, UK
d
now at: Institute of Aerosol and Sensor Technology, University of Applied Sciences Northwestern Switzerland, Windisch, Switzerland
e
ACPD
15, 15039–15086, 2015A synthesis of CCNC measurements within
the EUCAARI network
M. Paramonov et al.
Title Page
Abstract Introduction
Conclusions References
Tables Figures
◭ ◮
◭ ◮
Back Close
Full Screen / Esc
Printer-friendly Version Interactive Discussion
Discussion
P
a
per
|
Discussion
P
a
per
|
Discussion
P
a
per
|
Discussion
P
a
per
|
f
now at: Institute for Atmospheric and Environmental Sciences, Goethe-University Frankfurt am Main, Frankfurt am Main, Germany
Received: 30 April 2015 – Accepted: 11 May 2015 – Published: 1 June 2015
Correspondence to: M. Paramonov ([email protected]),
V.-M. Kerminen ([email protected]), M. Gysel ([email protected]), and B. Sierau ([email protected])
ACPD
15, 15039–15086, 2015A synthesis of CCNC measurements within
the EUCAARI network
M. Paramonov et al.
Title Page
Abstract Introduction
Conclusions References
Tables Figures
◭ ◮
◭ ◮
Back Close
Full Screen / Esc
Printer-friendly Version Interactive Discussion
Discussion
P
a
per
|
Discussion
P
a
per
|
Discussion
P
a
per
|
Discussion
P
a
per
|
Abstract
Cloud Condensation Nuclei Counter (CCNC) measurements performed at 14 locations around the world within the EUCAARI framework have been analysed and discussed with respect to the cloud condensation nuclei (CCN) activation and hygroscopic proper-ties of the atmospheric aerosol. The annual mean ratio of activated cloud condensation
5
nuclei (NCCN) to the total number concentration of particles (NCN), known as the acti-vated fractionA, shows a similar functional dependence on supersaturationS at many locations; exceptions to this being certain marine locations, a free troposphere site and background sites in south-west Germany and northern Finland. The use of total number concentration of particles above 50 and 100 nm diameter when calculating the
10
activated fractions (A50 and A100, respectively) renders a much more stable depen-dence of Aon S;A50 and A100 also reveal the effect of the size distribution on CCN activation. With respect to chemical composition, it was found that the hygroscopicity of aerosol particles as a function of size differs among locations. The hygroscopic-ity parameter κ decreased with an increasing size at a continental site in south-west
15
Germany and fluctuated without any particular size dependence across the observed size range in the remote tropical North Atlantic and rural central Hungary. At all other locationsκ increased with size. In fact, in Hyytiälä, Vavihill, Jungfraujoch and Pallas the difference in hygroscopicity between Aitken and accumulation mode aerosol was statistically significant at the 5 % significance level. In a boreal environment the
as-20
sumption of a size-independentκ can lead to a potentially substantial overestimation ofNCCNatSlevels above 0.6 %; similar is true for other locations whereκwas found to increase with size. While detailed information about aerosol hygroscopicity can signifi-cantly improve the prediction ofNCCN, total aerosol number concentration and aerosol size distribution remain more important parameters. The seasonal and diurnal patterns
25
ACPD
15, 15039–15086, 2015A synthesis of CCNC measurements within
the EUCAARI network
M. Paramonov et al.
Title Page
Abstract Introduction
Conclusions References
Tables Figures
◭ ◮
◭ ◮
Back Close
Full Screen / Esc
Printer-friendly Version Interactive Discussion
Discussion
P
a
per
|
Discussion
P
a
per
|
Discussion
P
a
per
|
Discussion
P
a
per
|
1 Introduction
Atmospheric aerosol particles are known to modify the microphysical properties of clouds, such as their albedo, lifetime and precipitation patterns (Boucher et al., 2013). Due to the importance of clouds in the weather and climate systems, these aerosol-induced changes, known as the indirect effects of aerosols on climate, are a subject of
5
rigorous research. The quantification of the radiative forcing associated with the inter-actions of atmospheric aerosol with clouds remains one of the biggest challenges in the current understanding of climate change (Boucher et al., 2013). These challenges are associated with the production of the aerosol particles that are able to activate into cloud droplets, known as cloud condensation nuclei (CCN) (e.g. Laaksonen et al.,
10
2005; Andreae and Rosenfeld, 2008; Kuang et al., 2009; Kerminen et al., 2012), their actual activation into cloud drops (e.g. Kulmala et al., 1996; Dusek et al., 2006; McFig-gans et al., 2006; Paramonov et al., 2013; Hammer et al., 2014), the formation of clouds (e.g. Twomey, 1959; Mason and Chien, 1962; Vaillancourt et al., 2002), time evolution of cloud microphysical and other properties (e.g. Rosenfeld et al., 2014) and the
in-15
teraction of clouds with the solar and terrestrial radiation (e.g. Boucher and Lohmann, 1995; Ramanathan et al., 2001; Chen et al., 2014). A better understanding is needed with respect to each of these steps in order to improve the performance of the cur-rent global climate models (GCMs) and to increase the accuracy of the future climate predictions.
20
Several aerosol properties are of special interest when looking at the interaction of atmospheric aerosol particles with warm clouds. The current article focuses on the number, size and hygroscopicity of the atmospheric aerosol particles with regard to how these parameters affect the potential of particles to act as CCN. One such property of interest is the CCN number concentrationNCCN. Depending on the location,NCCNcan
25
ACPD
15, 15039–15086, 2015A synthesis of CCNC measurements within
the EUCAARI network
M. Paramonov et al.
Title Page
Abstract Introduction
Conclusions References
Tables Figures
◭ ◮
◭ ◮
Back Close
Full Screen / Esc
Printer-friendly Version Interactive Discussion
Discussion
P
a
per
|
Discussion
P
a
per
|
Discussion
P
a
per
|
Discussion
P
a
per
|
with increasing S (Köhler, 1936); consequently NCCN increases monotonically with S
for a given aerosol population. The exact response ofNCCNto an increasingS depends on the total aerosol number concentration NCN, aerosol size distribution and particle hygroscopicity. Besides the relevant references found throughout the paper, discus-sion aboutNCCN concentrations in various environments can be found in, e.g. Pandis
5
et al. (1994), Covert et al. (1998), Snider and Brenguier (2000), Chang et al. (2007), An-dreae and Rosenfeld (2008), AnAn-dreae (2009) and Wang et al. (2010). At any givenS, another property of interest is the critical dry diameter of CCN activationDc, defined as the smallest diameter at which particles activate into cloud drops. For internally mixed polydisperse aerosol particles, this diameter indicates that all particles above this size
10
activate into cloud drops, and all particles below this size do not. However, atmospheric aerosol is frequently externally mixed, with particles of different sizes exhibiting diff er-ent chemical composition, and, therefore, in practice, Dc is usually estimated as the diameter at which 50 % of the particles activate and grow into cloud drops.Dc can be directly calculated from size-segregated Cloud Condensation Nuclei Counter (CCNC)
15
measurements (Rose et al., 2008) or estimated from the size distribution data coupled withNCCN (Hitzenberger et al., 2003; Furutani et al., 2008). The effect of hygroscop-icity on the activation of CCN into cloud drops has also been studied extensively, and several simplified theoretical models have been suggested to link particle composition with critical supersaturation Sc (e.g. Svenningsson et al., 1992; Rissler et al., 2005;
20
Khvorostyanov and Curry, 2007; Wex et al., 2007). One such approach is the hygro-scopicity parameterκ, a unitless number describing the cloud condensation nucleus activity (Petters and Kreidenweis, 2007). The value ofκ typically varies between zero and just above unity, with values close to zero indicating a non-hygroscopic aerosol, i.e. with low affinity for water (e.g. freshly emitted black carbon; e.g. Hudson et al., 1991;
25
stud-ACPD
15, 15039–15086, 2015A synthesis of CCNC measurements within
the EUCAARI network
M. Paramonov et al.
Title Page
Abstract Introduction
Conclusions References
Tables Figures
◭ ◮
◭ ◮
Back Close
Full Screen / Esc
Printer-friendly Version Interactive Discussion
Discussion
P
a
per
|
Discussion
P
a
per
|
Discussion
P
a
per
|
Discussion
P
a
per
|
ies quite extensively (e.g. Carrico et al., 2008; Kammermann et al., 2010a; Levin et al., 2014).
This article summarises the measurements performed by CCNCs within the frame-work of the European Integrated project on Aerosol Cloud Climate and Air Quality inter-actions (EUCAARI). One of the EUCAARI project aims was to compile a
comprehen-5
sive database of in situ measured aerosol, CCN and hygroscopic properties in order to increase the knowledge about aerosol-cloud-climate interactions and to combine the relevant existing measurement infrastructure (Kulmala et al., 2011). Besides CCNCs already deployed at the existing European long-term measurement stations, several intensive field campaigns using the CCNC were carried out as part of EUCAARI as
10
well. The main objective of this work is to present a comprehensive overview and in-tercomparison of CCNC measurements and to provide an insight into the cloud droplet activation and aerosol hygroscopic properties in different environments. More specifi-cally, the aims are to (i) get new insight into CCN number concentrations and activated fractions around the world and their dependence on the water vapour
supersatura-15
tion ratio, (ii) provide new information about the dependence of aerosol hygroscopicity on particle size, and (iii) reveal seasonal and diurnal variation of CCN activation and hygroscopic properties. While undeniably important, the effect of size distribution on
NCCNand the aerosol activation efficiency (e.g. Dusek et al., 2006; Quinn et al., 2008; Morales Betancourt and Nenes, 2014) is not investigated herein, and an overview of
20
the existing EUCAARI aerosol size distribution data can be found in Asmi et al. (2011) and Beddows et al. (2014).
2 Methodology
2.1 Instrumentation
A CCNC is a type of instrument frequently used for studying the cloud droplet activation
25
ACPD
15, 15039–15086, 2015A synthesis of CCNC measurements within
the EUCAARI network
M. Paramonov et al.
Title Page
Abstract Introduction
Conclusions References
Tables Figures
◭ ◮
◭ ◮
Back Close
Full Screen / Esc
Printer-friendly Version Interactive Discussion
Discussion
P
a
per
|
Discussion
P
a
per
|
Discussion
P
a
per
|
Discussion
P
a
per
|
and an optical particle counter (OPC) frequently running in parallel with a condensation particle counter (CPC). For all measurements presented herein, the CCNC used was a commercially available instrument produced by Droplet Measurement Technologies, Inc. (DMT-CCNC), the basic principles of operation of which are described below.
Upon entering the measurement setup, the aerosol flow is split into two sample flows,
5
with the first flow leading to a CPC to determine the total particle number concentra-tion, hereafter referred to asNCN. The second flow feeds the aerosol into the saturator unit of the CCNC, inside of which the conditions of supersaturationSeff with respect to water vapour down the centre of the column are established. Aerosol, flowing un-der laminar flow conditions, is subjected to these supersaturation conditions, during
10
which particles with a critical supersaturationSc smaller thanSeffwill grow by the con-densation of water vapour and remain in stable equilibrium, i.e. activate as CCN. The residence time inside the saturator column (∼10 s) allows for the activated particles
to grow to sizes larger than 1 µm in diameter; these particles are then counted by the OPC providing the number concentration of activated aerosol particles, a quantity
15
hereafter referred to as NCCN. The described setup is characteristic of polydisperse measurements; an inclusion of a drier, a neutraliser and a Differential Mobility Analyzer (DMA; Knutson and Whitby, 1975) prior to the splitting of the flow into two parallel lines allows for the selection of a particular particle size, i.e. quasi-monodisperse measure-ments. Such measurements can be performed either by varying the particle size at
20
a constantSeff (D-scan) or by varying Seff at a constant particle size (S-scan). Such a setup, while more complex, provides activation spectra and allows for a direct cal-culation of the critical dry diameter of droplet activationDc (in case of the D-scan) or
the critical supersaturationSc (in case of the S-scan). Typically, a CCNC operates at several different levels ofSeff, most commonly ranging between 0.1 and 1.0 %. A more
25
ACPD
15, 15039–15086, 2015A synthesis of CCNC measurements within
the EUCAARI network
M. Paramonov et al.
Title Page
Abstract Introduction
Conclusions References
Tables Figures
◭ ◮
◭ ◮
Back Close
Full Screen / Esc
Printer-friendly Version Interactive Discussion
Discussion
P
a
per
|
Discussion
P
a
per
|
Discussion
P
a
per
|
Discussion
P
a
per
|
2.2 Measurement sites
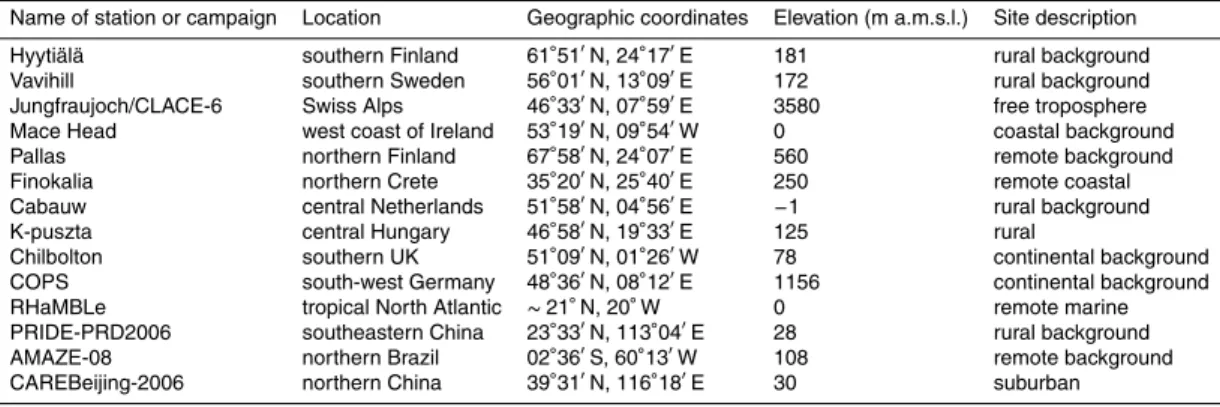
Data from a total of 14 EUCAARI locations have been provided for this analysis, in-cluding both long-term measurement stations and short-term campaigns (Fig. 1). As seen in the figure, datasets came from a wide variety of locations representing various environments, including marine and continental, urban and background, at altitudes
5
ranging from the ground level to the free troposphere. The location and description of each measurement site is given in Table 1. All measurements presented herein were performed within the EUCAARI framework.
Hyytiälä Forestry Field Station in Southern Finland is the location of the Station for Measuring Ecosystem–Atmosphere Relations SMEAR II, operated by the University
10
of Helsinki. Located on a flat terrain and surrounded by the boreal coniferous forest, mainly Scots pine, the station is well representative of the boreal environment (Hari and Kulmala, 2005). It is a rural background site, with the nearest city of Tampere (pop. 220 000) located 50 km to the southwest. Air masses at the site can be of both Arctic and European origin, however, aerosol particle number concentrations at this site are
15
typically low (Sogacheva et al., 2005).
Vavihill in Southern Sweden is a continental background site surrounded by grass-lands and deciduous forest and operated by Lund University. The site is located 60– 70 km NNE of the Malmö and Copenhagen urban area (pop. ∼2 000 000), however,
it is considered to not be affected by the local anthropogenic sources (Tunved et al.,
20
2003). Due to its location, the site is often used for monitoring the transport of pollution from continental Europe into the Nordic region (Tunved et al., 2003).
The Jungfraujoch is a high alpine station in the Bernese Alps in Switzerland, where the aerosol measurements are performed by the Paul Scherrer Institute (PSI). Being located high in the mountains (3580 m a.s.l.), the station is far from local sources of
25
ACPD
15, 15039–15086, 2015A synthesis of CCNC measurements within
the EUCAARI network
M. Paramonov et al.
Title Page
Abstract Introduction
Conclusions References
Tables Figures
◭ ◮
◭ ◮
Back Close
Full Screen / Esc
Printer-friendly Version Interactive Discussion
Discussion
P
a
per
|
Discussion
P
a
per
|
Discussion
P
a
per
|
Discussion
P
a
per
|
frequently influenced by the injections of more polluted air from the planetary boundary layer, driven by thermal convection (Jurányi et al., 2010; Kammermann et al., 2010a; Jurányi et al., 2011). The station is frequently inside clouds allowing for direct measure-ments of aerosol-cloud interactions.
Mace Head is a coastal marine site located on the west coast of Ireland and operated
5
by the National University of Ireland, Galway. The distance to the nearest urban settle-ment of Galway City (88 km, pop. 65 000) renders Mace Head a clean background site; being on the coast, the station is directly exposed to the North Atlantic Ocean. Occa-sionally the station is subject to more polluted air masses originating from continental Europe and the UK (O’Dowd et al., 2014).
10
Pallas is a remote continental site in northern Finland located in the northernmost boreal forest zone in Europe; it is run by the Finnish Meteorological Institute (FMI). The station is situated on top of a treeless hill and, due to the frequent presence of clouds, is suitable for in situ measurements of aerosol-cloud interactions. The Pallas station is subject to both clean Arctic air masses, as well as to more polluted
Euro-15
pean air masses; regardless, absolute particle number concentrations are typically low (Hatakka et al., 2003).
Finokalia station is a remote coastal site located on the island of Crete and operated by the University of Crete. The station is located on top of a hill, and most frequently air masses arrive in Finokalia over the Mediterranean Sea (Stock et al., 2011). The station
20
is representative of background conditions as there are no local sources of pollution present; the largest nearby urban centre of Heraklion (pop. 175 000) is 50 km to the west.
The Cabauw Experimental Site for Atmospheric Research (CESAR) is located in the central Netherlands, 44 km from the North Sea. The station is in a rural area, however,
25
ACPD
15, 15039–15086, 2015A synthesis of CCNC measurements within
the EUCAARI network
M. Paramonov et al.
Title Page
Abstract Introduction
Conclusions References
Tables Figures
◭ ◮
◭ ◮
Back Close
Full Screen / Esc
Printer-friendly Version Interactive Discussion
Discussion
P
a
per
|
Discussion
P
a
per
|
Discussion
P
a
per
|
Discussion
P
a
per
|
The University of Manchester conducted four short-term measurement campaigns utilising a CCNC: K-puszta, Chilbolton, COPS and RHaMBLe. K-puszta is a rural site surrounded by deciduous/coniferous forest located on the Great Hungarian Plain in central Hungary 80 km SE of Budapest. The site has no local anthropogenic pollution sources (Ion et al., 2005). Chilbolton is also a rural site, located in southern UK, 100 km
5
WSW of London. The site is most frequently influenced by the marine air masses; a potential local source of anthropogenic pollution is the seasonal agricultural spray-ing (Campanelli et al., 2012). The Convective and Orographically-induced Precipitation Study (COPS) campaign took place at the top of the Hornisgrinde Mountain in the Black Forest region of south-west Germany. While this site is primarily surrounded by
10
the coniferous forest, the close proximity to the Rhine Valley exposes the site to some anthropogenic pollution. Due to its elevation, the site is occasionally in the free tro-posphere (Jones et al., 2011). The Reactive Halogens in the Marine Boundary Layer (RHaMBLe) Discovery Cruise D319 campaign was a cruise conducted in the tropical North Atlantic between Portugal and Cape Verde. The operational area can be
de-15
scribed as a remote marine environment with few, if any, sources of anthropogenic pollution. Air masses can originate from both the ocean and from the African mainland (Good et. al., 2010).
The Max Planck Institute for Chemistry (MPIC) also conducted four CCNC mea-surement campaigns within the EUCAARI framework: PRIDE-PRD2006, AMAZE-08,
20
CAREBeijing-2006 and CLACE-6, with the last one having taken place at the previ-ously described Jungfraujoch station. The PRIDE-PRD2006 campaign took place in southeastern China, in a small village ∼60 km NW of Guangzhou, in the vicinity of a densely populated urban centre. The wind direction during the campaign rendered the site a rural receptor of the regional pollution originating from the Guangzhou urban
25
Mar-ACPD
15, 15039–15086, 2015A synthesis of CCNC measurements within
the EUCAARI network
M. Paramonov et al.
Title Page
Abstract Introduction
Conclusions References
Tables Figures
◭ ◮
◭ ◮
Back Close
Full Screen / Esc
Printer-friendly Version Interactive Discussion
Discussion
P
a
per
|
Discussion
P
a
per
|
Discussion
P
a
per
|
Discussion
P
a
per
|
tin et al., 2010). The CAREBeijing-2006 campaign was conducted at a suburban site in northern China, on the grounds of Huang Pu University in Yufa, ∼50 km south of Beijing. The site is subject to air masses originating both in the south and in the north; however, being located on the outskirts of a large urban centre, particle concentrations are generally high (Garland et al., 2009).
5
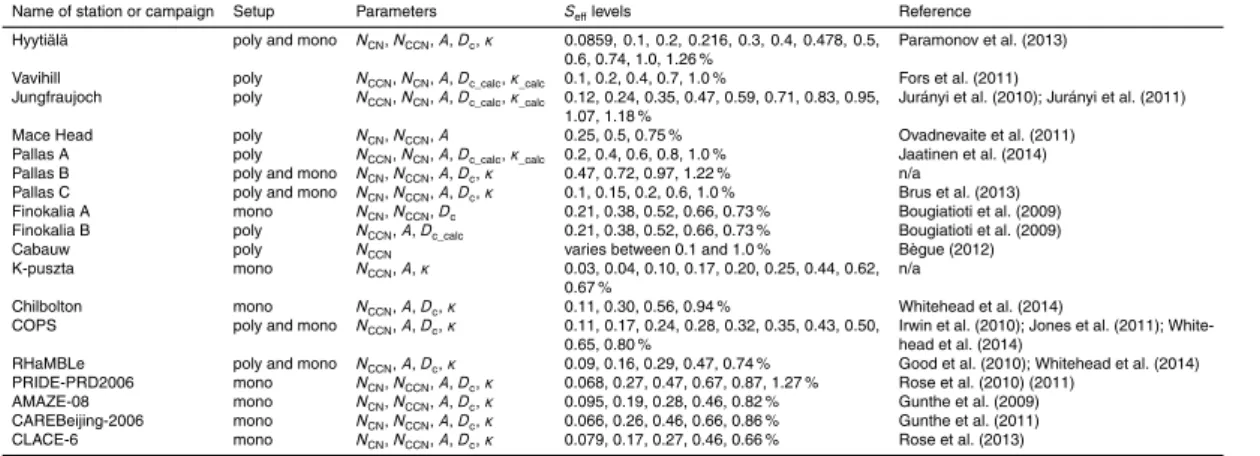
2.3 Data
The measurement period for each location and a brief summary of available CCNC data are presented in Fig. 2 and Table 2, respectively. Available data range from mid-2006 to the end of 2012; the four long-term datasets all exceed one year in duration. As originally requested by the authors from the EUCAARI partners, some of the data
10
were submitted in the NASA-Ames format with daily and monthly/campaign averages. Other datasets were submitted in the original time resolution and have been compiled accordingly for this overview study.
For the quality assurance of the CCNC data, data providers were requested to re-calculate all values to correspond to the standard temperature and pressure and to
15
utilise a consistent procedure for the CCNC calibration. Calibrations were asked to be performed as outlined in Rose et al. (2008) using nebulised, dried, charge-equilibrated and size-selected ammonium sulphate or sodium chloride aerosol particles. Water ac-tivity was asked to be parameterised according to either the AIM-based model (Rose et al., 2008) or the ADDEM-model (Topping et al., 2005). As none of the
participat-20
ing data providers noted a deviation from the calibration procedure, it is assumed that the data were treated accordingly. However, deviations from the described procedure and from the targetSeff levels may be possible and can potentially affect some of the conclusions presented in this paper. Uncertainties associated with deviations from the mentioned calibration procedure and parameterisation are discussed in great detail in
25
Rose et al. (2008) and Topping et al. (2005).
ACPD
15, 15039–15086, 2015A synthesis of CCNC measurements within
the EUCAARI network
M. Paramonov et al.
Title Page
Abstract Introduction
Conclusions References
Tables Figures
◭ ◮
◭ ◮
Back Close
Full Screen / Esc
Printer-friendly Version Interactive Discussion
Discussion
P
a
per
|
Discussion
P
a
per
|
Discussion
P
a
per
|
Discussion
P
a
per
|
conjunction with the CCNC to derive the critical dry diameterDc. The procedure was
carried out by comparingNCCNto the DMPS/SMPS-derived number size distributions; these were integrated from the largest size bin until the cumulativeNCN concentration was equal toNCCN.Dc was then calculated by interpolating between the two adjacent
size bins (Furutani et al., 2008). Following the calculation of Dc, the hygroscopicity
5
parameterκwas determined using the effective hygroscopicity parameter (EH1) Köhler model assuming the surface tension of pure water (Petters and Kreidenweis, 2007; Rose et al., 2008). This assumption, although commonly used, typically leads to an overestimation of theNCCN (Kammermann et al., 2010b).
For certain sites, total number concentrations of particles larger than 50 or 100 nm in
10
diameter (N50 orN100) were calculated from the corresponding DMPS or SMPS data. In order to compare the results from different stations, several interpola-tion/extrapolation techniques were used. All NCCN concentrations were recalculated to correspond to the targetSeff levels suggested by the Aerosols, Clouds and Trace gases Research InfraStructure (ACTRIS) Network: 0.1, 0.2, 0.3, 0.5 and 1.0 %.
Re-15
calculation to the nearest target supersaturation was accomplished by a simple linear interpolation/extrapolation ofNCCNas a function ofSeff using the two adjacent/nearest
Seff points. For the Jungfraujoch data,DcatSeffof 0.12 and 0.95 % was recalculated to the correspondingDcat the targetSeffof 0.1 and 1.0 %, respectively, assuming a size-independentκ.
20
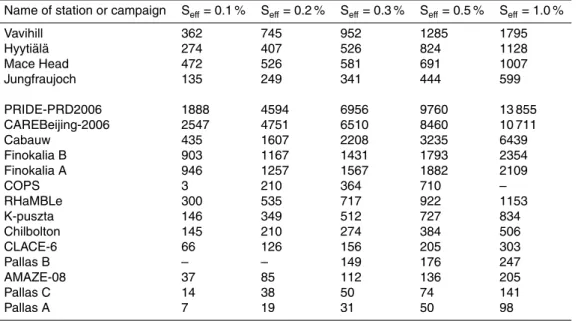
3 Results and discussion
3.1 CCN concentrations
Table 3 presents CCN number concentrationsNCCN at all 18 measurements locations and campaigns for fiveSefflevels mentioned in the previous section. First and foremost, since CCN are simply a fraction of the total aerosol population with their concentration
25
to-ACPD
15, 15039–15086, 2015A synthesis of CCNC measurements within
the EUCAARI network
M. Paramonov et al.
Title Page
Abstract Introduction
Conclusions References
Tables Figures
◭ ◮
◭ ◮
Back Close
Full Screen / Esc
Printer-friendly Version Interactive Discussion
Discussion
P
a
per
|
Discussion
P
a
per
|
Discussion
P
a
per
|
Discussion
P
a
per
|
tal particle number concentrations. The lowestNCCN values, thus, originate in remote and clean locations, such as Pallas, the Amazonian rainforest (AMAZE-08), Jungfrau-joch and Chilbolton. The highest NCCN values are found in more polluted locations – CAREBeijing-2006 and PRIDE-PRD2006, both in China. At lowerSeff levels, other ef-fects, such as those of size distribution and hygroscopicity, become more pronounced.
5
When examining NCCN at Seff of 0.1 %, the highest values are still found in China; similar toNCCN atSeff of 1.0 %, the lowest values are found in Pallas, the Amazonian rainforest (AMAZE-08), Jungfraujoch and also in south-west Germany (COPS).
In order to examine the CCN activation spectra in more detail, Fig. 3 presents cumu-lativeNCCNconcentrations shown as percentage of theNCCNmeasured at the highest
10
Seff of 1.0 %. One group of locations that can be pointed out in the figure is represen-tative of the marine environment: Finokalia, Mace Head and the RHaMBLe campaign. At these marine locations the presence of large and hygroscopic sea salt particles is expected, and a large fraction of particles already activates at the lowestSeff, i.e. of the totalNCCN measured at the highest Seff, about a third activates already at the lowest
15
Seff. In the case of Mace Head, the observed behaviour is due to the presence of sea salt particles and a peculiar organic composition of the marine aerosol (Ovadnevaite et al., 2011). Additionally, both Finokalia and Mace Head have a large fraction of the long-range transported and aged aerosol (Bougiatioti et al., 2009; Ovadnevaite et al., 2011), which has been shown to increase particle hygroscopicity (Perry et al., 2004;
20
Furutani et al., 2008). Chilbolton, being a continental background site representative of the regional aerosol properties, also belongs to this group; however, theNCCN concen-trations at this location may be underestimated due to the aerosol not being dried prior to entering the CCNC (Whitehead et al., 2014).
Another group of locations with a different CCN activation pattern is represented by
25
Pallas and Cabauw – at these locations very few particles activate at the lowestSeff, and theNCCNincreases drastically whenSeffchanges from 0.5 to 1.0 %. This may
ACPD
15, 15039–15086, 2015A synthesis of CCNC measurements within
the EUCAARI network
M. Paramonov et al.
Title Page
Abstract Introduction
Conclusions References
Tables Figures
◭ ◮
◭ ◮
Back Close
Full Screen / Esc
Printer-friendly Version Interactive Discussion
Discussion
P
a
per
|
Discussion
P
a
per
|
Discussion
P
a
per
|
Discussion
P
a
per
|
particles in the autumn and low aerosol hygroscopicity in Pallas have been previously reported by Tunved et al. (2003) and Komppula et al. (2006), respectively. The two measurement locations discussed here are interesting with regard to the ratio of pre-sumed cloud droplet number concentration (CDNC) to the total aerosol particle num-ber concentration. It has been reported that, although under the clean and convective
5
conditions ambientSc may reach as high as 1.0 %, in the polluted boundary layerSc
usually remains below 0.3 % (Ditas et al., 2012; Hammer et al., 2014; Hudson and Noble, 2014). If one assumes this value, a comparatively small fraction of aerosol in northern Finland and central Netherlands would potentially activate into cloud droplets if exposed to thisSc. This has direct implications for the cloud formation and, thus, local
10
climate at these locations.
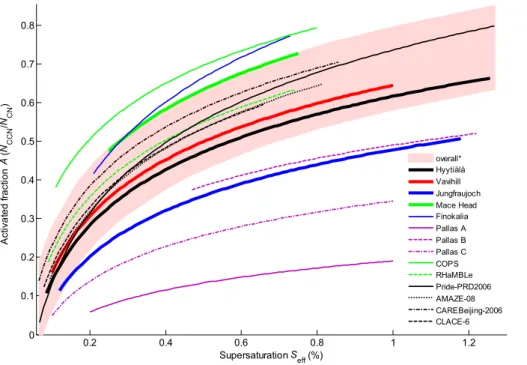
3.2 Activated fraction
Another variable describing CCN activation properties of an aerosol population that was examined for the majority of locations is the activated fractionAcalculated as a ra-tio ofNCCN toNCN(Fig. 4). Included in the figure is the overall fit shown with prediction
15
bounds (95 % confidence level) based on most of the activation curves, except those for Finokalia, COPS, Jungfraujoch and Pallas A, B and C. As can be seen in the figure from the similar shape and placement of the activation curves and in the Table 4 from the similar slope and intercept values, for many locations there is no discernible diff er-ence in howAresponds to changingSeff on an annual basis; this is further signified by
20
the prediction bounds of the overall fit. Therefore, the average total number concentra-tionNCN alone is sufficient in order to roughly estimate the annual mean NCCNat any givenSeff, for example, using the overall fit parameters presented in Table 4. ForSeff
levels below 0.3 % the variability of the overall fit, as shown by the prediction bounds, leads to the uncertainty of the predictedNCCN of up to an average of∼45 %. This un-25
ACPD
15, 15039–15086, 2015A synthesis of CCNC measurements within
the EUCAARI network
M. Paramonov et al.
Title Page
Abstract Introduction
Conclusions References
Tables Figures
◭ ◮
◭ ◮
Back Close
Full Screen / Esc
Printer-friendly Version Interactive Discussion
Discussion
P
a
per
|
Discussion
P
a
per
|
Discussion
P
a
per
|
Discussion
P
a
per
|
uncertainty in CDNC. Since the overwhelming majority of measurements analysed in this paper were conducted on land, and the overall fit results in an uncertainty of the predicted annual mean NCCN of up to ∼45 %, for many sites the use of the overall
fit would yield a deviation of the predicted average CDNC of approximately less than 10 %. CDNC, however, is more sensitive toNCCNin cleaner regions with low total
par-5
ticle number concentrations, such as the Alaskan Arctic and remote oceans (Moore et al., 2013). In such areas the use of the overall fit may not be appropriate.
Four locations stand out in Fig. 4 which were not included in the overall fit.Ais visibly higher in Finokalia and during the COPS campaign than in other locations, with approx-imately 60 % of the total aerosol population at both locations activating into cloud drops
10
at theSeff of∼0.4 %. Reasons for the observed behaviour in Finokalia were discussed in the preceding Sect. 3.1. During the COPS campaign the size distributions varied greatly, and, as will be shown later, Aitken mode aerosol was more hygroscopic than accumulation mode aerosol, possibly explaining the behaviour of the COPS activation curve seen in Fig. 4 at least for higherSefflevels (Irwin et al., 2010; Jones et al., 2011).
15
Another location with seemingly different activation curves is Pallas, where the activa-tion spectrum changes throughout the year, and even at fairly highSeff level of 1.0 %, less than half of the total aerosol population activated into cloud drops. The long-term Jungfraujoch dataset also exhibited comparatively lowAvalues, lower than those pre-sented by Jurányi et al. (2011) and those during the CLACE-6 campaign at the same
20
location (Fig. 4). While theA values in the long-term Jungfraujoch dataset were cal-culated with respect to CPC measurements of total particle number concentration, A
values for the CLACE-6 campaign and those reported by Jurányi et al. (2011) were cal-culated with respect to integrated SMPS size distribution measurements with a higher size cutoff. While the aerosol hygroscopicity at these locations will be discussed later,
25
the effect of the size distribution on the activation curves is evident.
ACPD
15, 15039–15086, 2015A synthesis of CCNC measurements within
the EUCAARI network
M. Paramonov et al.
Title Page
Abstract Introduction
Conclusions References
Tables Figures
◭ ◮
◭ ◮
Back Close
Full Screen / Esc
Printer-friendly Version Interactive Discussion
Discussion
P
a
per
|
Discussion
P
a
per
|
Discussion
P
a
per
|
Discussion
P
a
per
|
that was pointed out previously by Andreae (2009). This phenomenon can easily be illustrated using the example of the activation curve during the RHaMBLe cruise in the tropical North Atlantic. As will be discussed later, while theNCCN here is comparable to several other locations, the hygroscopicity of the aerosol is much higher, with the hygroscopicity parameter κ being just below unity across all studied sizes. Yet, the
5
fact that the aerosol is so hygroscopic seems to affect the activation efficiency of the aerosol in a similar manner as, for example, during the PRIDE-PRD2006 campaign in southeastern China. During this campaign absoluteNCCN was an order of magnitude higher than during the RHaMBLe cruise (Table 2), and the hygroscopicity was much lower (Rose et al., 2010). This order of magnitude difference inNCCN, a large difference
10
inκand at least some presumed difference in the shape of size distribution between the RHaMBLe cruise and the PRIDE-PRD2006 campaign seem to result in no apparent difference in the fraction of the aerosol that activates into cloud drops at any givenSeff. For most of the continental locations the overall fit presented in Table 4 can provide a reasonable estimation of annual meanNCCN based on theNCN for any givenSeff. It
15
should be kept in mind, however, that the activation curves in Fig. 4 for the long-term datasets do not reflect the potential short-term or seasonal variability, which, as can be seen in the example of the three Pallas campaigns, can be rather high. This and the fact that the short-term campaigns have been conducted during different seasons mean that the overall fit represents the annual mean activation behaviour and does not
20
capture the variability on the shorter time scales.
One important uncertainty associated with the comparison of the activation curves in Fig. 4 is the precise size range from whichNCNis determined. In order for the activation
curves to be directly comparable, the lower size limit ofNCN must be the same for all locations. In this study, data of the lower limit ofNCNfor each location (NCN,Dmin) were
25
ef-ACPD
15, 15039–15086, 2015A synthesis of CCNC measurements within
the EUCAARI network
M. Paramonov et al.
Title Page
Abstract Introduction
Conclusions References
Tables Figures
◭ ◮
◭ ◮
Back Close
Full Screen / Esc
Printer-friendly Version Interactive Discussion
Discussion
P
a
per
|
Discussion
P
a
per
|
Discussion
P
a
per
|
Discussion
P
a
per
|
fective activated fractions corresponding to a certain lower cutoff diameter A100 and A50, respectively. These were calculated for the four long-term measurement locations only (where the data were available), and the results of the comparison are depicted in Fig. 5. WhenN100 is used instead of NCN, the differences among locations described
above almost disappear except for the lowest values of S. In general, the activation
5
curve ofA100for Mace Head is similar to those for Hyytiälä, Vavihill and Jungfraujoch for
Seff above 0.4 %. In other words, when one considers the fraction of only accumulation mode particles that activates into cloud drops at any given Seff, the difference in how
Seff affectsA at all examined locations diminishes. In Hyytiälä, Vavihill and Jungfrau-joch particles with a dry diameter of 100 nm activate at theSeff of slightly higher than
10
0.2 % assuming an internally mixed aerosol. Around thisSeff Mace Head does exhibit a slightly higherA100 compared to other locations, possibly due to the increased CCN activity of the organically-enriched Aitken mode aerosol (Ovadnevaite et al., 2011).
When A50 is examined in detail, the difference between Mace Head and other lo-cations seen in Fig. 4 remains, with Mace Head exhibiting a higher activated fraction
15
compared to the three other locations. In Hyytiälä, Vavihill and Jungfraujoch particles with a dry diameter of 50 nm activate at aSeff of∼0.7 %, while in Mace Head these same particles activate at aSeffof∼0.55 %. Differences observed in Figs. 4 and 5 lead to the conclusion thatA50 andA100have a more stable dependence onS; i.e. the vari-ability in the fraction of nucleation/Aitken mode particles among different locations is
20
large. Consequently, when comparing datasets of activated fractionsAfrom several lo-cations with different expected concentrations of nucleation/Aitken mode particles and instrumental setups, a recommendation is made for the consideration of using N100
and/or N50 concentrations instead of NCN when calculating A coupled withA values derived from total number concentrations. Besides more systematic comparison of
ac-25
ACPD
15, 15039–15086, 2015A synthesis of CCNC measurements within
the EUCAARI network
M. Paramonov et al.
Title Page
Abstract Introduction
Conclusions References
Tables Figures
◭ ◮
◭ ◮
Back Close
Full Screen / Esc
Printer-friendly Version Interactive Discussion
Discussion
P
a
per
|
Discussion
P
a
per
|
Discussion
P
a
per
|
Discussion
P
a
per
|
spatial variability of the fraction of nucleation/Aitken mode particles, those less relevant for CCN activation at typical ambientSefflevels.
3.3 CCN and their hygroscopicity
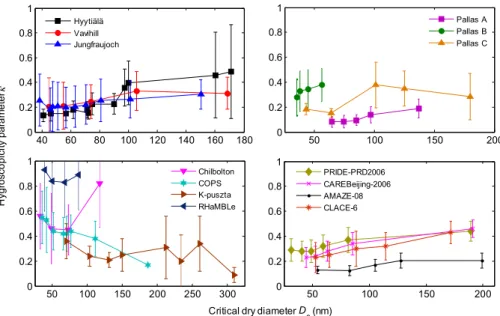
Critical dry diameterDcand hygroscopicity parameterκ were provided for the majority of the presented locations, and the variation of κ with dry size is seen in Fig. 6 (the
5
figure is split into four panels for better visual representation). The variation ofκ with dry size is not the same everywhere, and three groups can be pointed out.
In the first group of locationsκclearly increases with size; this is the case for Hyytiälä, Vavihill, Jungfraujoch (Fig. 6, upper left panel), Pallas (Fig. 6, upper right panel), and for the four campaigns conducted by the MPIC (Fig. 6, lower right panel). At these
10
locations accumulation mode particles have a higher hygroscopicity than the Aitken mode particles, likely due to cloud processing. The results of the Mann–WhitneyU test (Mann and Whitney, 1947) for two populations that are not normally distributed (below and above 100 nm of dry size; Paramonov et al., 2013) reveal that in Hyytiälä, Vavihill, Jungfraujoch and Pallas A and C the difference in κ is statistically significant at the
15
5 % significance level, i.e. the medianκof Aitken and accumulation mode particles are significantly different (Table 5). Published data for the PRIDE-PRD2006, CAREBeijing-2006, CLACE-6 and AMAZE-08 campaigns have previously reported such a trend (Rose et al., 2010; Gunthe et al., 2011; Rose et al., 2013; Gunthe et al., 2009, respec-tively). Data for Chilbolton (Fig. 6, lower left panel) also reveal an increase inκ with
20
size, although absoluteκvalues at this site may be underestimated due to the aerosol sample not being dried before entering the CCNC (Whitehead et al., 2014). Such be-haviour ofκ leads to two implications. First, as already discussed in Su et al. (2010) and Paramonov et al. (2013), the hygroscopicity of the whole aerosol population can, and in some cases should, be presented as a function of size; this can be done by
25
ACPD
15, 15039–15086, 2015A synthesis of CCNC measurements within
the EUCAARI network
M. Paramonov et al.
Title Page
Abstract Introduction
Conclusions References
Tables Figures
◭ ◮
◭ ◮
Back Close
Full Screen / Esc
Printer-friendly Version Interactive Discussion
Discussion
P
a
per
|
Discussion
P
a
per
|
Discussion
P
a
per
|
Discussion
P
a
per
|
Mass Spectrometer (AMS) measurements. The second implication here is that if, due to instrumental limitations, such measurements are representative only of the accumu-lation mode particles,κ values derived from such measurements should be extended to the Aitken mode particles with caution. The effect of extending the accumulation modeκ down to the Aitken mode was examined using detailed data from Hyytiälä as
5
an example. It was found that ifκof the accumulation mode is assumed to be the same for the Aitken mode, theNCCN, on average, is overestimated by 16 and 13.5 % for the
Seff of 0.6 and 1.0 %, respectively.
The second group of locations, or in this case only one location, exhibits a de-crease ofκ with particle dry size, and such a trend exists only for the COPS campaign
10
(Fig. 6, lower left panel). Apparently, at the mountainous site in the Black Forest region of south-west Germany the chemical composition of the accumulation mode aerosol makes it less hygroscopic compared with the Aitken mode at supersaturated conditions (Irwin et al., 2011). However, the same study reported that the measurements by the Hygroscopicity Tandem DMA (HTDMA) in a sub-saturated regime revealed an increase
15
ofκwith particle dry size.
The third group of locations, represented by the K-puszta station and RHaMBLe measurement campaign, is characterised by the absence of any dependence ofκ on the particle dry size. Though quite different in magnitude (Fig. 6, lower left panel),κ
values and, therefore, aerosol chemical composition seem to have no particular size
20
dependence across the whole measured size range. Also of interest is the high aerosol hygroscopicity across the whole investigated aerosol size range (Aitken mode) during the RHaMBLe cruise – allκvalues are just below unity (Good et al., 2010). The marine nature of the aerosol and clean background conditions of the remote tropical North Atlantic are likely responsible for high aerosol hygroscopicity.
25
Three of the four long-term datasets, excluding Mace Head, includedDcandκdata,
ACPD
15, 15039–15086, 2015A synthesis of CCNC measurements within
the EUCAARI network
M. Paramonov et al.
Title Page
Abstract Introduction
Conclusions References
Tables Figures
◭ ◮
◭ ◮
Back Close
Full Screen / Esc
Printer-friendly Version Interactive Discussion
Discussion
P
a
per
|
Discussion
P
a
per
|
Discussion
P
a
per
|
Discussion
P
a
per
|
y axis of the upper panel, particles measured at theSeff of 0.1 % are in the
accumula-tion mode, i.e.Dcis larger than 100 nm in diameter. Of the three stations presented,Dc
has an annual pattern only in Hyytiälä, with a minimumDcand an increased hygroscop-icity in the winter and a maximumDcand a decreased hygroscopicity in the summer, as
previously reported by Paramonov et al. (2013). The likely reason for a decrease in the
5
accumulation mode particle hygroscopicity in Hyytiälä in the summer is the increase in the emissions of the volatile organic compounds (VOCs), leading to an increase in secondary organic aerosol (SOA) formation and, thus, a higher organic fraction. The higher hygroscopicity in the winter can also be explained by a higher sulphate fraction, stronger aerosol oxidation and potentially other aging processes which are known to
10
increase particle hygroscopicity (Furutani et al., 2008). No annual pattern is present in the aerosol hygroscopicity of accumulation mode aerosol in Vavihill and Jungfraujoch. The lower panel in Fig. 7 depicts the annual variation of aerosol hygroscopicity for the Aitken mode aerosol, revealing no pattern for any of the three locations. The absence of a pattern coupled with the absence of an apparent difference among sites indicates
15
that the aerosol hygroscopicity of Aitken,∼50 nm aerosol is fairly similar and constant
throughout the year at all three locations.
The diurnal patterns of aerosol hygroscopicity were analysed for Hyytiälä, Vavihill and Jungfraujoch on a seasonal basis. It was discovered that for the accumulation mode particles, those measured at theSeff of 0.1 %, no diurnal pattern was observed
20
at any of the three locations in any of the seasons, indicating that throughout the day photochemistry does not have any apparent effect on the hygroscopicity of the accu-mulation mode particles. Diurnal patterns of aerosol hygroscopicity for Aitken mode particles can be seen in Fig. 8. In the winter no particular pattern is visible at any of the locations; it can, however, be seen that while the aerosol hygroscopicity is similar
25
ACPD
15, 15039–15086, 2015A synthesis of CCNC measurements within
the EUCAARI network
M. Paramonov et al.
Title Page
Abstract Introduction
Conclusions References
Tables Figures
◭ ◮
◭ ◮
Back Close
Full Screen / Esc
Printer-friendly Version Interactive Discussion
Discussion
P
a
per
|
Discussion
P
a
per
|
Discussion
P
a
per
|
Discussion
P
a
per
|
behaviour in Hyytiälä and have attributed it to the vegetation activity, photochemistry and the aging of organics during the sunlight hours (Sihto et al., 2011; Cerully et al., 2011; Paramonov et al., 2013). While no diurnal pattern of aerosol hygroscopicity is visible for Jungfraujoch for winter and spring, a very clear pattern does exist in the summer and autumn. In these seasons Aitken mode particles exhibit an obvious
de-5
crease in hygroscopicity in the afternoon shown by the peak inDc during these hours. This phenomenon has also been previously reported and attributed to the daytime intrusions of air from the planetary boundary layer (PBL) injecting less hygroscopic particles into the free troposphere (Kammermann et al., 2010a). The discussion above demonstrates that diurnal patterns of hygroscopicity are not the same everywhere and
10
vary by seasons; however, the environments of Hyytiälä and Vavihill are similar enough to result in similar diurnal patterns.
4 Conclusion
CCNC measurement data from 14 locations, including four long-term measurement sites, have been analysed, compared and discussed with respect to the deduced CCN
15
activation and hygroscopic properties. As already known, the pattern of howNCCNand
Arespond to the increasingS is indicative of the totalNCNconcentrations, the size dis-tribution of the pre-existing aerosol population and its hygroscopicity. Certain marine locations exhibited highA values and rapidly increasing NCCN even at low S values, as was the case during the COPS campaign in south-west Germany. At these
loca-20
tions aerosol populations are likely accumulation mode-dominated and/or of relatively high hygroscopicity. Pallas, a remote background location in northern Finland, exhib-ited a pattern of lowAvalues and slowly increasingNCCNat lowS values, revealing the likelihood of Aitken mode-dominated aerosol and/or fairly low hygroscopicity at this site. Jungfraujoch, a high Alpine site in the free troposphere, also exhibited comparatively
25
in-ACPD
15, 15039–15086, 2015A synthesis of CCNC measurements within
the EUCAARI network
M. Paramonov et al.
Title Page
Abstract Introduction
Conclusions References
Tables Figures
◭ ◮
◭ ◮
Back Close
Full Screen / Esc
Printer-friendly Version Interactive Discussion
Discussion
P
a
per
|
Discussion
P
a
per
|
Discussion
P
a
per
|
Discussion
P
a
per
|
creasingS was similar, i.e. at most locations the same fraction of aerosol activated into cloud drops at any givenS. For example, 20 % of the total aerosol population at most locations will activate into cloud drops at theSof 0.1 %. A simple linear fit for estimating annual meanNCCN at most continental locations is presented. When comparing
acti-vated fractionsAat several locations, a recommendation is made to use N100 and/or
5
N50 when calculatingAvalues together withAvalues derived from total number con-centrations. Using this technique, a more accurate comparison should be performed for sites where the exact size range ofNCN is not known and where the concentrations of nucleation/Aitken mode particles are expected to be high, additionally revealing more information about the effect of size distribution and hygroscopicity on CCN activation.
10
The hygroscopicity of aerosol particles as a function of size is not the same at all locations; while κ decreased with increasing size at a continental site in south-west Germany and was fluctuating without any particular size dependence across the ob-served size range in the remote tropical North Atlantic and rural central Hungary, all other locations exhibited an increase ofκwith size. In fact, at the rural background sites
15
of southern Finland and southern Sweden, at a free troposphere site in the Swiss Alps and at a remote background site in northern Finland the difference in hygroscopicity between Aitken and accumulation mode aerosol was statistically significant at the 5 % significance level. Therefore, assuming a size-independentκcan lead to a substantial overestimation ofNCCNat higher levels ofSeff (those above 0.6 %). The hygroscopicity
20
of the whole aerosol population can be presented separately for Aitken and accumu-lation mode particles; additionally, hygroscopicity distribution functions can be used to analyse size-resolved CCNC data and efficiently describe the size dependence of κ
(Lance, 2007; Su et al., 2010; Jurányi et al., 2013). It is known, however, that in most cases the size distribution and its variation have a larger effect on theNCCN than the
25
particle hygroscopicity and its variation with size.
ACPD
15, 15039–15086, 2015A synthesis of CCNC measurements within
the EUCAARI network
M. Paramonov et al.
Title Page
Abstract Introduction
Conclusions References
Tables Figures
◭ ◮
◭ ◮
Back Close
Full Screen / Esc
Printer-friendly Version Interactive Discussion
Discussion
P
a
per
|
Discussion
P
a
per
|
Discussion
P
a
per
|
Discussion
P
a
per
|
in February and a minimum in July. Such a pattern is likely attributed to the higher sul-phate fraction and stronger aerosol oxidation in the winter and active SOA formation and higher organic fraction in the summer. Among the same three sites, no diurnal trend of aerosol hygroscopicity was found for accumulation mode aerosol. The hygro-scopicity of the Aitken mode aerosol in Hyytiälä and Vavihill follows a clear diurnal
pat-5
tern in the spring and summer – an increase in aerosol hygroscopicity was observed in the afternoon, likely due to the photochemistry and aging of the organics. At the Jungfraujoch, Aitken mode aerosol showed a decrease in aerosol hygroscopicity in the afternoon during the summer and autumn; this phenomenon is caused by the injections from the planetary boundary layer containing somewhat less hygroscopic aerosol.
10
In general, the comparison of CCNC measurements is complicated by the variation of instrumental setups, settings, measurement times and intervals, performed calibra-tions, calculations and available parameters among sites. Supplementary data, such as aerosol size distribution and chemical composition, can enhance the uniformity of the analysis and expand the representativeness of the aforementioned results.
How-15
ever, as the first overview of its kind, the summary of CCNC measurements discussed here presents a unique insight into the CCN activation and hygroscopic properties in Europe and a few non-European sites. While, as shown here, CCNC measurements can provide useful information about the CCN and their activation into cloud droplets, the missing link in the aerosol-cloud interactions is the connection of CCN to the
am-20
bient CDNC. If filled, this gap can greatly improve our understanding of the processes and feedbacks within the aerosol-cloud-climate triangle and enhance the performance and accuracy of the global climate models.
Acknowledgements. The research leading to the results published herein has received funding from the ACTRIS Project of the European Union Seventh Framework Programme (FP7/2007–
25
2013) under grant agreement no 262254. Additional funding was provided by the Max Planck Society. HEA-PRTLI4 Environment and Climate: Impact and Responses programme, EC 6th Framework programme project EUCAARI (036833–2), EC 7th Framework programme project BACCHUS (603445) are all acknowledged. The authors would like to thank Jakub Bialek for collecting CCN data and Ciaran Monahan for SMPS measurements at Mace Head station. The
ACPD
15, 15039–15086, 2015A synthesis of CCNC measurements within
the EUCAARI network
M. Paramonov et al.
Title Page
Abstract Introduction
Conclusions References
Tables Figures
◭ ◮
◭ ◮
Back Close
Full Screen / Esc
Printer-friendly Version Interactive Discussion
Discussion
P
a
per
|
Discussion
P
a
per
|
Discussion
P
a
per
|
Discussion
P
a
per
|
authors would also like to thank Tuomo Nieminen and Ari Asmi for the help with statistics and data analysis. The Centre of Excellence in Atmospheric Science – from molecular and biologi-cal processes to the global climate FCoE, Cryosphere–atmosphere interactions in a changing Arctic climate CRAICC initiative and KONE foundation are acknowledged as well. The mea-surements at the Jungfraujoch were supported by MeteoSwiss in the framework of the Global
5
Atmosphere Watch programme and the infrastructure was supported by the International Foun-dation High Altitude Research Station Jungfraujoch and Gornergrat. M.G. was supported by the ERC under grant 615922-BLACARAT.
References
Andreae, M. O.: Correlation between cloud condensation nuclei concentration and aerosol
10
optical thickness in remote and polluted regions, Atmos. Chem. Phys., 9, 543–556, doi:10.5194/acp-9-543-2009, 2009.
Andreae, M. O. and Rosenfeld, D.: Aerosol-cloud-precipitation interactions. Part 1. The nature and sources of cloud-active aerosols, Earth-Sci. Rev., 89, 13–41, doi:10.1016/j.earscirev.2008.03.001, 2008.
15
Asmi, A., Wiedensohler, A., Laj, P., Fjaeraa, A.-M., Sellegri, K., Birmili, W., Weingartner, E., Bal-tensperger, U., Zdimal, V., Zikova, N., Putaud, J.-P., Marinoni, A., Tunved, P., Hansson, H.-C., Fiebig, M., Kivekäs, N., Lihavainen, H., Asmi, E., Ulevicius, V., Aalto, P. P., Swietlicki, E., Kris-tensson, A., Mihalopoulos, N., Kalivitis, N., Kalapov, I., Kiss, G., de Leeuw, G., Henzing, B., Harrison, R. M., Beddows, D., O’Dowd, C., Jennings, S. G., Flentje, H., Weinhold, K.,
Mein-20
hardt, F., Ries, L., and Kulmala, M.: Number size distributions and seasonality of submicron particles in Europe 2008–2009, Atmos. Chem. Phys., 11, 5505–5538, doi:10.5194/acp-11-5505-2011, 2011.
Beddows, D. C. S., Dall’Osto, M., Harrison, R. M., Kulmala, M., Asmi, A., Wiedensohler, A., Laj, P., Fjaeraa, A.M., Sellegri, K., Birmili, W., Bukowiecki, N., Weingartner, E.,
Bal-25
tensperger, U., Zdimal, V., Zikova, N., Putaud, J.-P., Marinoni, A., Tunved, P., Hansson, H.-C., Fiebig, M., Kivekäs, N., Swietlicki, E., Lihavainen, H., Asmi, E., Ulevicius, V., Aalto, P. P., Mi-halopoulos, N., Kalivitis, N., Kalapov, I., Kiss, G., de Leeuw, G., Henzing, B., O’Dowd, C., Jennings, S. G., Flentje, H., Meinhardt, F., Ries, L., Denier van der Gon, H. A. C., and Viss-chedijk, A. J. H.: Variations in tropospheric submicron particle size distributions across the
ACPD
15, 15039–15086, 2015A synthesis of CCNC measurements within
the EUCAARI network
M. Paramonov et al.
Title Page
Abstract Introduction
Conclusions References
Tables Figures
◭ ◮
◭ ◮
Back Close
Full Screen / Esc
Printer-friendly Version Interactive Discussion
Discussion
P
a
per
|
Discussion
P
a
per
|
Discussion
P
a
per
|
Discussion
P
a
per
|
European continent 2008–2009, Atmos. Chem. Phys., 14, 4327–4348, doi:10.5194/acp-14-4327-2014, 2014.
Bègue, N.: Evolution des propriétés physico-chimiques des aérosols désertiques issus de l’outflow africain, Ocean, Atmosphere, Université de la Réunion, Saint-Denis, Réunion, France, 2012.
5
Boucher, O. and Lohmann, U.: The sulfate-CCN-cloud albedo effect, Tellus B, 47, 281–300, 1995.
Boucher, O., Randall, D., Artaxo, P., Bretherton, C., Feingold, G., Forster, P., Kerminen, V.-M., Kondo, Y., Liao, H., Lohmann, U., Rasch, P., Satheesh, S. K., Sherwood, S., Stevens, B., and Zhang, X. Y.: Clouds and aerosols, in: Climate Change 2013: The Physical Science
10
Basis, Contribution of Working Group I to the Fifth Assessment Report of the Intergovern-mental Panel on Climate Change, edited by: Stocker, T. F., Qin, D., Plattner, G.-K., Tignor, M., Allen, S. K., Boschung, J., Nauels, A., Xia, Y., Bex, V., and Midgley, P. M., Cambridge Univer-sity Press, Cambridge, UK and New York, NY, USA, 571–657, 2013.
Bougiatioti, A., Fountoukis, C., Kalivitis, N., Pandis, S. N., Nenes, A., and Mihalopoulos, N.:
15
Cloud condensation nuclei measurements in the marine boundary layer of the Eastern Mediterranean: CCN closure and droplet growth kinetics, Atmos. Chem. Phys., 9, 7053– 7066, doi:10.5194/acp-9-7053-2009, 2009.
Brus, D., Neitola, K., Asmi, E., Aurela, M., Makkonen, U., Svensson, J., Hyvärinen, A.-P., Hir-sikkoa, A., Hakola, H., Hillamo, R., and Lihavainen, H.: Pallas cloud experiment, PACE 2012,
20
AIP Conf. Proc., 1527, 964, doi:10.1063/1.4803433, 2013.
Campanelli, M., Estelles, V., Smyth, T., Tomasi, C., Martìnez-Lozano, M. P., Claxton, B., Muller, P., Pappalardo, G., Pietruczuk, A., Shanklin, J., Colwell, S., Wrench, C., Lupi, A., Mazzola, M., Lanconelli, C., Vitale, V., Congeduti, F., Dionisi, D., Cardillo, F., Cacciani, M., Casasanta, G., and Nakajima, T.: Monitoring of Eyjafjallajökull volcanic aerosol by the new
25
European Skynet Radiometers (ESR) network, Atmos. Environ., 48, 33–45, 2012.
Carrico, M. C., Petters, M. D., Kreidenweis, S. M., Collett Jr., J. L., Engling, G., and Malm, W. C.: Aerosol hygroscopicity and cloud droplet activation of extracts of filters from biomass burning experiments, J. Geophys. Res., 113, D08206, doi:10.1029/2007JD009274, 2008.
Cerully, K. M., Raatikainen, T., Lance, S., Tkacik, D., Tiitta, P., Petäjä, T., Ehn, M., Kulmala, M.,
30