doi:10.5194/acp-11-12627-2011
© Author(s) 2011. CC Attribution 3.0 License.
Chemistry
and Physics
On aerosol hygroscopicity, cloud condensation nuclei (CCN) spectra
and critical supersaturation measured at two remote islands of
Korea between 2006 and 2009
J. H. Kim1, S. S. Yum12, S. Shim2, S.-C. Yoon3, J. G. Hudson4, J. Park5, and S.-J. Lee5
1Department of Atmospheric Sciences, Yonsei University, Seoul, Korea 2National Institute of Meteorological Research, Seoul, Korea
3School of Earth and Environmental Sciences, Seoul National University, Seoul, Korea 4Division of Atmospheric Sciences, Desert Research Institute, Reno, Nevada, USA 5National Institute of Environmental Research, Incheon, Korea
Received: 2 June 2011 – Published in Atmos. Chem. Phys. Discuss.: 11 July 2011
Revised: 18 November 2011 – Accepted: 25 November 2011 – Published: 15 December 2011
Abstract. Aerosol size distribution, total concentration (i.e. condensation nuclei (CN) concentration, NCN), cloud condensation nuclei (CCN) concentration (NCCN), hygro-scopicity at ∼90 % relative humidity (RH) were measured at a background monitoring site at Gosan, Jeju Island, south of the Korean Peninsula in August 2006, April to May 2007 and August to October 2008. Similar measure-ments took place in August 2009 at another background site (Baengnyeongdo Comprehensive Monitoring Observa-tory, BCMO) on the island of Baengnyeongdo, off the west coast of the Korean Peninsula. Both islands were found to be influenced by continental sources regardless of season and year. Average values for all of the measuredNCCN at 0.2, 0.6 and 1.0 % supersaturations (S),NCN, and geomet-ric mean diameter (Dg)from both islands were in the range of 1043–3051 cm−3, 2076–4360 cm−3, 2713–4694 cm−3, 3890–5117 cm−3and 81–98 nm, respectively. Although the differences inDg andNCNwere small between Gosan and BCMO,NCCN at various S was much higher at the latter, which is closer to China.
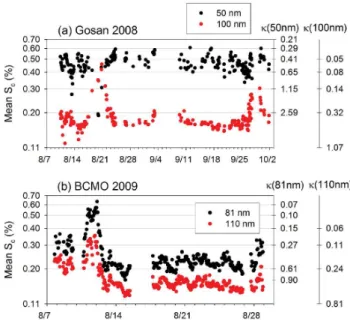
Most of the aerosols were internally mixed and no notable differences in hygroscopicity were found between the days of strong pollution influence and the non-pollution days for both islands. During the 2008 and 2009 campaigns, critical supersaturation for CCN nucleation (Sc)for selected particle sizes was measured. Particles of 100 nm diameters had mean Scof 0.19±0.02 % during 2008 and those of 81 and 110 nm
Correspondence to:S. S. Yum ([email protected])
diameters had meanScof 0.26±0.07 % and 0.17±0.04 %, respectively, during 2009. The values of the hygroscopic-ity parameter (κ), estimated from measuredSc, were mostly higher than theκ values obtained from the measured hygro-scopic growth at∼90 % RH.
1 Introduction
The necessity to gain sufficient understanding of cloud con-densation nuclei (CCN) has been increasing within the sci-entific community due to the realization that aerosol indi-rect effects that are initiated by anthropogenic emissions of CCN are imposing the greatest uncertainty in radiative forc-ing that is required for climate change predictions (IPCC, 2007; Schwartz et al., 2010). The CCN activity is controlled by the size of particles, the supersaturation (S) of the en-vironment surrounding the aerosols, the dissolution behav-ior of the particle within the droplet and its surface tension (Pruppacher and Klett, 1997).
With the development and the dissemination of techniques such as differential mobility analyzers (DMA) (Knutson and Whitby, 1975), measurements of ambient aerosol number size distribution have increased in the last few decades, al-though the global coverage of such data is still far from sufficient (Kumala et al., 2004) and the effort to systemati-cally combine surface measurement sites is only at its earliest stages only in the European region (Asmi et al., 2011).
Direct measurements of CCN are much scarcer due to the difficulty of the measurements and the lack of CCN instru-ments. Measuring the hygroscopicity of aerosols under sub-saturated water vapor conditions has been suggested as a way to estimate CCN activity of aerosols (e.g. Brechtel and Krei-denweis, 2000; Kreidenweis et al., 2005). In those stud-ies measured hygroscopicity was used to predict the critical supersaturation (Sc)or activation diameter (Dp act)of parti-cles, which is the thresholdSor diameter, respectively, above which the thermodynamic equilibrium between the aerosols and the surrounding vapor collapses and the vapor condensa-tion rate exceeds the evaporacondensa-tion rate. This leads to continu-ous growth of the particles, which are thus solution droplets. Recent development of a single parameter κ that incorpo-rates Raoult’s law and the Kelvin effect with the given value of surface tension of water made the quantitative comparison between hygroscopicity at sub-saturated condition and CCN activation more feasible (Petters and Kreidenweis, 2007).
For most of present day climate models, information on CCN number concentration (NCCN)at specificS values is needed. To fulfill this requirement, many attempts have been made to retrieveNCCNfrom aerosol hygroscopicity and size measurements at various regions such as subarctic (Kam-mermann et al., 2010), Amazon rainforest (Gunthe et al., 2009; Vestin et al., 2007; Zhou et al., 2002), coastal loca-tions (Dusek et al., 2003; Kuwata et al., 2008), rural conti-nental sites (Dusek et al., 2006; Gasparini et al., 2006) and large cities (Lance et al., 2009; Rose et al., 2010). Several authors have raised attention to the effect of the aerosol mix-ing state onNCCN (Ervens et al., 2010; Wang et al., 2010; Wex et al., 2010). However, hygroscopicity data for ambient aerosols is still far from sufficient (Swietlicki et al., 2008). ForSc measurement of size-selected ambient particles only a few studies are available (Hudson and Da, 1996; H¨ameri et
al., 2001; Dusek et al., 2006; Hudson, 2007; Cerully et al., 2011).
In this study, we try to characterize hygroscopicity andSc of aerosols measured in Asian continental outflow. Although several studies have investigated CCN and hygroscopic prop-erties of the aerosols in this region (e.g. Adhikari et al., 2005; Eichler et al., 2008; Kuwata et al., 2008; Kuwata and Kondo, 2008; Massling et al., 2007, 2009; Matsumoto et al., 1997; Mochida et al., 2010; Rose et al., 2010; Wiedensohler et al., 2009; Yum et al., 2005, 2007), the scope of their spatial and temporal coverage was very limited despite the fact that the region has been under heavy industrial development for the last several decades. Here we present results from four differ-ent field campaigns that took place at western coastal sites of two remote islands near the Korean Peninsula (Fig. 1) from 2006 to 2009.
2 Measurement and campaign description
2.1 Gosan, Jeju Island
On Gosan, Jeju Island two measurement shelters (about 10 m apart) located at the top of a cliff (33.2◦N, 126.1◦E, 70 m above sea level, Fig. 1) were used. Since local sources near this site are limited, it has served as a supersite for several in-ternational campaigns, including ACE-ASIA (Hubert et al., 2003), ABC-EAREX2005 (Nakajima et al., 2007), Pacific Dust Experiment (PACDEX) (Stith et al., 2009) and Cheju ABC Plume-Asian Monsoon Experiment (CAPMEX) (Ra-mana et al., 2010).
The measurements took place during three periods: 15 August–1 September 2006 (hereafter denoted as Gosan 2006); 14 April–16 May 2007 (Gosan 2007); 1 August–11 October 2008 (Gosan 2008). A TSI condensation particle counter (CPC) 3010 was used to measure total number con-centration of particles (i.e. condensation nuclei (CN) concen-tration,NCN). A separate SMPS system, which has its own CPC as a component, measured the size distributions of par-ticles of diameters 10–470 nm. Sample air for the SMPS was not dried except during Gosan 2008. For CCN number con-centration (NCCN) measurements, the Desert Research In-stitute Instantaneous CCN Spectrometers (CCNS) (Hudson, 1989) were used for Gosan 2006 and a Droplet Measure-ment Technologies (DMT) CCN counter (CCNC) (Roberts and Nenes, 2005) was used in all of the other campaigns.
Fig. 1. Locations of the measurement sites, Gosan and BCMO (Baengnyeongdo Comprehensive Monitoring Observatory).
CCNC calibration was done before BCMO 2009, again with monodisperse NaCl particles and there was a small calibra-tion drift. What had previously been 0.2, 0.4, 0.6, 0.8 and 1.0 %Swas then 0.19, 0.42, 0.66, 0.89 and 1.13 %S, respec-tively after the experiment. Note that the differences were especially small for theSc range 0.2–0.4 %, where most of the measuredSclies as will be shown later. For both CCNS and CCNC, the K¨ohler model denoted as analytical approxi-mation 1 (AA1) by Rose et al. (2008) was used to obtainSc of the particles.
AlthoughNCCN from CCNS was mainly used for Gosan 2006, CCNC was also available for a short period (6 days) during that campaign. For this overlapping period, NCCN from CCNS was−14 %, −4 %, 4 % and 6 % higher than NCCNfrom CCNC at 0.35 %, 0.52 %, 0.69 % and 0.86 %S, respectively. The coefficient of determination (r2)for 1 h-averagedNCCN was 0.77, 0.81, 0.89 and 0.85, respectively, for theseS.
Hygroscopic growth factors for dry particles between 50 and 250 nm were measured by a typical humidified tan-dem differential mobility analyzer (HTDMA). RH was mea-sured by 3 capacity-type RH sensors either from Vaisala (model HMM22d, uncertainty of±2 %RH) or Testo (model 06369735 and model 06369740, uncertainty of ±2 %RH) at the exits of the first DMA, the nafion humidifier and the sheath air of the second DMA. These RH sensors were cali-brated by the local distributors of the instruments before each campaign. Hygroscopicity measurements were done only for several hours of each day during Gosan 2006 while hygro-scopicity measurements were continuous during Gosan 2007 and 2008.
The mass concentration for particles smaller than 10 µm (PM10)and 2.5 µm (PM2.5)and gas concentrations of sulfur dioxide (SO2), carbon monoxide (CO), ozone (O3), nitro-gen dioxide (NO2)were measured with Met One BAM1020,
Fig. 2.Configuration of instruments for measuringNCCNand char-acterizingScduring Gosan 2008 and BCMO 2009. The grey trian-gles represent 3-way valves.
Met One FH-62, TEI 43C-TL, TEI 48C, TEI 49C and TEI 42CTL, respectively, at the second shelter maintained by NIER.
Scof monodisperse particles of selected sizes were mea-sured along withNCCNduring Gosan 2008 by the configura-tion shown in Fig. 2. The 3-way valves controlled whether the sample air followed the upper or lower branches in Fig. 2. For eachS, the sample air was first led to the lower branch for 180 s whenNCCNfor polydisperse aerosol was measured. Only the polydisperseNCCNdata from the last 30 s was used so that CCNC had completed theS transition from the pre-vious setting. Next, the sample air was led to the upper branch where it went through a dryer, aerosol neutralizer and DMA before reaching the CPC and CCNC. DMA se-lected monodisperse dry diameters (Ddry)were 50, 100 and 200 nm, although 200 nm data was not used in this study. For each size 85 s were consumed but only data from the last 30 s was used. After the monodisperseNCCN measurements for three sizes were completed, the instrument proceeded to the nextSand repeated the aforementioned procedure. When all 11Smeasurements were completed, an extra 480 s were as-signed to stabilizeSsince CCNC then had to change from the highestSto the lowestS. Therefore, it took approximately 86 min to obtain one complete CCN spectrum.
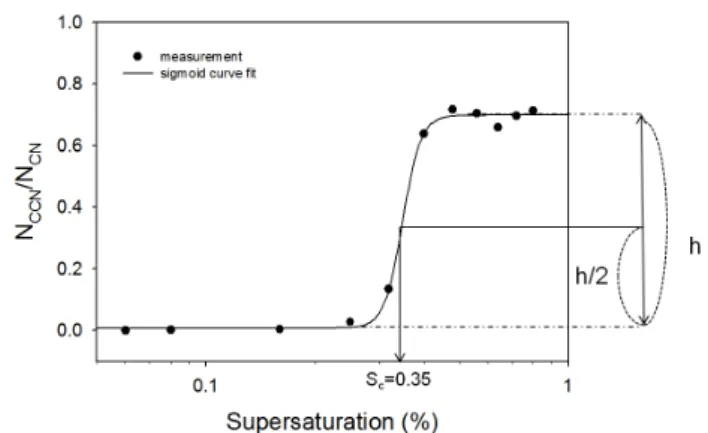
The resulting size-segregated NCCN toNCN ratios were plotted against 11 S points between 0.06 % and 0.8 % S (Fig. 3). Sc was then identified as the S at which the height of the fitted sigmoid curve was the half of the max-imum height. In order to take into account multiply charged aerosols, which would create a small hill at lowerS, the sig-moid curve was allowed to have a non-zero y-intercept. Dur-ing Gosan 2006 and Gosan 2007, this configuration was not used and both DRI CCNS and DMT CCNC measured only ambientNCCNin polydisperse mode.
2.2 BCMO, Baengnyeongdo
Fig. 3.Example ofSccharacterization for 100 nm dry particles.
NCCN/NCNwas measured at 12Spoints between 0.07 % and 1.3 %Sand the time needed for a complete CCN spectrum was 76 min. The aerosol size distribution was measured only for the last 3 days by TSI SMPS 3936L10. CCNC was cali-brated by a similar process as stated above.
PM10, PM2.5, SO2, CO, O3, NO2 were also measured
with Thermo 1400A, Thermo 1405, Teledyne 100A, Tele-dyne 300EU, TeleTele-dyne 400E and TeleTele-dyne 200AU, respec-tively.
3 Results
3.1 PM and gaseous species concentrations
Based on the daily average PM10, PM2.5, SO2, O3, CO, NO2
(or NOyfor BCMO 2009) concentration data, days with sig-nificant pollution were identified for each campaign. Such days were 17, 18 and 28 August 2006; 26, 27 April and 7 and 8 May 2007; 18–22 August and 30 September –11 Oc-tober 2008; and 13–16 August 2009. Relatively higher con-centrations of SO2and O3were general characteristics of the pollution periods and high PM2.5and PM10 concentrations were also found in all pollution periods except for the later pollution period in 2008. It should be noted that the distinc-tion between polludistinc-tion and non-polludistinc-tion days is relative. For example, according to the Flower et al. (2010) classification of pollution periods based on optical and chemical composi-tion measurement of aerosols at the Gosan site, 74 % of the days in August and September 2008 were designated pollu-tion days. The pollupollu-tion periods classified in this study were only a minor fraction of that pollution period.
Figure 4 shows average particle and gaseous concentra-tions for each classification. Gosan 2007 generally showed the highest concentrations for most species and the highest for all species for pollution periods. Meanwhile, Gosan 2006 showed the lowest PM10 and O3 concentrations among the four campaigns but CO concentrations for all data and non-pollution days were the highest. The SO2concentration
dur-ing Gosan 2008 was significantly lower than durdur-ing the other campaigns, but its CO concentration is comparable to those in the other campaigns. BCMO 2009 had the lowest PM2.5 and NO2(which is a subset of NOy)concentrations, but its SO2concentration was the highest among all four campaigns except for Gosan 2007 pollution days. Therefore, no cam-paign had all six species low. These results indicate that the two sites were exposed to continental sources to some extent, even for the non-pollution period within each campaign.
The CO concentrations measured during these campaigns were mostly above 0.3 ppm, which is much greater than the values measured in nonurban tropospheric air, 0.07–0.2 ppm (Hobbs, 2000). Based on a 13-yr long-term measure-ment, Kaneyasu (2010) reported that continental influence was evident from late autumn to spring at Chichi-jima Island (27.07◦N, 142.22◦E), which lies in the northwestern Pacific
1800 km to the east of Chinese coastline. Even during the rest of the seasons, the black carbon concentration was still higher than at other background sites around the world, sug-gesting that the region still might not be completely free from continental influence. Compared to Chichi-jima Island, both islands in this study are located at a distance much closer to continental sources (<100 km from the Korean Peninsula and<500 km from China). Based on ship measurements dur-ing a cruise from a port on Jeju Island to Shanghai, Kim et al. (2009a) found that the instantaneous minimumNCN in the East China Sea (1025 cm−3)was still higher than the av-erageNCNmeasured at other background marine regions by a factor of two to five (Bates et al., 2002; Covert et al., 1996; Hoppel et al., 1990; Yum and Hudson, 2001). These previous studies also suggest that the two islands were under constant continental influence although the continental source could be different. Since the contribution of sea salt is known to be only minor for PM10 or PM2.5at the two islands (Lee et al., 2007; Kim et al., 2009b), high PM10 concentration can be considered to originate from continents.
3.2 Aerosol size distributions and CCN spectra
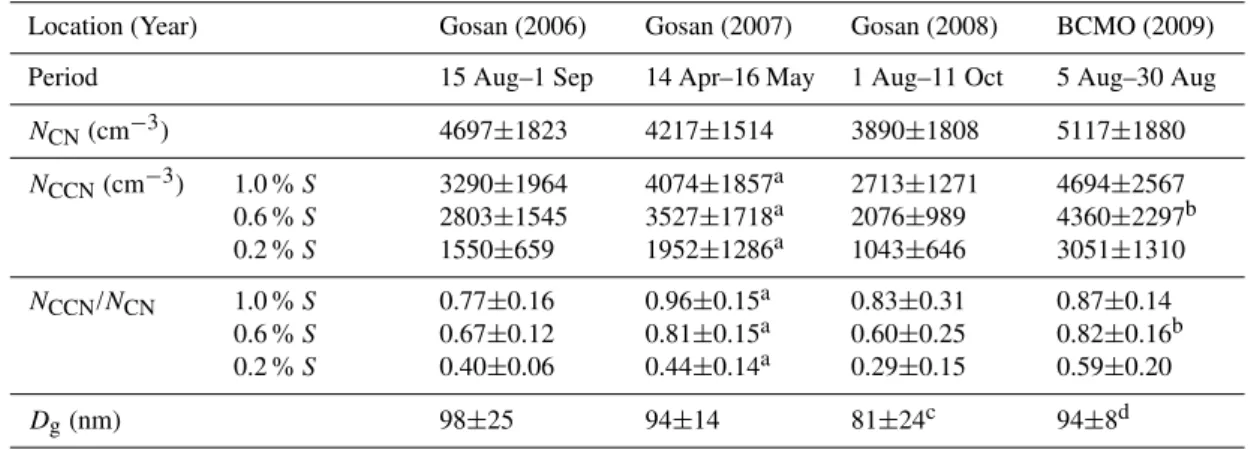
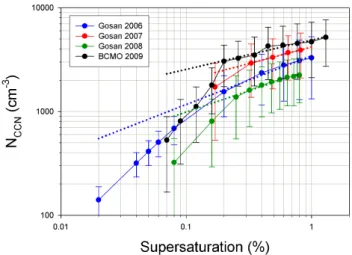
Averages and standard deviations ofNCN,NCCN, the ratio between the two and geometric mean diameter measured dur-ing each campaign are shown in Table 1. Average CCN spec-tra for each campaign are shown in Fig. 5.NCNfrom all four campaigns are comparable to that measured over the seas around the Korean Peninsula (Kim et al., 2009a), indicat-ing that the two islands represent the maritime environment of the region. However, the same values are also higher than those from a pollution event at Gosan during 2001 (Kim et al., 2005), again indicating that the two islands are constantly under continental influence.
Table 1.Average and standard deviation ofNCN,NCCN,NCCN/NCN, andDgfor each campaign.
Location (Year) Gosan (2006) Gosan (2007) Gosan (2008) BCMO (2009)
Period 15 Aug–1 Sep 14 Apr–16 May 1 Aug–11 Oct 5 Aug–30 Aug
NCN(cm−3) 4697±1823 4217±1514 3890±1808 5117±1880
NCCN(cm−3) 1.0 %S 0.6 %S 0.2 %S
3290±1964 2803±1545 1550±659
4074±1857a 3527±1718a 1952±1286a
2713±1271 2076±989 1043±646
4694±2567 4360±2297b 3051±1310
NCCN/NCN 1.0 %S 0.6 %S 0.2 %S
0.77±0.16 0.67±0.12 0.40±0.06
0.96±0.15a 0.81±0.15a 0.44±0.14a
0.83±0.31 0.60±0.25 0.29±0.15
0.87±0.14 0.82±0.16b 0.59±0.20
Dg(nm) 98±25 94±14 81±24c 94±8d
aOnly for the period 20 April–4 May. bN
CCNandNCCN/NCNfor 0.59 %S. cThe sample was dried prior to the measurement. dOnly for the period 26–28 August.
Fig. 5.Average CCN spectra (solid line) and power-law approxima-tion forS≥0.2 % (dotted line). The error bars represent standard deviations ofNCCN.
which surrounds Jeju Island. At BCMO, not onlyNCNbut alsoNCCN was higher than at Gosan during the other cam-paigns for all measured S≥0.1 % (Fig. 5). On the other hand, the lowest NCCN was measured during Gosan 2008. The smaller Dg during Gosan 2008 than during the other campaigns is thought to be due to the effect of drying the SMPS sample air only during this campaign.
Time series ofNCN,NCCN andDg are shown in Fig. 6. During pollution days,NCN andNCCN tended to be at lo-cal maxima, but similarly high concentrations were also fre-quently found during non-pollution days. Dg values were generally larger during pollution days, mostly larger than 100 nm, implying that they had gone through aging processes accompanied by condensation since their emission.
There were a few short periods during Gosan 2006 and Gosan 2008 when the air mass apparently had no contact with land surface for five days before reaching the site. Dur-ing such periods, NCN andNCCN were both much smaller than their averages. The data during such periods is provided as Supplement.
3.3 Hygroscopic growth factors below 90 % RH
For this section, growth factor (GF, defined as the ratio be-tween the wet diameter andDdry)values measured at vari-ous RH were converted to GF measured at 90 % RH (GF90) by the method illustrated in Swietlicki et al. (1999) to facil-itate comparison between different campaigns. In short, the method assumes that the relationship between GF and RH for ambient particles is similar to that of ammonium sulfate droplets of the same wet diameter except that the Kelvin ef-fect is considered. Converted GF90 values were then clas-sified into four categories; “nearly hydrophobic” for GF90 smaller than 1.15, “less hygroscopic” for GF90 between 1.15 and 1.55, “more hygroscopic” for GF90 between 1.55 and
1.85 (similar to GF90 of ammonium sulfate) and “very hy-groscopic” for GF90 larger than 1.85. This classification is similar to that by Massling et al. (2007) except that they de-noted the class with the largest GF90 as “sea salt”. Selected Ddrysizes varied in each campaign: 50, 100, 150 and 200 nm for Gosan 2006; 100, 150, 200 and 250 nm for Gosan 2007; 50, 100, 150, 200 and 250 nm for Gosan 2008; 53, 113, 163 and 225 nm for BCMO 2009.
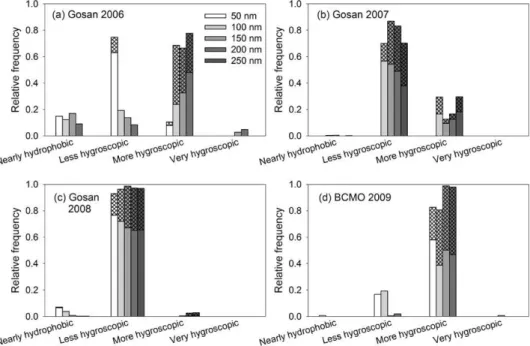
The relative frequency of occurrence, or the cumulative number fraction, of each hygroscopicity class is shown for each campaign and eachDdryin Fig. 7. Average GF90 val-ues, number fractions and number-weighted GF90 values for each size are listed in Table 2. As shown in Fig. 7, most of the GF90 values fell into either the less or more hygroscopic classes (1.15–1.85). Particles measured during Gosan 2007 and Gosan 2008 tended to show lower hygroscopicity com-pared to those measured during Gosan 2006 or BCMO 2009. Overall hygroscopicity was higher during BCMO 2009 than during the other campaigns. This is consistent with the above finding thatNCCN/NCN for S≤0.6 % and SO2 concentra-tions were the largest during BCMO 2009 of the four cam-paigns.
As for the mixing state, 82 %, 97 %, 99 % and 98 % of HT-DMA samples measured during Gosan 2006, Gosan 2007, Gosan 2008 and BCMO 2009, respectively, had only a sin-gle GF mode, suggesting that the aerosols were mostly inter-nally mixed or that all particles of each size range had very similar hygroscopicities. During Gosan 2006, Gosan 2007 and Gosan 2008, “nearly hydrophobic” particles were highly likely to be found (more than four out of five) when there was more than one GF mode. For Gosan 2008, however, more than half of “nearly hydrophobic” particles were found with a single GF mode. During BCMO 2009, “nearly hydropho-bic” particles were found only in a small fraction. Even when the sample had more than one GF mode, it consisted only of “less hygroscopic” and “more hygroscopic” modes, suggest-ing that these particles had gone through agsuggest-ing processes per-haps due to high sulfur concentrations in the region. GF90 distributions during pollution days were similar to those of non-pollution days, suggesting that continental sources were constantly affecting the sites even on the days classified as non-pollution days.
Fig. 6.Time plots of measuredNCN,NCCNandDgfor each campaign. Pollution periods are shaded in red.
The GF90 values in this study were mostly in the range of 1.4–1.7 for all sizes, similar to or even higher than the most hygroscopic modes measured in Beijing during sum-mer 2004 and winter 2005 (Massling et al., 2009), which is located at the dominant upwind region of the measurement sites. As with the previous discussion, this is another indica-tion that aerosols reaching the two islands have gone through chemical aging during transport.
3.4 Critical supersaturation (Sc)
Table 2. Average and standard deviation of GF90 and cumulative number fraction (NF) of each hygroscopicity class; class 1, 2, 3 and 4 corresponds to “nearly hydrophobic”, “less hygroscopic”, “more hygroscopic” and “very hygroscopic”, respectively.
Period Ddry
(nm)
GF90 1 GF90 2 GF90 3 GF90 4 NF 1 NF 2 NF 3 NF 4 Number
weighted GF90 Gosan 2006 50 100 150 200 250
1.00±0.06 1.05±0.04 1.04±0.03 1.02±0.02 –
1.40±0.11 1.50±0.05 1.52±0.02 1.51±0.03 –
1.59±0.03 1.66±0.06 1.71±0.09 1.67±0.08 –
– – 1.87±0.03 1.87±0.02 –
0.29±0.31 0.22±0.23 0.14±0.22 0.10±0.15 –
0.61±0.32 0.33±0.38 0.22±0.37 0.15±0.21 –
0.10±0.19 0.45±0.33 0.59±0.40 0.66±0.30 –
– – 0.05±0.16 0.09±0.16 – 1.30 1.47 1.58 1.60 – Gosan 2007 50 100 150 200 250 – 1.07±0.04 1.05±0.03 1.04±0.05 1.08±0.04
– 1.48±0.06 1.48±0.05 1.47±0.04 1.48±0.05
– 1.58±0.03 1.57±0.01 1.57±0.01 1.58±0.02
– – – 2.17* – – 0.05±0.08 0.05±0.11 0.03±0.10 0.03±0.06
– 0.66±0.23 0.70±0.26 0.67±0.25 0.66±0.25
– 0.30±0.25 0.25±0.24 0.30±0.25 0.32±0.23
– – – 0.04* – – 1.50 1.48 1.57 1.51 Gosan 2008 50 100 150 200 250
1.07±0.04 1.08±0.05 1.06±0.04 1.08±0.02 1.06±0.02
1.32±0.07 1.32±0.06 1.41±0.06 1.43±0.05 1.44±0.04
– – 1.57±0.01 1.58±0.02 1.57±0.01
– – – – –
0.22±0.25 0.14±0.25 0.09±0.19 0.04±0.10 0.03±0.10
0.78±0.25 0.86±0.25 0.87±0.22 0.88±0.23 0.85±0.25
– – 0.05±0.14 0.09±0.21 0.12±0.24
– – – – – 1.27 1.29 1.40 1.44 1.44 BCMO 2009 53 113 163 225
1.07±0.03 0.99±0.02 1.06±0.02 1.08±0.07
1.47±0.08 1.50±0.04 1.42±0.16 1.51±0.04
1.65±0.04 1.62±0.04 1.74±0.06 1.68±0.06
– – 1.87±0.03 1.92±0.05
0.04±0.08 0.01±0.03 0.01±0.04 0.04±0.10
0.24±0.31 0.25±0.32 0.04±0.11 0.07±0.15
0.72±0.31 0.74±0.32 0.87±0.20 0.85±0.21
– – 0.09±0.19 0.04±0.13
1.58 1.58 1.75 1.65
* Only a single measurement was available.
Fig. 7.Relative frequency of occurrence of each hygroscopicity class for each dry diameter during each campaign. Meshed part indicates the portion for pollution days. For BCMO 2009, dry diameters are 53, 113, 163, 225 nm.
During BCMO 2009,Scvalues for the two monodisperse dry particle sizes were relatively larger for the periods before 13 August than after 13 August. This distinction between these periods was also found in the PM2.5and SO2data.
Fig. 8.Time plots ofScduring Gosan 2008 (top) and BCMO 2009 (bottom). Theκvalues for correspondingSc values for each dry diameter are shown on the right.
a clear distinction in inorganic compounds of submicron par-ticles measured by an Aerodyne aerosol mass spectrometer at BCMO between the back trajectories that passed over the Korean Peninsula and those that passed over northeastern China, i.e. Shandong Peninsula or Bohai Bay. Nitrate was abundant for the former while sulfate was abundant for the latter. The difference inScbetween the two periods cannot be attributed to the difference in nitrate and sulfate concen-trations because nitrate is as hygroscopic as sulfate (Brechtel and Kreidenweis, 2000) and because the abundant amount of organics for both back trajectories also need to be considered. Different particle compositions, however, reveal that aerosol sources were different between the Korean Peninsula and northeastern China. From a field study during spring 2008, Mochida et al. (2010) reported that aerosols reaching Cape Hedo from China and the Pacific had higher GF and lower Dp act, compared to those from Korea and Japan, which may be supportive of our suggestion that aerosols from Chinese sources tend to have lowerSc compared to those from Ko-rean/Japanese sources. On the other hand, no such clear dis-tinction ofScwas found during Gosan 2008.
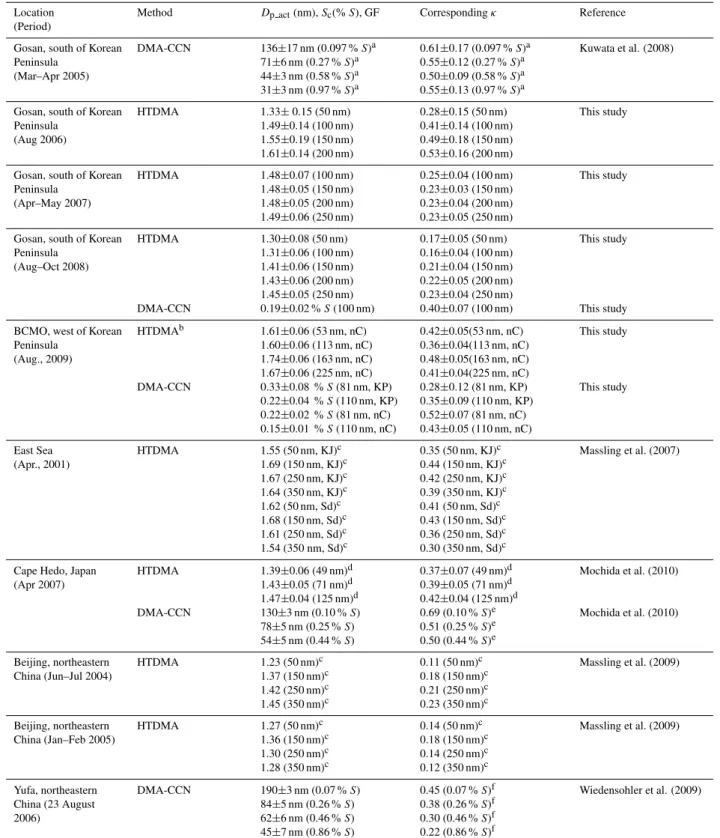
In Table 3 CCN activity parameters such asDp act,Sc or GF90 reported in previous studies in East Asia are compared with those measured in this study along with the correspond-ing values ofκ (Petters and Kreidenweis, 2007). The aver-ageScfor 50 nm during Gosan 2008 is not shown because Schigher than 0.61 % could not be estimated due to the lim-itedSrange as explained above. These samples were a non-negligible portion. Overall, theκ values measured during BCMO 2009 are higher than those measured during Gosan 2008, which is in accordance withNCCN/NCNand HTDMA measurements.
Although no previous studies have measured Sc in East Asia, several studies have characterized CCN activity by measuring theDp act with a similar instrument setup to that in Fig. 2. Those studies variedDdry and setSfixed (“Ddry scan”) while in this study insteadS was varied (“S scan”) andDdrywas fixed. Under the assumption that aerosols are all internally mixed and that aerosols have homogeneous hy-groscopicity across the whole submicron size range, CCN activity measured from both settings should agree with each other.
Su et al. (2010) quantified the difference between the two methods if aerosol hygroscopicity varies with particle size. They considered a case whenκvaried with size asκ=0.2×
D dry 20 nm
0.4
that causes much larger variations compared to the ones measured in this study. They concluded that the difference between the two methods due to size-dependent hygroscopicity should be relatively minor compared to the instrumental uncertainties. Since the aerosols were mostly internally mixed except for Gosan 2006, as discussed above, it would not be too misleading to compareSc in this study by “S scan” to the activation diameter obtained in previous studies by “Ddry scan” when both measured quantities are converted toκ.
As shown in Table 3, the values ofκ obtained at Gosan by HTDMA show a decreasing trend since 2005, and the de-crease is more significant for smallerDdry. Seasonal vari-ation is not sufficient to explain such a decreasing trend, since the 2005 campaign and Gosan 2007 were both car-ried out during late spring. Moreover, the measurement days of Gosan 2006 are covered by those of Gosan 2008. Such a trend is also found for DMA-CCN measurements: theκ values measured during 2005 are larger than those measured during Gosan 2008. Although the two DMA-CCN instru-ments were based on different concepts i.e. “Ddryscan” for 2005 and “Sscan” for 2008, the difference between the two sets ofκ values are too large to be attributed to a method-ological difference as discussed above. The reason behind such decreasing trend is left unknown.
Table 3.Comparison ofκvalues obtained from various hygroscopicity studies in East Asia. In BCMO 2009 and Massling et al. (2007), the results were classified by air mass back trajectories (nC: northern China, KP: Korean Peninsula, KJ: Korea/Japan, Sd: Shanghai/dust).
Location (Period)
Method Dp act(nm),Sc(%S), GF Correspondingκ Reference
Gosan, south of Korean Peninsula
(Mar–Apr 2005)
DMA-CCN 136±17 nm (0.097 %S)a 71±6 nm (0.27 %S)a 44±3 nm (0.58 %S)a 31±3 nm (0.97 %S)a
0.61±0.17 (0.097 %S)a 0.55±0.12 (0.27 %S)a 0.50±0.09 (0.58 %S)a 0.55±0.13 (0.97 %S)a
Kuwata et al. (2008)
Gosan, south of Korean Peninsula
(Aug 2006)
HTDMA 1.33±0.15 (50 nm) 1.49±0.14 (100 nm) 1.55±0.19 (150 nm) 1.61±0.14 (200 nm)
0.28±0.15 (50 nm) 0.41±0.14 (100 nm) 0.49±0.18 (150 nm) 0.53±0.16 (200 nm)
This study
Gosan, south of Korean Peninsula
(Apr–May 2007)
HTDMA 1.48±0.07 (100 nm) 1.48±0.05 (150 nm) 1.48±0.05 (200 nm) 1.49±0.06 (250 nm)
0.25±0.04 (100 nm) 0.23±0.03 (150 nm) 0.23±0.04 (200 nm) 0.23±0.05 (250 nm)
This study
Gosan, south of Korean Peninsula
(Aug–Oct 2008)
HTDMA 1.30±0.08 (50 nm) 1.31±0.06 (100 nm) 1.41±0.06 (150 nm) 1.43±0.06 (200 nm) 1.45±0.05 (250 nm)
0.17±0.05 (50 nm) 0.16±0.04 (100 nm) 0.21±0.04 (150 nm) 0.22±0.05 (200 nm) 0.23±0.04 (250 nm)
This study
DMA-CCN 0.19±0.02 %S(100 nm) 0.40±0.07 (100 nm) This study BCMO, west of Korean
Peninsula (Aug., 2009)
HTDMAb 1.61±0.06 (53 nm, nC) 1.60±0.06 (113 nm, nC) 1.74±0.06 (163 nm, nC) 1.67±0.06 (225 nm, nC)
0.42±0.05(53 nm, nC) 0.36±0.04(113 nm, nC) 0.48±0.05(163 nm, nC) 0.41±0.04(225 nm, nC)
This study
DMA-CCN 0.33±0.08 %S(81 nm, KP) 0.22±0.04 %S(110 nm, KP) 0.22±0.02 %S(81 nm, nC) 0.15±0.01 %S(110 nm, nC)
0.28±0.12 (81 nm, KP) 0.35±0.09 (110 nm, KP) 0.52±0.07 (81 nm, nC) 0.43±0.05 (110 nm, nC)
This study
East Sea (Apr., 2001)
HTDMA 1.55 (50 nm, KJ)c 1.69 (150 nm, KJ)c 1.67 (250 nm, KJ)c 1.64 (350 nm, KJ)c
1.62 (50 nm, Sd)c
1.68 (150 nm, Sd)c
1.61 (250 nm, Sd)c 1.54 (350 nm, Sd)c
0.35 (50 nm, KJ)c 0.44 (150 nm, KJ)c 0.42 (250 nm, KJ)c 0.39 (350 nm, KJ)c
0.41 (50 nm, Sd)c
0.43 (150 nm, Sd)c
0.36 (250 nm, Sd)c 0.30 (350 nm, Sd)c
Massling et al. (2007)
Cape Hedo, Japan (Apr 2007)
HTDMA 1.39±0.06 (49 nm)d 1.43±0.05 (71 nm)d 1.47±0.04 (125 nm)d
0.37±0.07 (49 nm)d 0.39±0.05 (71 nm)d 0.42±0.04 (125 nm)d
Mochida et al. (2010)
DMA-CCN 130±3 nm (0.10 %S) 78±5 nm (0.25 %S) 54±5 nm (0.44 %S)
0.69 (0.10 %S)e 0.51 (0.25 %S)e 0.50 (0.44 %S)e
Mochida et al. (2010)
Beijing, northeastern China (Jun–Jul 2004)
HTDMA 1.23 (50 nm)c 1.37 (150 nm)c 1.42 (250 nm)c 1.45 (350 nm)c
0.11 (50 nm)c 0.18 (150 nm)c 0.21 (250 nm)c 0.23 (350 nm)c
Massling et al. (2009)
Beijing, northeastern China (Jan–Feb 2005)
HTDMA 1.27 (50 nm)c 1.36 (150 nm)c 1.30 (250 nm)c 1.28 (350 nm)c
0.14 (50 nm)c 0.18 (150 nm)c 0.14 (250 nm)c 0.12 (350 nm)c
Massling et al. (2009)
Yufa, northeastern China (23 August 2006)
DMA-CCN 190±3 nm (0.07 %S) 84±5 nm (0.26 %S) 62±6 nm (0.46 %S) 45±7 nm (0.86 %S)
0.45 (0.07 %S)f 0.38 (0.26 %S)f 0.30 (0.46 %S)f 0.22 (0.86 %S)f
Wiedensohler et al. (2009)
aTaken from Table 2 of Kuwata et al. (2008).bNo HTDMA results were available for KP back trajectories.cAverage GF were calculated from number-weight averaging of the
GF values measured at 90 % RH in each hygroscopicity class given in the appendix tables in each study. Correspondingκvalues were then calculated from the average GF90 with T=15◦C.dGF values were measured at 85 % RH. Taken from Table 2 of Mochida et al. (2010).eCalculated from averageDp actin Table 1 of Mochida et al. (2010) with T=15◦C.
fCalculated from averageD
northeast China to BCMO, perhaps due to aging processes during the transport.
4 Discussion
4.1 CCN spectrum parameterization
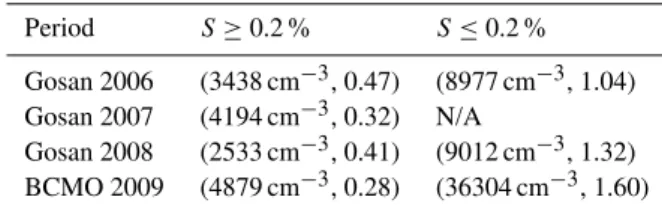
The power law approximation (NCCN=C×Sk) to CCN spectra is a convenient tool to model CCN spectra (Prup-pacher and Klett, 1997 and references therein; Hudson et al., 1998; Hudson and Yum, 2001; Yum and Hudson, 2001). In Fig. 5 such approximations are shown by dotted lines for each campaign with the corresponding color. The approx-imation is based onNCCN for S≥0.2 % but the lines are extrapolated to the lowestS. The range ofS≥0.2 % was se-lected for two reasons; the spectra show somewhat exponen-tial behavior in this range (suggested by the linearity of the spectra in Fig. 5) and several field studies that compared the measured cumulative CCN spectrum below cloud base with the measured cloud droplet concentrations in clouds sug-gested the effective supersaturation in clouds to be 0.2 % or higher for stratocumulus and stratus clouds (Yum et al., 1998; Yum and Hudson 2002; Hudson et al., 2010). The parameters (C,k) for power law approximation forS≥0.2 % are shown in Table 4. However, it should be noted that the power law approximation usually holds only for a limited range of S, as various previous studies have emphasized (Khain et al., 2000 and references therein). Dusek et al. (2003) have also argued that using a traditional power function is not backed by any physical reason and that its application should be con-fined only to clean marine CCN spectra. As can be seen in Fig. 5, although the power law approximation had highr2 values for the linear regression between the measured and pa-rameterizedNCCNvalues forS≥0.2 % (0.98, 0.96, 0.89 and 0.94 for 2006, 2007, 2008 and 2009 campaign, respectively), they all significantly overestimatedNCCN atS <0.2 % and the magnitude of overestimation increased with decreasing S. TheNCCN predicted by the power law approximation at 0.02 %S for Gosan 2006, and at 0.07 %S for Gosan 2008 and BCMO 2009 were 3.9, 3.2 and 4.3 times larger than the measured NCCN at the corresponding S, respectively. For that reason, the parametersC andkthat can be obtained by linearly extending the CCN spectra only forS≤0.2 % range to the lowestSfor each campaign in Fig. 5 are also shown in Table 4.
4.2 Comparison of hygroscopic growth and CCN
activation
Figure 9 compares the estimatedκ values from theSc mea-surements of monodisperse particles during Gosan 2008 (50 and 100 nm) and BCMO 2009 (110 nm) with those from the simultaneous HTDMA measurements for the same (for Gosan 2008) or very similar (113 nm for BCMO 2009) di-ameters. Theκ (GF) was calculated from the actual GF and
Fig. 9. Comparison of the estimated κ values from GF andSc measurements for 50 and 100 nm Ddry during Gosan 2008 and for 110 nmDdryduring BCMO 2009. The linear regression line (y=ax+b, thick solid line) and the coefficient of determination (r2)are also shown.
RH, not GF90. Most of theκ(Sc)were larger than the simul-taneously measuredκ(GF) although the difference between the two was much smaller for BCMO 2009. For each case the regression slopes were 1.64, 1.67 and 1.01, respectively, for the three plots in Fig. 9 and theirr2values were all below 0.6.
Table 4.ParametersCandkof the CCN spectra power law approx-imations for twoSranges in each campaign.
Period S≥0.2 % S≤0.2 %
Gosan 2006 (3438 cm−3, 0.47) (8977 cm−3, 1.04) Gosan 2007 (4194 cm−3, 0.32) N/A
Gosan 2008 (2533 cm−3, 0.41) (9012 cm−3, 1.32) BCMO 2009 (4879 cm−3, 0.28) (36304 cm−3, 1.60)
higherκ (Sc). Detailed chemical analysis of aerosols is out of the scope of this study but it was reported that a significant organic fraction was consistently found at the submicron size range both at Gosan (Lee et al., 2007) and BCMO (Kim et al., 2009b), which may have partially contributed to such an effect. However, as discussed later,NCCN prediction based onκ(Sc)resulted in significantly larger over-prediction com-pared to the prediction based onκ(GF). Such a result implies that sparingly soluble organics alone cannot explain the dif-ference between the two because if that were the case,κ(Sc) should result in better prediction thanκ(GF).
4.3 CCN closure study
Since CCN activity depends mostly onDdry, and hygroscop-icity,NCCN at a givenS can be calculated from the aerosol dry size distribution and hygroscopicity. Recently, Andreae and Rosenfeld (2008; hereafter AR08) put together vari-ous hygroscopicity measurements around the world and sug-gested thatκ=0.3±0.1could be used for global continental aged aerosols in numerical models targeted for understand-ing aerosol indirect effects on climate. A pioneerunderstand-ing study to investigate global distribution ofκ using global numeri-cal simulation also reached a similar result, 0.27±0.21, for continental aerosol (Pringle et al., 2010). As shown in pre-vious sections, it is certain that most of the aerosols mea-sured in this study have continental origin and that they have gone through aging processes during transport. Therefore, the data presented in this work will provide a suitable test bed for hygroscopicity values suggested by AR08. The fact that hygroscopicity was measured with high temporal reso-lution will also enhance the understanding of how size and temporal variation affectNCCN.
In order to do so, measuredNCCNwere compared with the values predicted by several different methods where hygro-scopicity was uniquely assigned to individual size bins for each method as shown in Table 5. Since all of these meth-ods require dry size distribution data, the CCN closure was performed only for the data obtained during Gosan 2008 be-cause the size distribution was not measured at dried state during the other campaigns. All aerosols were assumed to be internally mixed, since 99 % of the samples were internally mixed during Gosan 2008 as shown in the previous section.
With the assumption of all particles internally mixed in the same proportions for all sizes, aκ value is assigned to each size bin in dry size distribution data and compared with the minimumκ required for the particles in that size bin to be activated as CCN at a given S. If the assignedκ for that size bin is larger than the minimum κ for activation at the givenS, then all of the particles in that size bin are counted as CCN. After carrying out such comparisons and counting cumulatively the concentrations for every size bin that meets the condition, the predictedNCCNis obtained. One thing to note is thatκ can vary within each size bin because of com-position variations among particles in the same size bin but this was not taken into account in our study.
For the first method, denoted as “Method 1-GF”, measured GF was first converted to correspondingκ (GF, Ddry)and then was averaged hourly for every size bin. Then the 1-h averagedκ (GF,Ddry)was linearly interpolated over the size bins with log-uniform intervals. For the size bins lying outside of the hygroscopicity measurement, the measuredκ value of the nearestDdry was used. An example of such a procedure is shown in Fig. 10. The solid line indicates the assignedκ value for each size bin interpolated fromκ (GF, Ddry). The dashed line denotes the minimumκ required for particles in each size bin to be activated as CCN at 0.6 %S. The simultaneously measured dry aerosol size distribution is also shown. Only the particles in the size bins where the assignedκ values are greater than the minimumκ (colored in grey) are assumed to be activated as CCN and they are cumulatively counted for predictingNCCNat 0.6 %S.
The second method is similar to the first one except that it ignores the size-resolving information. This is to see the effect of size-resolved hygroscopicity on NCCN. The aver-ageκ (GF) from the two smallest diameters for each hour was applied to all size bins measured during that hour. The reason for choosing the two smallest diameters for repre-senting the hygroscopicity of the whole submicron aerosol becomes obvious in Fig. 11. Compared with the threshold κvalues for activation forSbetween 0.2–1.0 % (denoted by colored squares), most particles withDdrylarger than 150 nm can be activated for S≥0.2 % regardless of the choice of any κ within the measured range. On the other hand, the thresholdκfor activation increases sharply withDdrysmaller than 100 nm and CCN activity becomes sensitive toκ. This method is denoted as “Method 2-GF (small)”.
Table 5.Average and standard deviation of relative deviation, defined as|NCCN pred−NCCN meas|/NCCN meas, for different CCN closure methods using the GF and Sc data. The values are given in units of percent and the word in the parentheses indicates whether the closure results are dominated by underprediction (under-), overprediction (over-) or balanced.
Method Description 0.2 %S 0.6 %S 1.0 %S
1-GF Time varying and size segregated κ(GF) are used
28±20 (under-) 25±52 (balanced) 19±15 (balanced)
2.GF (small) Time varying averageκ(GF) for 50 and 100 nm are used for all sizes.
32±17 (under-) 25±51 (balanced) 19±14 (balanced)
2-GF (large) Time varying average κ(GF) for 200 and 250 nm are used for all sizes.
25±24 (under-) 31±57 (over-) 22±17 (balanced)
3-GF Size segregated but temporally aver-agedκ(GF) are used for all time.
28±38 (under-) 26±39 (over-) 23±29 (balanced)
2-Sc Time varyingκ(Sc)for 100 nm is used for all sizes.
38±42 (over-) 42±57 (over-) 30±37 (over-)
3-Sc Temporally averagedκ(Sc)for 100 nm is used for all sizes and time.
50±68 (over-) 47±61 (over-) 34±42 (over-)
AR08 Fixedκvalue of 0.3 is used for all sizes and time.
30±51 (over-) 41±56 (over-) 28±35 (over-)
AR08-refined Fixedκvalue of 0.17 and 0.3 is used for sizes below and above 100 nm, respec-tively, for all time.
28±38 (under-) 26±39 (over-) 23±29 (balanced)
Fig. 10.An example of predictingNCCNat 0.6 %Sby combining measuredκ(GF) (line with circle symbols) with the size distribu-tion. The dashed line denotes the minimumκrequired for each size bin to be activated as CCN at 0.6 %S. Only the grey vertical boxes are summed up to obtain the predictedNCCNbased on the GF mea-surement. The error bars represent standard deviations ofκ(GF).
κ forNCCN closure and this method is denoted as “Method 2-Sc”.
In “Method 3-GF”, the campaign-averaged κ values de-duced from the GF measurements at the five different diam-eters shown in Table 3 are used to assignκ to each size bin as explained in Fig. 10. Here the difference is that these
val-Fig. 11. Hygroscopicity parameterκfor eachDdry during Gosan 2008. κ(GF) andκ(Sc)are calculated from measured GF andSc values, respectively. Thresholdκvalues for CCN activation under selectedSare shown as colored squares. The horizontal bar within the box indicates the median value and the upper and lower ends of the box represent 75 and 25 percentiles, respectively. The upper and lower whiskers outside the box represent 90 and 10 percentiles, respectively. Data outside of the 10–90 percentile range are consid-ered outliers and each data point is marked with an open circle.
“Method 1”, the effect of temporal variation of hygroscopic-ity can be found.
For the last method, “Method AR08”,κ was set to 0.3 as suggested by AR08 and only the temporal variation of the size distribution was taken into account.
The results of all closures are illustrated in Fig. 12 and the quantitative comparison of the results is made in Table 5 where the averages and standard deviations of relative devia-tion, are shown, which is defined as the ratio of the absolute difference between predicted and measured NCCN to mea-suredNCCN. Also shown in the table is the short description for each method and whether the closure results are domi-nated by under-prediction, over-prediction or balanced. The closure results only for the pollution days showed no notice-able difference compared to those for non-pollution days.
For all methods, the smallest average relative deviation was found for 1.0 %S indicating that the importance of as-signedκinformation diminishes asSincreases because most particles would be activated regardless of theirκvalue when Sis high. The largest standard deviation of relative deviation was found for 0.6 %S, which means that accuracy ofNCCN prediction significantly varied from case to case for thisS. For 0.6 %S, measuredκwas near the threshold value for 50 and 100 nm (Fig. 11) and therefore predictedNCCNwas most sensitive to the assignedκ.
Now we compare the different methods. It is found that the averageκfor the two largest diameters (200 and 250 nm) poorly represents aerosol hygroscopicity for higherS: the relative deviation of “Method 2-GF (large)” for 0.6 %S is not only larger than “Method 2-GF (small)” but also larger than “Method 3-GF” where temporal variation of hygroscop-icity was completely ignored. This suggests that chemistry information of aerosols smaller than 100 nm diameter can-not be substituted by bulk measurements that mostly repre-sent aerosols of larger diameters than 100 nm. Kammermann et al. (2010) drew a similar conclusion from their GF mea-surements, i.e. that assigning the hygroscopicity measured for aerosols of diameter 180–200 nm to all sizes resulted in poor CCN closure. Ervens et al. (2010) also made a similar suggestion that identifying hydrophobic organics of diameter
∼100 nm is important for CCN closure.
Because the relative deviation of Method 3-GF is compa-rable to that of Method 1-GF, it can be said that the effect of temporal variation of hygroscopicity had a minor effect on CCN closure. However, it should be noted that Gosan 2008 lasted only 2 months and temporal variations of hygroscop-icity may be important when one needs to deal with longer periods.
The methods using Sc data (Method 2-Sc, Method 3-Sc)show larger relative deviations than the methods using GF data. Even the method using the constant κ (Method AR08) shows smaller relative deviations. There were many more over-predicted than under-predicted values for these two methods (Fig. 12e and f), which is in accordance with
Fig. 9b whereκ(Sc)was larger thanκ(GF) and mostly larger thanκ=0.3.
The comparison between the CCN prediction by Method 1 and that by Method AR08 is shown in Fig. 12h. As-suming the constantκ of 0.3 resulted in over-prediction by 64±58 %, 33±27 % and 14±14 % for 0.2, 0.6 and 1.0 % S, respectively, compared to Method 1. The degree of dis-agreement between the two methods is larger for lower S. This implies that using theNCCNpredicted by AR08 as input to a model that calculates cloud droplet concentration (e.g. Cubison et al., 2008) could result in higher cloud droplet concentration than using theNCCN predicted by Method 1. Eventually this could result in overestimation of droplet con-centrations in cloud models and this would impact cloud properties.
Figure 13 illustrates detailed feature of the over-prediction when using Method AR08. Here relative deviations from Method AR08 are compared to those from Method 1-GF as a function of NCCN at 0.6 % S. The relative devia-tions of Method AR08 tend to increase asNCCN decreases from the largest (3787–7203 cm−3)to the smallest bin (289– 550 cm−3)(Fig. 13a). Figure 13b shows a trend of increasing number fraction of particles withDdry<100 nm with the de-crease ofNCCN. It is worth noting that although secondary particle formation and growth events occurred during Gosan 2008, increasing relative deviations or number fraction of particles havingDdry<100 nm cannot be attributed to these events since data during these events was only a minor frac-tion of the total data. Such correlated trends indicate that the over-prediction by Method AR08 is due to assigningκ values that are too high for particles havingDdry<100 nm (Fig. 11), which results in false activation of particles that are too small to be activated. Kammermann et al. (2010) also found thatκ of 0.3 predicted GF values that were too high and that were rarely measured at that subarctic site. This also explains why the method that uses GF data resulted in much less over-prediction and again demonstrates that hygroscop-icity measurements for small aerosols (Ddry<100 nm) are important for estimatingNCCN.
Fig. 12. (a–g)CCN closure results from various methods and(h)comparison between Method 1 and Method AR08. For the description of each method, see Table 5. The dotted lines indicate±50 % error.
5 Summary and conclusion
Aerosol hygroscopic growth factor, CCN spectra and critical supersaturation (Sc)were measured at two remote Korean islands (Gosan, Jeju Island and Baengnyeongdo Compre-hensive Monitoring Observatory (BCMO), Baengnyeongdo) along with aerosol concentration and size distribution during four field campaigns held in: August 2006 (Gosan); April– May 2007 (Gosan); August–October 2008 (Gosan) and
Au-gust 2009 (BCMO). Total aerosol concentrations (NCN) at the two islands were comparable to those measured over the nearby seas, indicating that the local anthropogenic sources within the islands were negligible. However, PM2.5, PM10,
Fig. 13. (a) Relative deviations, defined as |NCCN predNCCN meas|/NCCN meas, for methods 1 and 4, and(b) the number fraction of particles smaller than 100 nmDp for each NCCN bin. The schematic plots are drawn in the same manner as explained in Fig. 11.
supersaturation (S),NCNand geometric mean diameter (Dg) from both islands were in the range of 1043–3051 cm−3, 2076–4360 cm−3, 2713–4694 cm−3, 3890–5117 cm−3 and 81–98 nm, respectively, and BCMO recorded the highest NCCNfor allSwhen compared to Gosan measurements. Sig-nificantly higher SO2 concentrations at BCMO may be re-sponsible for the highNCCN/NCNforS≤0.6 as SO2is the precursor of sulfates.
The aerosols were mostly internally mixed, although a minor fraction of samples contained externally mixed hy-drophobic aerosols. No significant differences in hygroscop-icity were found between pollution and non-pollution days at both islands suggesting that continental sources were con-stantly affecting the sites even on days classified as non-pollution days. Greater hygroscopicity (lowerSc)was mea-sured at BCMO for all sizes compared to Gosan. This is consistent with higher SO2of BCMO. Generally, the hygro-scopicity measured at the two islands was similar to that
mea-sured during ACE-Asia over the sea 500 km east of Gosan but it was significantly higher than that measured at a site downwind of Beijing, indicating that aerosols measured at Gosan might have experienced aging processes during their transport, which added to their hygroscopicity.
During the 2008 and 2009 campaigns, critical supersatu-rations for CCN activation (Sc)of particles of selected sizes were estimated by size-resolvedNCCN/NCNmeasurements. TheseScvalues at BCMO were distinctly different depend-ing on whether the air masses came from China (lowerSc)or Korea/Japan (higherSc). This distinction was not observed at Gosan. By compiling all HTDMA and DMA-CCN mea-surements that were conducted at Gosan since 2005, we sug-gest that aerosol hygroscopicity may have decreased during this period. An important result was that hygroscopicity es-timated from theSc measurements was higher than hygro-scopicity based on GF measurements. The reason for this is not yet clear.
The temporally varying and size-resolved HTDMA hygroscopicity data predicted NCCN with average rela-tive deviations of 28±20 % (under-prediction dominant), 25±52 (balanced between over- and under-prediction) and 19±15 % (balanced) for 0.2, 0.6 and 1.0 %S, respectively. Comparisons of various CCN closure methods that used HT-DMA data suggested that it was crucial to know hygroscop-icity of aerosols smaller than 100 nm diameter for accurately predictingNCCN. Prescribing a fixed hygroscopicity value as suggested by Andreas and Rosenfeld (2008) for aged con-tinental aerosols resulted in average relative deviations in the range of 25–40 % with over-prediction dominant. The relative deviation tended to increase with decreasingNCCN, which was accompanied by an increase of the sub-100 nm fraction. Considering the fact that numerical models usu-ally varyNCCN to simulate aerosol effects on clouds, such findings indicate the potential error of using a constant hy-groscopicity as a global representative value for aged con-tinental aerosol. Using different hygroscopicities for differ-ent particle sizes might be a better way to represdiffer-ent conti-nental CCN distributions in models as demonstrated by the much improved CCN closure when the hygroscopicity value of 0.17 was used for sub-100 nm instead of prescribing the constant hygroscopicity value of 0.3 for all sizes.
Supplementary material related to this article is available online at:
http://www.atmos-chem-phys.net/11/12627/2011/ acp-11-12627-2011-supplement.pdf.
led to a great improvement of the manuscript. This work was funded by the Korea Meteorological Administration Research and Development Program under Grant RACS 2010-5001.
Edited by: M. Gysel
References
Adhikari, M., Ishizaka, Y., Minda, H., Kazaoka, R., Jensen, J. B., Gras, G. L., and Nakajima, T.: Vertical distribution of cloud condensation nuclei concentrations and their effect on microphysical properties of clouds over the sea near the southwest islands of Japan, J. Geophys. Res., 110, D10203, doi:10.1029/2004JD004758, 2005.
Andreae, M. O. and Rosenfeld, D.: Aerosol–cloud–precipitation interactions. Part 1. The nature and sources of cloud-active aerosols, Earth-Sci. Rev., 89, 13–41, 2008.
Asmi, A., Wiedensohler, A., Laj, P., Fjaeraa, A.-M., Sellegri, K., Birmili, W., Weingartner, E., Baltensperger, U., Zdimal, V., Zikova, N., Putaud, J.-P., Marinoni, A., Tunved, P., Hansson, H.-C., Fiebig, M., Kivek¨as, N., Lihavainen, H., Asmi, E., Ulevicius, V., Aalto, P. P., Swietlicki, E., Kristensson, A., Mihalopoulos, N., Kalivitis, N., Kalapov, I., Kiss, G., de Leeuw, G., Henzing, B., Harrison, R. M., Beddows, D., O’Dowd, C., Jennings, S. G., Flentje, H., Weinhold, K., Meinhardt, F., Ries, L., and Kulmala, M.: Number size distributions and seasonality of submicron par-ticles in Europe 20082009, Atmos. Chem. Phys., 11, 5505–5538, doi:10.5194/acp-11-5505-2011, 2011.
Bates, T. S., Coffman, D. J., Covert, D. S., and Quinn, P. K.: Re-gional marine boundary layer aerosol size distributions in the In-dian, Atlantic, and Pacific Oceans: A comparison of INDOEX measurements with ACE-1, ACE-2, and Aerosol 99, J. Geophys. Res., 107, 8026, doi:10.1029/2001JD001174, 2002.
Brechtel, F. J. and Kreidenweis, S. M.: Predicting particle critical supersaturation from hygroscopic growth measurements in the humidi?ed TDMA. Part I: Theory and sensitivity Studies, J. At-mos. Sci., 57, 1854–1871, 2000.
Cerully, K. M., Raatikainen, T., Lance, S., Tkacik, D., Tiitta, P., Pet¨aj¨a, T., Ehn, M., Kulmala, M., Worsnop, D. R., Laaksonen, A., Smith, J. N., and Nenes, A.: Aerosol hygroscopicity and CCN activation kinetics in a boreal forest environment during the 2007 EUCAARI campaign, Atmos. Chem. Phys. Discuss., 11, 15029–15074, doi:10.5194/acpd-11-15029-2011, 2011. Covert, D. S., Kapustin, V. N., Bates, T. S., and Quinn, P. K.:
Phys-ical properties of marine boundary layer aerosol particles of the mid-Pacific in relation to sources and meteorological transport, J. Geophys. Res., 101, 6919–6930, 1996.
Cubison, M. J., Ervens, B., Feingold, G., Docherty, K. S., Ulbrich, I. M., Shields, L., Prather, K., Hering, S., and Jimenez, J. L.: The influence of chemical composition and mixing state of Los Angeles urban aerosol on CCN number and cloud properties, At-mos. Chem. Phys., 8, 5649–5667, doi:10.5194/acp-8-5649-2008, 2008.
Dusek, U., Covert, D. S., Wiedensohler, A., Neus¨uss, C., Weise, D., and Cantrell, W.: Cloud condensation nuclei spectra derived from size distributions and hygroscopic properties of the aerosol in coastal south-west Portugal during ACE-2, Tellus, 55B, 35– 53, 2003.
Dusek, U., Frank, G. P., Hildebrandt, L., Curtius, J., Schneider, J.,Walter, S., Chand, D., Drewnick, F., Hings, S., Jung, S., Bor-rmann, S., and Andreae, M. O.: Size matters more than chem-istry for cloud-nucleating ability of aerosol particles, Science, 312, 1375–1378, 2006.
Eichler, H., Cheng, Y. F., Birmili, W., Nowak, A., Wiedensohler, A., Br¨uggemann, E., Gnauk, T., Herrmann, H., Althausen, D., Ansmann, A., Engelmann, R., Tesche, M., Wendisch, M., Zhang, Y. H., Hu, M., Liu, S., and Zeng, L. M.: Hygroscopic properties and extinction of aerosol particles at ambient relative humidity in South-Eastern China, Atmos. Environ., 42, 6321–6334, 2008. Ervens, B., Cubison, M. J., Andrews, E., Feingold, G., Ogren, J.
A., Jimenez, J. L., Quinn, P. K., Bates, T. S., Wang, J., Zhang, Q., Coe, H., Flynn, M., and Allan, J. D.: CCN predictions using simplified assumptions of organic aerosol composition and mix-ing state: a synthesis from six different locations, Atmos. Chem. Phys., 10, 4795–4807, doi:10.5194/acp-10-4795-2010, 2010. Flowers, B. A., Dubey, M. K., Mazzoleni, C., Stone, E. A.,
Schauer, J. J., Kim, S.-W., and Yoon, S. C.: Optical-chemical-microphysical relationships and closure studies for mixed car-bonaceous aerosols observed at Jeju Island; 3-laser photoa-coustic spectrometer, particle sizing, and filter analysis, Atmos. Chem. Phys., 10, 10387–10398, doi:10.5194/acp-10-10387-2010, 2010
Gasparini, R., Collins, D. R., Andrews, E., Sheridan, P. J., Ogren, J. A., and Hudson, J. G.: Coupling aerosol size distributions and size-resolved hygroscopicity to predict humidity-dependent opti-cal properties and cloud condensation nuclei spectra, J. Geophys. Res., 111, D05S13, doi:10.1029/2005JD006092, 2006. Gunthe, S. S., King, S. M., Rose, D., Chen, Q., Roldin, P., Farmer,
D. K., Jimenez, J. L., Artaxo, P., Andreae, M. O., Martin, S. T., and P¨oschl, U.: Cloud condensation nuclei in pristine tropi-cal rainforest air of Amazonia: size-resolved measurements and modeling of atmospheric aerosol composition and CCN activity, Atmos. Chem. Phys., 9, 7551–7575, doi:10.5194/acp-9-7551-2009, 2009.
H¨ameri, K., V¨akev¨a, M., Aalto, P. P., Kulmala, M., Swietlicki, E., Zhou, J., Seidl, W., Becker, E., and O’Dowd, C. D.: Hygroscopic and CCN properties of aerosol particles in boreal forests, Tellus, 53B, 359–379, 2001.
Hobbs, P. V.: Introduction to atmospheric chemistry, 276 pp., Cam-bridge University Press, 2000.
Hoppel, W. A., Fitzgerald, W., Frick, G. M., and Larson, R. E.: Aerosol size distributions and optical properties found in the ma-rine boundary layer over the Atlantic Ocean, J. Geophys. Res., 95, 3659–3686, 1990.
Hudson, J. G.: An instantaneous CCN spectrometer, J. Atmos. Oceanic Technol., 6, 1055–1065, 1989.
Hudson, J. G.: Variability of the relationship between particle size and cloud-nucleating ability, Geophys. Res. Lett., 34, L08801, doi:10.1029/2006GL028850, 2007.
Hudson, J. G. and Da, X.: Volatility and size of cloud condensation nuclei, J. Geophys. Res., 101, 4435—4442, 1996.
Hudson, J. G. and Yum, S. S.: Maritime-continental drizzle con-trasts in small cumuli, J. Atmos. Sci., 58, 915–926, 2001. Hudon, J. G., Xie, Y., and Yum, S. S.: Vertical distributions of
supersaturations, Geophys. Res. Lett., 37, L21813, doi:10.1029/2010GL045197, 2010.
Huebert, B. J., Bates, T., Russell, P. B., Shi, G., Kim, Y. J., Kawa-mura, K., Carmichael, G., and Nakajima, T.: An overview of ACE-Asia: Strategies for quantifying the relationships between Asian aerosols and their climatic impacts, J. Geophys. Res., 108, 8633, doi:10.1029/2003JD003550, 2003.
IPCC: Climate Change 2007: The physical science basis. Contri-bution of Working Group I to the Fourth Assessment Report of the Intergovernmental Panel on Climate Change, edited by: Solomon, S., Qin, D., Manning, M., Chen, Z., Marquis, M., Av-eryt, K. B., Tignor, M., and Miller, H. L., Cambridge University Press, 2007.
Kammermann, L., Gysel, M., Weingartner, E., Herich, H., Cziczo, D. J., Holst, T., Svenningsson, B., Arneth, A., and Baltensperger, U.: Subarctic atmospheric aerosol composition: 3. Measured and modeled properties of cloud condensation nuclei, J. Geophys. Res., 115, D04202, doi:10.1029/2009JD012447, 2010.
Kaneyasu, N.: Long-term measurement of aerosols on a remote is-land in the Northwest Pacific Ocean, International Aerosol Con-ference 2010, Helsinki, Finland, International Aerosol Research Assembly, 2010.
Khain, A., Ovtchinnikov, M., Pinsky, M., Pokrovsky, A., and Krugliak, H.: Notes on the state-of-the-art numerical modeling of cloud microphysics, Atmos. Res., 55, 159–224, 2000. Kim, J. H., Yum, S. S., Lee, Y.-G., and Choi, B.-C.: Ship
measure-ments of submicron aerosol size distributions over the Yellow Sea and the East China Sea, Atmos. Res., 93, 700–714, 2009a. Kim, S. K., Kong, B. J., Park, J. S., Lee, S. D., Kim, J. S., and Lee,
S. J.: The characteristic of particle composition at Baengnyeong Island, Technical report of National Institute of Environmental Research, NO. 2009-45-1101, 2009b (in Korean with English abstract).
Kim, S.-W., Yoon, S.-C., Jefferson, A., Ogren, J. A., Dutton, E. G., Won, J.-G., Ghim, Y. S., Lee, B.-I., and Han J.-S.: Aerosol optical, chemical and physical properties at Gosan, Korea during Asian dust and pollution episodes in 2001, Atmos. Environ., 39, 39–50, 2005.
Knutson, E. O. and Whitby, K. T.: Aerosol classification by electric mobility: Apparatus, theory, and applications, J. Aerosol. Sci., 6, 443–451, 1975.
Kreidenweis, S. M., Koehler, K., DeMott, P. J., Prenni, A. J., Carrico, C., and Ervens, B.: Water activity and activation di-ameters from hygroscopicity data – Part I: Theory and appli-cation to inorganic salts, Atmos. Chem. Phys., 5, 1357–1370, doi:10.5194/acp-5-1357-2005, 2005.
Kumala, M., Vehkam¨aki, H. Pet¨aj¨a, T., Dal Maso, M., Lauri, A., Kerminen, V.-M., Birmili, W., and McMurry, P. H.: Formation and growth rates of ultrafine atmospheric particles: a review of observations, J. Aerosol Sci., 35, 143–176, 2004.
Kuwata, M. and Kondo, Y.: Dependence of size-resolved CCN spectra on the mixing state of nonvolatile cores observed in Tokyo, J. Geophys. Res., 113, D19202, doi:10.1029/2007JD009761, 2008.
Kuwata, M., Kondo, Y., Miyazaki, Y., Komazaki, Y., Kim, J. H., Yum, S. S., Tanimoto, H., and Matsueda, H.: Cloud conden-sation nuclei activity at Jeju Island, Korea in spring 2005, At-mos. Chem. Phys., 8, 2933–2948, doi:10.5194/acp-8-2933-2008, 2008.
Lance, S., Nenes, A., Mazzoleni, C., Dubey, M. K., Gates, H., Varutbangkul, V., Rissman, T. A., Murphy, S. M., Sorooshian, A., Flagan, R. C., Seinfeld, J. H., Feingold, G., and Jonsson, H. H.: Cloud condensation nuclei activity, closure, and droplet growth kinetics of Houston aerosol during the Gulf of Mex-ico Atmospheric Composition and Climate Study (GoMACCS), J. Geophys. Res., 114, D00F15, doi:10.1029/2008JD011699, 2009.
Lee, M., Song, M., Moon, K. J., Han, J. S., Lee, G., and Kim, K.-R.: Origins and chemical characteristics of fine aerosols during the northeastern Asia regional experiment (Atmospheric Brown Cloud–East Asia Regional Experiment 2005), J. Geophys. Res., 112, D22S29, doi:10.1029/2006JD008210, 2007.
Massling, A., Leinert, S., Wiedensohler, A., and Covert, D.: Hy-groscopic growth of sub-micrometer and one-micrometer aerosol particles measured during ACE-Asia, Atmos. Chem. Phys., 7, 3249–3259, doi:10.5194/acp-7-3249-2007, 2007.
Massling, A., Stock, M., Wehner, B., Wu, Z. J., Hu, M., Br¨uggemann, E., Gnauk, T., Herrmann, H., and Wiedensohler, A.: Size segregated water uptake of the urban submicrometer aerosol in Beijing, Atmos. Environ., 43, 1578–1589, 2009. Matsumoto, K., Tanaka, H., Nagao, I., and Ishizaka, Y.:
Contribu-tion of particulate sulfate and organic carbon to cloud conden-sation nuclei in the marine atmosphere, Geophys. Res. Lett., 24, 665–658, 1997.
Mochida, M., Nishita-Hara, C., Kitamori, Y., Aggarwal, S. G., Kawamura, K., Miura, K., and Takami, A.: Size-segregated measurements of cloud condensation nucleus activity and hygro-scopic growth for aerosols at Cape Hedo, Japan, in spring 2008, J. Geophys. Res., 115, D21207, doi:10.1029/2009JD013216, 2010.
Nakajima, T., Yoon, S.-C., Ramanathan, V., Shi, G.-Y., Takemura, T., Higurashi, A., Takamura, T., Aoiki, K., Sohn, B.-J., Kim, S.-W., Tsuruta, H., Sugimoto, N., Shimizu, A., Tanimoto, H., Sawa, Y., Lin, N.-H., Lee, C.-T., Goto, D., and Schutgens, N.: Overview of the Atmospheric Brown Cloud East Asian Re-gional Experiment 2005 and a study of the aerosol direct ra-diative forcing in east Asia, J. Geophys. Res., 112, D24S91, doi:10.1029/2007JD009009, 2007.
Petters, M. D. and Kreidenweis, S. M.: A single parameter repre-sentation of hygroscopic growth and cloud condensation nucleus activity, Atmos. Chem. Phys., 7, 1961–1971, doi:10.5194/acp-7-1961-2007, 2007.
Petters, M. D. and Kreidenweis, S. M.: A single parameter repre-sentation of hygroscopic growth and cloud condensation nucleus activity – Part 2: Including solubility, Atmos. Chem. Phys., 8, 6273–6279, doi:10.5194/acp-8-6273-2008, 2008.
Pringle, K. J., Tost, H., Pozzer, A., P¨oschl, U., and Lelieveld, J.: Global distribution of the effective aerosol hygroscopicity pa-rameter for CCN activation, Atmos. Chem. Phys., 10, 5241– 5255, doi:10.5194/acp-10-5241-2010, 2010.
Pruppacher, H. R. and Klett, J. D.: Microphysics of Clouds and Precipitation, 954 pp., Springer, New York, 1997.
Ramana, M. V., Ramanathan, V., Feng, Y., Yoon, S.-C., Kim, S.-W., Carmichael, G. R., and Schauer, J. J.: Warming in?uenced by the ratio of black carbon to sulphate and the black-carbon source, Nature Geosci., 3, 542–545, doi:10.1038/ngeo918, 2010. Roberts, G. C. and Nenes, A.: A continuous-flow streamwise
Aerosol Sci. Tech., 39, 206–221, 2005.
Rose, D., Gunthe, S. S., Mikhailov, E., Frank, G. P., Dusek, U., Andreae, M. O., and P¨oschl, U.: Calibration and measurement uncertainties of a continuous-flow cloud condensation nuclei counter (DMT-CCNC): CCN activation of ammonium sulfate and sodium chloride aerosol particles in theory and experiment, Atmos. Chem. Phys., 8, 1153–1179, doi:10.5194/acp-8-1153-2008, 2008.
Rose, D., Nowak, A., Achtert, P., Wiedensohler, A., Hu, M., Shao, M., Zhang, Y., Andreae, M. O., and P¨oschl, U.: Cloud conden-sation nuclei in polluted air and biomass burning smoke near the mega-city Guangzhou, China – Part 1: Size-resolved measure-ments and implications for the modeling of aerosol particle hy-groscopicity and CCN activity, Atmos. Chem. Phys., 10, 3365– 3383, doi:10.5194/acp-10-3365-2010, 2010.
Schwartz, S. E., Charlson, R. J., Khan, R. A., Ogren, J. A., and Rodhe, H.: Why Hasn’t Earth Warmed as Much as Expected?, J. Climate, 23, 2453–2464, 2010.
Stith, J. L., Ramanathan, V., Cooper, W. A., Roberts, G. C., DeMott, P. J., Carmichael, G., Hatch, C. D., Adhikary, B., Twohy, C. H., Rogers, D. C., Baumgardner, D., Prenni, A. J., Campos, T., Gao, R., Anderson, J., and Feng, Y.: An overview of aircraft obser-vations from the Pacific Dust Experiment campaign, J. Geophys. Res., 114, D05207, doi:10.1029/2008JD010924, 2009.
Su, H., Rose, D., Cheng, Y. F., Gunthe, S. S., Massling, A., Stock, M., Wiedensohler, A., Andreae, M. O., and P¨oschl, U.: Hy-groscopicity distribution concept for measurement data analysis and modeling of aerosol particle mixing state with regard to hy-groscopic growth and CCN activation, Atmos. Chem. Phys., 10, 7489–7503, doi:10.5194/acp-10-7489-2010, 2010.
Swietlicki, E., Zhou, J., Berg, O. H., Martinsson, B. G., Frank, G., Cederfelt, S.-I., Dusek, U., Berner, A., Birmili, W., Wieden-sohler, A., Yuskiewicz, B., and Bower, K. N.: A closure study of sub-micrometer aerosol particle hygroscopic behavior, Atmos. Res., 50, 205–240, 1999.
Swietlicki, E., Hansson, H.-C., H¨ameri, K., Svenningsson, B., Massling, A., McFiggans, G., McMurry, P. H., Pet¨aj¨a, T., Tunved, P., Gysel, M., Topping, D., Weingartner, E., Bal-tensperger, U., Rissler, J., Wiedensohler, A., and Kulmala, M.: Hygroscopic properties of submicrometer atmospheric aerosol particles measured with H-TDMA instruments in various envi-ronments – a review, Tellus, 60B, 432–469, 2008.
Vestin, A., Rissler, J., Swietlicki, E., Frank, G. P., and An-dreae, M. O.: Cloud-nucleating properties of the Amazo-nian biomass burning aerosol: Cloud condensation nuclei mea-surements and modeling, J. Geophys. Res., 112, D14201, doi:10.1029/2006JD008104, 2007.
Wang, J., Cubison, M. J., Aiken, A. C., Jimenez, J. L., and Collins, D. R.: The importance of aerosol mixing state and size-resolved composition on CCN concentration and the variation of the im-portance with atmospheric aging of aerosols, Atmos. Chem. Phys., 10, 7267–7283, doi:10.5194/acp-10-7267-2010, 2010. Wex, H., McFiggans, G., Henning, S., and Stratmann, F.: Influence
of the external mixing state of atmospheric aerosol on derived CCN number concentrations, Geophys. Res. Lett., 37, L10805, doi:10.1029/2010GL043337, 2010.
Wiedensohler, A., Cheng, Y. F., Nowak, A., Wehner, B., Achtert, P., Berghof, M., Birmili, W., Wu, Z. J., Hu, M., Zhu, T., Takegawa, N., Kita, K., Kondo, Y., Lou, S. R., Hofzumahaus, A., Holland, F., Wahner, A., Gunthe, S. S. Rose, D., Su, H., and P¨oschl, U.: Rapid aerosol particle growth and increase of cloud condensation nucleus activity by secondary aerosol for-mation and condensation: A case study for regional air pol-lution in northeastern China, J. Geophys. Res., 114, D00G08, doi:10.1029/2008JD010884, 2009.
Yum, S. S., Hudson, J. G., and Xie, Y.: Comparisons of cloud mi-crophysics with cloud condensation nuclei spectra over the sum-mertime Southern Ocean, J. Geophys. Res., 103, 16625–16636, 1998.
Yum, S. S. and Hudson, J. G.: Vertical distributions of cloud con-densation nuclei spectra over the springtime Arctic Ocean, J. Geophys. Res., 106, 15045–15052, 2001.
Yum, S. S. and Hudson, J. G.: Maritime/continental microphysical contrasts in stratus, Tellus, 54B, 61–73, 2002.
Yum, S. S., Hudson, J. G., Song, K. Y., and Choi, B.-C.: Springtime cloud condensation nuclei concentrations on the west coast of Korea, Geophys. Res. Lett., 32, L09814, doi:10.1029/2005GL022641, 2005.
Yum. S. S., Roberts, G., Kim, J. H., Song, K., and Kim, D.: Sub-micron aerosol size distributions and cloud condensation nu-clei concentrations measured at Gosan, Korea, during the Atmo-spheric Brown Clouds-East Asian Regional Experiment 2005, J. Geophys. Res., 112, D22S32, doi:10.1029/2006JD008212, 2007.