ACPD
15, 2745–2789, 2015The relationship between CCN concentration and dry light extinction
Y. Shinozuka et al.
Title Page
Abstract Introduction
Conclusions References
Tables Figures
◭ ◮
◭ ◮
Back Close
Full Screen / Esc
Printer-friendly Version
Interactive Discussion
Discussion
P
a
per
|
Discussion
P
a
per
|
Discussion
P
a
per
|
Discussion
P
a
per
Atmos. Chem. Phys. Discuss., 15, 2745–2789, 2015 www.atmos-chem-phys-discuss.net/15/2745/2015/ doi:10.5194/acpd-15-2745-2015
© Author(s) 2015. CC Attribution 3.0 License.
This discussion paper is/has been under review for the journal Atmospheric Chemistry and Physics (ACP). Please refer to the corresponding final paper in ACP if available.
The relationship between cloud
condensation nuclei (CCN) concentration
and light extinction of dried particles:
indications of underlying aerosol
processes and implications for
satellite-based CCN estimates
Y. Shinozuka1,2, A. D. Clarke3, A. Nenes4,5, A. Jefferson6,7, R. Wood8,
C. S. McNaughton3,9, J. Ström10, P. Tunved10, J. Redemann11, K. L. Thornhill12, R. H. Moore13, T. L. Lathem4,14, J. J. Lin4, and Y. J. Yoon15
1
NASA Ames Research Center Cooperative for Research in Earth Science and Technology, Moffett Field, California, USA
2
Bay Area Environmental Research Institute, Petaluma, California, USA
3
School of Ocean and Earth Science and Technology, University of Hawaii, Honolulu, Hawaii, USA
4
ACPD
15, 2745–2789, 2015The relationship between CCN concentration and dry light extinction
Y. Shinozuka et al.
Title Page
Abstract Introduction
Conclusions References
Tables Figures
◭ ◮
◭ ◮
Back Close
Full Screen / Esc
Printer-friendly Version
Interactive Discussion
Discussion
P
a
per
|
Discussion
P
a
per
|
Discussion
P
a
per
|
Discussion
P
a
per
|
5
School of Chemical and Biomolecular Engineering, Georgia Institute of Technology, Atlanta, Georgia, USA
6
Cooperative Institute for Research in Environmental Science (CIRES), University of Colorado, Boulder, Colorado, USA
7
NOAA Earth System Research Laboratory, Boulder, Colorado, USA
8
Department of Atmospheric Sciences, University of Washington, Seattle, Washington, USA
9
Golder Associates Ltd., Saskatoon, Saskatchewan, Canada
10
Department of Applied Environmental Science, Stockholm University, Sweden
11
NASA Ames Research Center, Moffett Field, California, USA
12
Science Systems and Applications Inc., Hampton, Virginia, USA
13
NASA Langley Research Center, Hampton, Virginia, USA
14
Phillips 66 Research Center, Bartlesville, Oklahoma, USA
15
Korea Polar Research Institute, Yeonsu-Gu, Incheon, Korea
Received: 12 December 2014 – Accepted: 14 January 2015 – Published: 29 January 2015 Correspondence to: Y. Shinozuka ([email protected])
ACPD
15, 2745–2789, 2015The relationship between CCN concentration and dry light extinction
Y. Shinozuka et al.
Title Page
Abstract Introduction
Conclusions References
Tables Figures
◭ ◮
◭ ◮
Back Close
Full Screen / Esc
Printer-friendly Version
Interactive Discussion
Discussion
P
a
per
|
Discussion
P
a
per
|
Discussion
P
a
per
|
Discussion
P
a
per
Abstract
We examine the relationship between the number concentration of boundary-layer cloud condensation nuclei (CCN) and light extinction to investigate underlying aerosol processes and satellite-based CCN estimates. Regression applied to a variety of air-borne and ground-based measurements identifies the CCN (cm−3) at 0.4
±0.1 %
su-5
persaturation with 100.3α+1.3σ0.75 where σ (M m−1) is the 500 nm extinction coeffi -cient by dried particles and α is the Angstrom exponent. The deviation of one kilo-meter horizontal average data from this approximation is typically within a factor of 2.0.∂log CCN/∂logσ is less than unity because, among other explanations, aerosol growth processes generally make particles scatter more light without increasing their
10
number. This, barring extensive data aggregation and special meteorology-aerosol connections, associates doubling of aerosol optical depth with less than doubling of CCN, contrary to common assumptions in satellite-based analysis of aerosol-cloud in-teractions.
1 Introduction
15
Aerosol-cloud interactions (ACI) are the largest source of uncertainty in estimates of radiative forcing responsible for the on-going climate change (Boucher et al., 2013). ACI for warm clouds depend on the number concentration of cloud condensation nu-clei (CCN), the particles capable of initiating drop formation at a given supersaturation (Pruppacher and Klett, 1980), not on aerosol optical properties. Yet, aerosol optical
20
depth (AOD) and its variants weighted by the spectral dependence over visible and near infrared (VNIR) wavelengths are commonly substituted for CCN in ACI studies. The substitution is motivated by the wide availability in space and time of satellite re-trievals, an advantage over the sparse CCN measurements. But underlying assump-tions on the relaassump-tionship between CCN and VNIR AOD remain to be examined with
25
ACPD
15, 2745–2789, 2015The relationship between CCN concentration and dry light extinction
Y. Shinozuka et al.
Title Page
Abstract Introduction
Conclusions References
Tables Figures
◭ ◮
◭ ◮
Back Close
Full Screen / Esc
Printer-friendly Version
Interactive Discussion
Discussion
P
a
per
|
Discussion
P
a
per
|
Discussion
P
a
per
|
Discussion
P
a
per
|
The CCN–AOD relationship is complicated partly because these quantities refer to different volumes of air. Whereas the CCN most relevant to ACI are located at the cloud base altitude, the AOD is defined for the entire vertical column. Aerosols at other altitudes contribute to it but not to the CCN. The air mass interacting with clouds may be kilometers away from, or hours after, clear-sky satellite measurements of AOD. It may
5
be in horizontal and temporal resolutions finer than them. These differences matter because aerosol spatio-temporal distribution is generally inhomogeneous.
Even the CCN–extinction relationship at a given location and time is complicated, as each of these quantities depends on particle size and hygroscopicity in its own convo-luted way. Most CCN are in the Aitken mode and the smaller sizes of the accumulation
10
mode, the exact lower limit depending on the hygroscopicity. That is because particles are typically most numerous in these size ranges (Seinfeld and Pandis, 2006) and be-cause the critical dry diameter for droplet activation at a supersaturation of 0.2–0.6 % is usually 50–120 nm (Pringle et al., 2010). The light extinction at midvisible wavelengths is normally dominated by the accumulation or coarse mode where both particle volume
15
and scattering efficiency are greater than for smaller sizes (Waggoner et al., 1981). Particles that are relatively small may grow into optically active sizes at high ambient relative humidities due to uptake of water. As a result, particles near 100 nm can add to the CCN number without significantly changing the light extinction, and the extinction can increase upon humidity rises without changing the CCN number. Other aerosol
20
intensive properties such as refractive index, mixing state, particle shape and surface tension can also influence the relationship.
The CCN–AOD relationship has been approximated by several parameterizations, each based on either highly averaged measurements or a satellite algorithm. Some of them are applied to satellite AOD products to study the aerosol effects on warm clouds.
25
ACPD
15, 2745–2789, 2015The relationship between CCN concentration and dry light extinction
Y. Shinozuka et al.
Title Page
Abstract Introduction
Conclusions References
Tables Figures
◭ ◮
◭ ◮
Back Close
Full Screen / Esc
Printer-friendly Version
Interactive Discussion
Discussion
P
a
per
|
Discussion
P
a
per
|
Discussion
P
a
per
|
Discussion
P
a
per
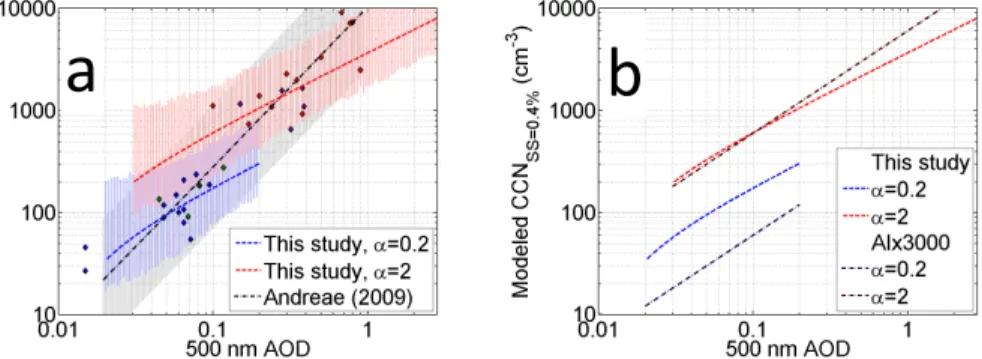
The simplest CCN retrieval strategies scale CCN concentrations with AOD at a sin-gle wavelength. They implicitly assume negligible variability in the combination of aerosol spatio-temporal distribution and intensive properties. Andreae (2009) finds from dozens of field experiments that, on an experiment average basis, AOD at 500 nm is correlated to CCN concentration at 0.4 % supersaturation as AOD500 nm=
5
0.0027 CCN0.6400.4 % with an R2 of 0.88. There is about a factor-of-four range of CCN concentrations at a given AOD. The exponent 0.640 on CCN means that doubling of AOD is associated with nearly tripling of CCN. In an even simpler approach, Kaufman et al. (2005) use MODIS AOD as a surrogate for the concentration of the aerosols that interact with the cloud layer, i.e., ∂log CCN/∂log AOD=1, to study the aerosol
10
effect on shallow liquid clouds. Koren et al. (2008) employ the same technique to study aerosol effects on clouds over the Amazon, and Bellouin et al. (2013) to estimate the shortwave direct and first indirect radiative forcing of anthropogenic aerosols. Quaas et al. (2008, 2009) evaluate variously modeled aerosol effects in terms of their relation-ship with AOD.
15
Another prevalent strategy is to multiply a single-wavelength AOD by the Angstrom exponent, i.e.,−1 times the slope of extinction spectrum in logarithmic scales.
Naka-jima et al. (2001) hypothesize that this product, now commonly called aerosol index (AI; not the TOMS/OMI aerosol index), is approximately proportional to the column aerosol number concentration. Bréon et al. (2002), Sekiguchi et al. (2003), Quaas et al. (2004)
20
and Penner et al. (2012) study the relationship of AI with satellite-derived or modeled cloud microphysical properties. Penner et al. (2011) refer to model-simulated AOD and AI to evaluate the aerosol effects on cloud droplet number concentration (CDNC), lead-ing to the conclusion that satellite methods underestimate the indirect climate forclead-ing by aerosols. The assumptions behind these uses of AI are that the impact of particle
25
ACPD
15, 2745–2789, 2015The relationship between CCN concentration and dry light extinction
Y. Shinozuka et al.
Title Page
Abstract Introduction
Conclusions References
Tables Figures
◭ ◮
◭ ◮
Back Close
Full Screen / Esc
Printer-friendly Version
Interactive Discussion
Discussion
P
a
per
|
Discussion
P
a
per
|
Discussion
P
a
per
|
Discussion
P
a
per
|
raised to the power of 0.869 based on the AVHRR retrieval algorithm. This statement has been widely ignored by subsequent studies.
Another strategy relies on satellite-retrieved aerosol size distribution. Gassó and Hegg (2003) compute CCN concentration by three different methods. One of them relies on the MODIS over-ocean algorithm. The algorithm matches spectral radiance
5
calculated from combinations of nine pre-set aerosol models to the spectral radiance observed over VNIR wavelengths by the space-borne sensor. This yields aerosol size distribution, among other products. The MODIS CCN product is the integral of the small-mode aerosol size distribution from a fixed radius of 30 nm (Appendix B of Remer et al. (2005), renamed PSML003_Ocean for MODIS Collection 6; Levy et al., 2013).
10
This strategy, similar to the AI, accounts for the impact of particle size and refractive in-dex only. The derived column-integral CCN concentration is proportional to the derived AOD. This product remains unvalidated and underutilized. Spectral fitting has been applied to ship-based columnar remote-sensing measurements as well (Sayer et al., 2012).
15
The study by Liu and Li (2014) is unique. Their analysis of five ground-based long-term measurements yields parameterizations that not only account for the size effect with Angstrom exponent. They also eliminate the impact of aerosol vertical distribution by referring to ground-level in situ optical measurements. The strategy should work with passive satellite observations of column AOD as input, as long as additional
mea-20
surements or a transport model estimate the aerosol vertical profile. The impact of hygroscopicity is not directly accounted for. The impact of horizontal-temporal distribu-tion is obscured by the bin-averaging applied to a large number of CCN data. Jefferson (2010) also parameterizes the CCN concentration with ground-based optical observa-tions; the use of backscattering fraction distinguishes her study from those mentioned
25
above and the present study.
ACPD
15, 2745–2789, 2015The relationship between CCN concentration and dry light extinction
Y. Shinozuka et al.
Title Page
Abstract Introduction
Conclusions References
Tables Figures
◭ ◮
◭ ◮
Back Close
Full Screen / Esc
Printer-friendly Version
Interactive Discussion
Discussion
P
a
per
|
Discussion
P
a
per
|
Discussion
P
a
per
|
Discussion
P
a
per
aerosol processes and satellite-based CCN estimates. This paper does not address pre-industrial era estimates and advanced remote sensing capabilities such as angles, polarization and, setting aside a mention of its vertical resolution, lidar (Feingold and Grund, 1994; Veselovskii et al., 2002; Ghan et al., 2006; Müller et al., 2014).
2 Methods
5
2.1 Experiments and instruments
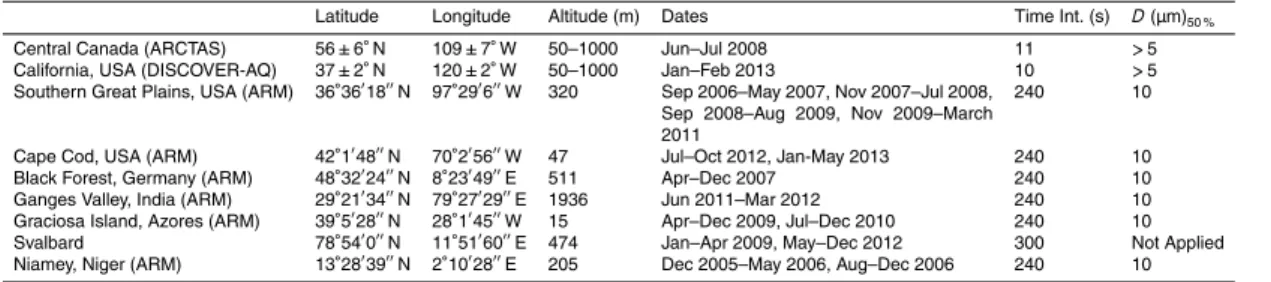
We use in situ aerosol measurements made aboard the NASA P-3 aircraft during the central Canada phase of ARCTAS and the California phase of DISCOVER-AQ from altitudes up to one km, and ground-based long-term observations at several sites run by the US Department of Energy ARM program and Svalbard (Table 1). In addition, we
10
use the AOD observed from the P-3 during ARCTAS Canada.
A solid diffuser inlet delivered ambient air to all the airborne in situ aerosol instru-ments. This inlet and sample plumbing pass aerosol with dry aerodynamic diameter at least up to 5.0 µm with better than 50 % efficiency (McNaughton et al., 2007). The partial loss of coarse particles leads to an underestimate of light extinction, but its
15
magnitude should be typically smaller than 15–25 %, an estimate for the NCAR Com-munity Aerosol Inlet (Shinozuka et al., 2004) that passes fewer particles than do solid diffuser inlets (Huebert et al., 2004). As possible rare exceptions, the impact of loss may be greater for dust particles. The submicron particles that almost always domi-nate CCN are sampled isokinetically with a near 100 % efficiency. The timing of the
20
airborne records used in this study is adjusted by 7–10 s, depending on the instrument and experiment, to account for the transport between the inlet tip and the instrument. The CCN and extinction coefficient generally see sudden changes at identical time stamps after this adjustment. At the ground sites other than Svalbard, the nephelome-ter and PSAP instruments (see below) were downstream of a set of switched 1.0 and
ACPD
15, 2745–2789, 2015The relationship between CCN concentration and dry light extinction
Y. Shinozuka et al.
Title Page
Abstract Introduction
Conclusions References
Tables Figures
◭ ◮
◭ ◮
Back Close
Full Screen / Esc
Printer-friendly Version
Interactive Discussion
Discussion
P
a
per
|
Discussion
P
a
per
|
Discussion
P
a
per
|
Discussion
P
a
per
|
10 µm impactors. This study uses the measurements behind the 10 µm impactor only. There is no aerosol size cut-offfor the Svalbard data.
The light scattering and absorption of dried (RH∼20 %) particles were measured
with TSI model 3563 nephelometers and Radiance Research particle soot absorption photometers (PSAP) at all locations. The sum of the scattering and absorption
coef-5
ficient gives the extinction coefficient for dried particles. It is adjusted from two of the instrument wavelengths, 450 and 550 nm of the nephelometers and 470 and 530 nm of the PSAPs, to 500 nm assuming the linear relationship between the logarithm of extinc-tion and the logarithm of wavelength. The excepextinc-tion is the Svalbard single-wavelength (525 nm) PSAP, for which an absorption Angstrom exponent of unity is assumed. The
10
extinction coefficient at 450 and 550 nm is also calculated, to derive the Angstrom ex-ponent,α, again assuming the linear relationship on the logarithmic scales.
We estimate 5–10 % as the uncertainty in the 500 nm dry extinction coefficient,
σ. The uncertainty is smaller for finer particles (larger Angstrom exponent) due to smaller uncertainty in the nephelometer’s angular truncation error (Anderson and
15
Ogren, 1998). The uncertainty is set to 5 % at minimum, because up to 7 % diff er-ences have been reported between nephelometers (Heintzenberg et al., 2006). The ARM ground-based observations of extinction above 500 M m−1are screened out. We expect that this ceiling is seldom exceeded, with a possible exception of the dusty Niamey site in Niger.
20
CCN concentrations were measured using a Droplet Measurement Technologies streamwise thermal-gradient CCN counter (CCNC) (Roberts and Nenes, 2005; Lance et al., 2006; Lathem et al., 2013) at all locations. The CCNC consists of a cylindrical flow tube with wetted walls, on which a linear streamwise temperature gradient is ap-plied. Owing to the greater diffusivity of water vapor than heat in air, a supersaturation
25
ACPD
15, 2745–2789, 2015The relationship between CCN concentration and dry light extinction
Y. Shinozuka et al.
Title Page
Abstract Introduction
Conclusions References
Tables Figures
◭ ◮
◭ ◮
Back Close
Full Screen / Esc
Printer-friendly Version
Interactive Discussion
Discussion
P
a
per
|
Discussion
P
a
per
|
Discussion
P
a
per
|
Discussion
P
a
per
by an optical particle counter at the exit of the column. We estimate the uncertainty to be 10 % of the best estimate plus 5 cm−3. We exclude the CCN measurements at Southern Great Plains between 20 May and 28 October 2007 when the instrument temperature was not properly controlled.
This study also uses the aerosol size distributions measured with a scanning mobility
5
particle sizer (SMPS) with a long differential mobility analyzer (TSI 3081 with custom electronics) in ARCTAS (McNaughton et al., 2011). The SMPS measured particles between 10 and 500 nm over a 60 s period every 85 s, for air volumes collected over 20 s into a grab sampler. The grab chamber ensured that every point of each SMPS scan measures the particles from the same volume of air.
10
The CCN concentration observed during ARCTAS at the corrected instrument super-saturation between 0.3 and 0.5 % was adjusted to 0.4 % using the aerosol size distri-bution measured with the SMPS. We first integrate the size distridistri-bution from the largest size bin until the concentration matches the measured CCN concentration (Moore et al., 2011; Lathem et al., 2013). The critical dry diameter determined this way is
15
then adjusted from instrument supersaturation to 0.4 % based on the Kohler theory to compute the CCN concentration at the reference supersaturation. The adjusted CCN concentration is typically within 5 % of the measured concentration. We did not make the adjustment for the data from other experiments.
The measured aerosol size distribution provides adequate counting accuracy and
20
temporal resolution for our CCN–AOD study. Matching or scaling with coincident CPC measurements would exclude time periods when the aerosol number exceeded the CPC’s upper detection limit, and otherwise has little influence on the adjustment of CCN concentration to a single supersaturation. The 1 Hz CPC counts indicate that plumes that lasted less than SMPS sample time or took place between the SMPS
25
ACPD
15, 2745–2789, 2015The relationship between CCN concentration and dry light extinction
Y. Shinozuka et al.
Title Page
Abstract Introduction
Conclusions References
Tables Figures
◭ ◮
◭ ◮
Back Close
Full Screen / Esc
Printer-friendly Version
Interactive Discussion
Discussion
P
a
per
|
Discussion
P
a
per
|
Discussion
P
a
per
|
Discussion
P
a
per
|
Many recent studies have shown that the influence of aerosol composition on CCN activity can be efficiently represented by a single hygroscopicity parameter, κ, which simply expresses the affinity of a given aerosol particle for water (Petters and Krei-denweis, 2007).κ is near 0.1 for many organic species (Jimenez et al., 2009; Lathem et al., 2013) and 0.67 for ammonium sulfate (Petters and Kreidenweis, 2007). Derived
5
κis 0.03–0.16 for two thirds of the central Canada data, with a median of 0.08. This is plausible for the high organic content expected in the fresh biomass burning particles that we observed in central Canada. The arithmetic mean is 0.18, similar to the ob-servations of biomass burning particles from the DC-8 aircraft in the same experiment (Lathem et al., 2013). The arithmetic mean is greater than the median and sensitive
10
to a few data points with large values, as the histogram of the calculated κ values resembles a lognormal distribution rather than a normal one.
In ARCTAS, the 14-channel Ames Airborne Tracking Sunphotometer (AATS-14) measured direct solar beam transmission in narrow wavelength channels by using detectors in a tracking head mounted externally to the aircraft. It recorded 3 s
aver-15
age data every 4 s. The AATS-14 provides above-aircraft AOD with a small and well-characterized error (∼0.01) at 13 wavelengths between 354 and 2139 nm. Shinozuka
et al. (2011) describe data acquisition, screening, calibration, reduction and uncertainty analysis, as well as the vertical profiles, inter-comparison and fine-mode fraction of the AOD observed in ARCTAS. To compute the full-column AOD, below-aircraft
contribu-20
tions were estimated with coincident in situ observations under the assumption that the extinction coefficient for the ambient particles was constant below the aircraft (at one kilometer or below). Specifically, the scattering coefficient was adjusted to the ambient humidity at the aircraft altitude, based on thef(RH) humidity response measured with a pair of nephelometers at∼20 % and∼80 % RH, before being added to the
absorp-25
ACPD
15, 2745–2789, 2015The relationship between CCN concentration and dry light extinction
Y. Shinozuka et al.
Title Page
Abstract Introduction
Conclusions References
Tables Figures
◭ ◮
◭ ◮
Back Close
Full Screen / Esc
Printer-friendly Version
Interactive Discussion
Discussion
P
a
per
|
Discussion
P
a
per
|
Discussion
P
a
per
|
Discussion
P
a
per
above-aircraft AOD assuming these two components are independent of each other (calculated as the root of the sum of the squares), resulting in the uncertainty in the full-column AOD of 0.01–0.02 for most cases.
2.2 Resolution and regression
McComiskey and Feingold (2012) say, “The ensuing effects of aggregation by
aver-5
aging and loss of variance on common calculations of statistics (. . . ) are rarely dis-cussed when inference is made from analyses of ACI at varying scales in the literature.” Cantrell (2008) says, “While the literature is full of detailed analyses of procedures for fitting straight lines to values with uncertainties, a surprising number of scientists blindly use the standard least-squares method (. . . ) that assumes no uncertainties in
10
the x values.” Applying the appropriate regression method at the relevant resolution is important for the studies of CCN–extinction relationship where the analysis centers around regression. In this regard our study departs from previous ones in two ways.
First, this study minimizes data aggregation. Averaging data prior to regression gen-erally improves correlation, but the results do not represent the variance of original data
15
points. We do not average data over an entire experiment or CCN bins, because cloud microphysics occurs in scales much finer than hundreds of kilometers or weeks. We aggregate CCN and extinction data over 10–11 s for the airborne data, 240–300 s for the ground-based data. These time periods roughly correspond to one kilometer hori-zontal distance for the typical P-3 ground speed near the surface (∼120 m s−1) and for
20
the ground-based observations under the∼4 m s−1winds. The aggregation is achieved
by means of averaging, except for the data from the airborne nephelometers in which sample air resides for time periods comparable to 10 s; we let a single scattering coef-ficient recorded in the middle of each time period represent it. The ARCTAS data are averaged over 11 s instead of 10 s with every 12th second discarded, to encompass
25
ACPD
15, 2745–2789, 2015The relationship between CCN concentration and dry light extinction
Y. Shinozuka et al.
Title Page
Abstract Introduction
Conclusions References
Tables Figures
◭ ◮
◭ ◮
Back Close
Full Screen / Esc
Printer-friendly Version
Interactive Discussion
Discussion
P
a
per
|
Discussion
P
a
per
|
Discussion
P
a
per
|
Discussion
P
a
per
|
step is often influenced by the supersaturation instability and is removed. The rest are averaged over 240 s. The Svalbard data are averaged over 300 s.
Second, this study employs a bivariate regression method, with one over the esti-mated measurement uncertainty squared as weights for both x and y. When bothx
andy have uncertainties, the simple least-squares method underestimates the
magni-5
tude of the slope (see, for example, Cantrell, 2008). That leads to an underestimate of
∂log CCN/∂log AOD whenxis log AOD andy is log CCN; an overestimate when, as in Andreae (2009) and Liu and Li (2014),xis log CCN andy is log AOD. Bivariate regres-sion avoids this bias, as it gives the same slope regardless of the choice of variable forx and y by iteratively minimizing the sum of the squares of the diagonal distances
10
(York et al., 2004). This feature forces the linear-correlation coefficient, R, to be near unity; we evaluate the goodness of the fit by two other measures. One is the variance of the slope estimated after Reed (1992) with the number of independent measurements determined with an autocorrelation analysis after Bretherton et al. (1999). The other is the root-mean-square (RMS) of the deviation of individual data points.
15
3 Results
3.1 The relationship of CCN to AOD and in situ dry extinction coefficient
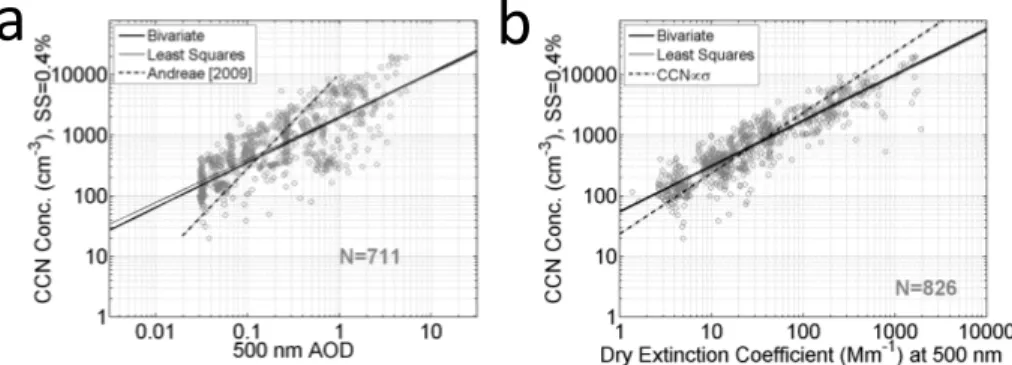
Figure 1a compares the CCN concentration and AOD observed over central Canada during ARCTAS below one kilometer altitude. Each grey circle represents the aver-age over 11 s in which our aircraft traveled a little over one km horizontal distance
20
(see Sect. 2.2). The CCN concentration is adjusted to 0.4 % supersaturation using the SMPS aerosol size distribution (Sect. 2.1). The 500 nm AOD presented here is mea-sured with the upward-viewing AATS-14 and augmented for the below-aircraft contri-butions using coincident in situ aerosol extinction measurements. The resulting full-column AOD values are consistent with the AERONET ground-based observations
25
ACPD
15, 2745–2789, 2015The relationship between CCN concentration and dry light extinction
Y. Shinozuka et al.
Title Page
Abstract Introduction
Conclusions References
Tables Figures
◭ ◮
◭ ◮
Back Close
Full Screen / Esc
Printer-friendly Version
Interactive Discussion
Discussion
P
a
per
|
Discussion
P
a
per
|
Discussion
P
a
per
|
Discussion
P
a
per
The bivariate regression applied to log10CCNSS=0.4 % and log10AOD500 nm yields a slope of 0.74±0.11, expressed as the best estimate±the square root of the variance
(one sigma). The RMS of the difference between the individual data points and fit is 0.35 on the log10basis, which means that the fit estimates CCN concentrations within a factor of 2.3 (100.35, numbers do not match due to rounding) of the observed value
5
for about two thirds of the cases. A similar result is obtained from the standard least squares regression (thin solid line): a slope of 0.71±0.19 and the deviation within
a factor of 2.2. For the standard least squares fit, the coefficient of determination (R2) is 0.59. The similarity between the two regression results is expected for the relatively small measurement errors (see Sects. 2.1 and 2.2). The results appear insensitive to
10
the choice of wavelength of the AOD: bivariate regression against the observed above-aircraft AOD spectra indicates that the RMS fitting error varies only by±0.01 between 350 and 800 nm with little variation in the slope.
The deviations from the fit arise mainly from aerosol vertical profile and intensive properties. Of the other factors mentioned in Sect. 1, measurement errors are much
15
smaller than a factor of 2.3. So is the impact of water uptake on AOD, owing to the low (mostly<50 %) ambient RH and the low particle hygroscopicity. Aerosol horizontal-temporal variability is not an issue with the airborne observations where all instruments operated from a single platform at high temporal resolutions. If we minimize the impact of the vertical profile, we can focus on studying the impact of the intensive properties.
20
We remove the impact of the vertical profile by replacing the column integral AOD with the local extinction coefficient, in a manner similar to Shinozuka (2008) and Liu and Li (2014). Because the extinction coefficient is measured for dried particles, the impact of the humidity growth on light extinction is also removed. The slope remains similar, 0.75±0.05 (Fig. 1b). The deviation is reduced from a factor of 2.3 to a factor of
25
ACPD
15, 2745–2789, 2015The relationship between CCN concentration and dry light extinction
Y. Shinozuka et al.
Title Page
Abstract Introduction
Conclusions References
Tables Figures
◭ ◮
◭ ◮
Back Close
Full Screen / Esc
Printer-friendly Version
Interactive Discussion
Discussion
P
a
per
|
Discussion
P
a
per
|
Discussion
P
a
per
|
Discussion
P
a
per
|
The wide dynamic range of the ARCTAS data is advantageous for the regression analysis. If, for example, we remove the data above 30 M m−1, both the square root of the variance of the estimated slope and the RMS fitting error amplify, from 0.05 and 1.7 to 0.17 and 2.0, respectively. x and y values that span narrow ranges should be avoided for the regression analysis.
5
The impact of the vertical profile is difficult to parameterize; so is that of the humidity response of extinction. Our strategy is to set these issues aside and tighten the rela-tionship between CCN concentration and extinction coefficient for dried particles. The following subsection shows this relationship sorted by Angstrom exponent for ARCTAS and other experiments.
10
3.2 The CCN–extinction relationship for dried particles and its connection with
Angstrom exponent
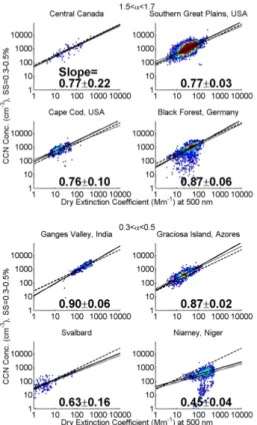
The slope and deviation are similar for other locations that cover a broad range of aerosol and meteorological environments. Figure 2 shows the subset of data from cen-tral Canada, Southern Great Plains, Cape Cod and Black Forest with an extinction
15
Angstrom exponent between 1.5 and 1.7, and that from Ganges Valley, Graciosa Is-land, Svalbard and Niamey with an Angstrom exponent between 0.3 and 0.5. Data from the ground sites are averaged over 240–300 s, which corresponds to about one kilo-meter horizontal distance under typical wind speeds (Sect. 2.2). The slope is smaller than unity for all cases.
20
All CCN data shown here are measurements at 0.3–0.5 % supersaturation. This range is wide enough to allow sufficient data for regression analysis. But it results in an isolated group of data points for a handful of cases, such as∼10 % of the Black
Forest data. This effect is evident despite the fact that data points up to one minute after each change in pre-set supersaturation are excluded. This is because the
in-25
ACPD
15, 2745–2789, 2015The relationship between CCN concentration and dry light extinction
Y. Shinozuka et al.
Title Page
Abstract Introduction
Conclusions References
Tables Figures
◭ ◮
◭ ◮
Back Close
Full Screen / Esc
Printer-friendly Version
Interactive Discussion
Discussion
P
a
per
|
Discussion
P
a
per
|
Discussion
P
a
per
|
Discussion
P
a
per
of this change varies with supersaturation and location. It is relatively high near 0.4 % for Black Forest where the aerosol was highly variable with pollution from Stuttgart, organics from agriculture and nearby forest and heavy nitrate fertilization. Some of the isolated data points may be attributable to irregular instrument performance.
No adjustment to a single supersaturation value is made, except for the central
5
Canada data. Adjustment is discouraged by the lack of supporting observations (e.g., size distribution) in a statistically significant volume. We refrain from scaling the CCN– extinction relationship with the supersaturation, because the observed relationship varies widely even over narrower ranges of supersaturation.
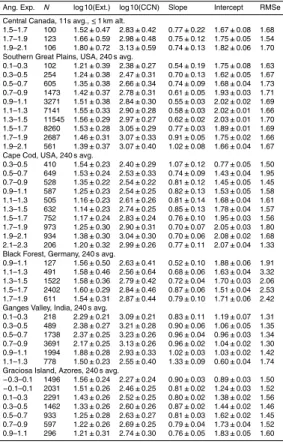
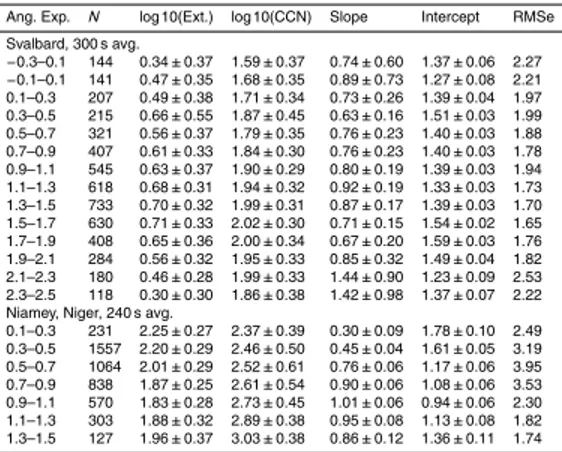
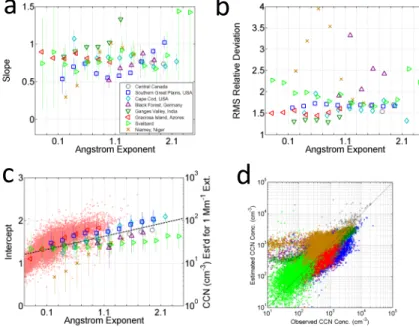
We applied the bivariate regression for other subsets of data. Figure 3a and Table 2
10
show regression results for the 0.2-wide Angstrom exponent bins where at least 100 data points exist with at least a factor of 1.5 variability, measured by the geometric SD, in both the CCN and extinction. For 85 % of the bins, the best estimate of slope is between 0.5 and 1.0. The square root of the variance in the estimated slope is typi-cally 0.03–0.2. The results are somewhat sensitive to the assumption on measurement
15
uncertainty. The uncertainties assumed here, as detailed in Sect. 2.1, are 10 % of the best estimate plus 5 cm−3 for the CCN, 0.01–0.02 for most of the AOD, 5–10 % for the extinction. Taken together, these considerations make us estimate that the expression 0.75±0.25 encompasses the one SD range of the true values of the slope. The fitting
error is between a factor of 1.5 and 2.0 for most cases (Fig. 3b and Table 2). The
ex-20
ceptions are the data from Niamey, presumably due to the frequent presence of coarse dust particles that significantly contribute to extinction but are scarcely related to CCN number. Figure S1 in the supplementary materials shows that regression results are similar with 450 nm extinction instead of 500 nm. It also demonstrates that the standard least squares method yields similar results whereas bisector and binned standard least
25
squares methods lead to significantly poorer fits.
ACPD
15, 2745–2789, 2015The relationship between CCN concentration and dry light extinction
Y. Shinozuka et al.
Title Page
Abstract Introduction
Conclusions References
Tables Figures
◭ ◮
◭ ◮
Back Close
Full Screen / Esc
Printer-friendly Version
Interactive Discussion
Discussion
P
a
per
|
Discussion
P
a
per
|
Discussion
P
a
per
|
Discussion
P
a
per
|
of 0.75, instead of using the bivariate regression results. Small dots in Fig. 3c show the intercept for Graciosa Island as an example. The arithmetic mean of the intercept is indicated with bigger markers, for this location and others. The intercept increases with increasing Angstrom exponent. This is qualitatively consistent with the fact that finer particles are generally more numerous for a given extinction. This effect is weaker for
5
the data from pristine Svalbard (light green markers in Fig. 3c), for unknown reasons. Since the linear fit is made on the log10–log10 coordinates, 10intercept is an estimate of the geometric mean of the CCN concentrations at 1 M m−1dry extinction coe
fficient. The mean intercept can be approximated as 0.3α+1.3 (dashed line in Fig. 3c). Data from Niamey, Niger are excluded from this approximation for the presumed influence
10
of dust, which is less prevalent than marine aerosols over the globe under warm and mixed-phase clouds. The approximation deviates widely from the Svalbard data over high Angstrom exponent values as well. This approximation completes the expression:
CCNSS∼0.4 %(cm
−3)
=100.3α+1.3σ0.75 (1)
where σ (M m−1) is the 500 nm extinction coefficient for dried particles and α, its
15
Angstrom exponent. The estimated CCN concentration is within a factor of 2.0 of the in-dividual measurements, excluding Niamey (Fig. 3d). The deviations tend to be greater, a factor of 10 for some, for observed CCN concentrations below 100 cm−3. The devia-tion would be a factor of 2.7 without the use of Angstrom exponent.
The same analysis for other supersaturations (Figs. S2–S5 in the Supplement)
20
yields:
CCNSS∼0.2 %(cm
−3)
=100.3α+1.0σ0.75 (2)
CCNSS∼0.6 %(cm
−3)
=100.3α+1.4σ0.75 (3)
The exponent tends to slightly decrease with increasing supersaturation, as expected for the decreasing overlap between the optically important particles and CCN. But,
be-25
ACPD
15, 2745–2789, 2015The relationship between CCN concentration and dry light extinction
Y. Shinozuka et al.
Title Page
Abstract Introduction
Conclusions References
Tables Figures
◭ ◮
◭ ◮
Back Close
Full Screen / Esc
Printer-friendly Version
Interactive Discussion
Discussion
P
a
per
|
Discussion
P
a
per
|
Discussion
P
a
per
|
Discussion
P
a
per
we have retained a slope of 0.75 for the parameterizations above. Note also that the parameterization for∼0.2 % supersaturation is associated with a greater variability and
fitting error (a factor of 3.0; Fig. S3d) than for∼0.4 % supersaturation. This is because a greater fraction of the observed CCN concentration is below 100 cm−3and because variability among the locations is pronounced at this supersaturation.
5
4 Discussion
Based on the observed CCN–extinction relationship, we discuss underlying aerosol processes and satellite-based CCN estimates.
4.1 Indications of underlying aerosol processes
CCN concentration and dry extinction coefficient are each influenced by a host of
10
aerosol processes, of production, transformation, mixing and removal, in air and clouds. The log CCN-vs-logσ relationship embodies the combined effect of the processes. Some drive the slope to less than unity. Some are responsible for the factor of 1.5– 2.0 variability. Here we discuss such processes, especially those common for various locations and Angstrom exponent values. We present observed aerosol properties as
15
circumstantial evidence, noting that direct analysis of aerosol processes with model simulations should be undertaken.
Recall that extinction is partly dependent on size and refractive index, not entirely on number. Two distributions that are similar in the Aitken mode may have a factor of ten difference in extinction, if they differ roughly tenfold in the accumulation mode. Spheres
20
up to 200 nm are more efficient at scattering with higher black carbon content (Fig. 15.7 of Seinfeld and Pandis, 2006).
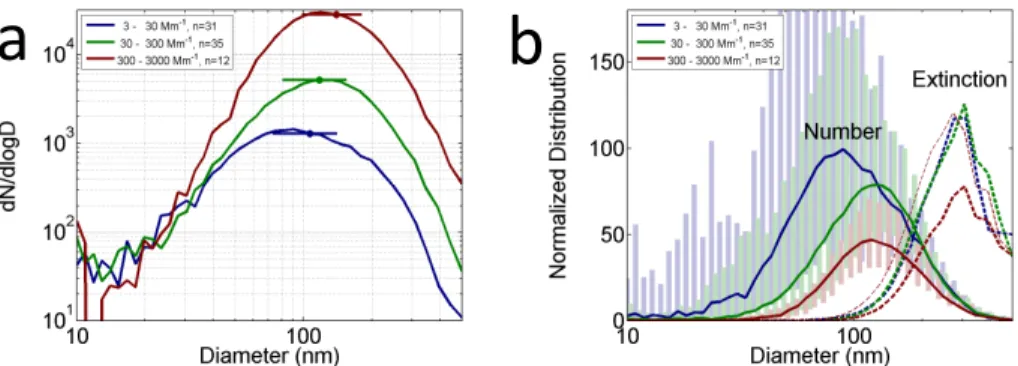
These phenomena are evident in the aerosol number size distribution observed in ARCTAS Canada. Figure 4a shows the distribution that is grouped by the concurrent 500 nm dry extinction coefficient and Angstrom exponent and averaged on the
ACPD
15, 2745–2789, 2015The relationship between CCN concentration and dry light extinction
Y. Shinozuka et al.
Title Page
Abstract Introduction
Conclusions References
Tables Figures
◭ ◮
◭ ◮
Back Close
Full Screen / Esc
Printer-friendly Version
Interactive Discussion
Discussion
P
a
per
|
Discussion
P
a
per
|
Discussion
P
a
per
|
Discussion
P
a
per
|
mic scale. The accumulation mode varies with the extinction; the Aitken mode varies less.
To show the same data in a slightly different way, Fig. 4b has the observed size distri-butions that are grouped, divided by the extinction and averaged (solid curves). Greater extinction is associated with proportionally fewer particles in the typical CCN sizes, one
5
explanation for∂log CCN/∂logσ <1. Two things might seem counter-intuitive. One is the de-emphasis of the Aitken mode with extinction up to 300 M m−1, given that the Angstrom exponent, which is commonly regarded as a size indicator, is restricted to 1.7–1.9 for this demonstration. The other is the lower peak height in the accumulation mode for extinction values beyond 300 M m−1, given that the distributions are
normal-10
ized by the extinction. Simple Mie calculations applied to these distributions (dashed curves in Fig. 4b) clarify that they are not odd. First, the particles up to∼100 nm have
little influence on extinction. Variations in the Aitken mode have little influence on the Angstrom exponent in the detailed level, although the exponent does signal the CCN– extinction relationship to the extent shown in Fig. 3c and reduces the typical deviation
15
from a factor of 2.7 to 2.0. Second, the extinction distribution calculated for two re-fractive index values, 1.5–0.01i and 1.6–0.1i, demonstrates that a change in chemical composition can result in the same extinction with fewer accumulation-mode particles. The de-emphasis of the Aitken mode may reflect aerosol growth processes. Coagu-lation, for example, decreases the number and increases the size. Condensation and
20
in-cloud processing also make particles scatter more light while hardly increasing their number. Such ubiquitous processes may well be the primary reason for the similarity in the observed slope among the locations and Angstrom exponent bins.
The implied differences in refractive index, on the other hand, may reflect emissions and transformation unique to biomass burning particles. In ARCTAS, extinction
val-25
ues exceeding 300 M m−1 were observed directly above flaming fires, with the single scattering albedo (SSA) of 0.94±0.03. Values between 30–300 M m−1were observed
around both flaming and smoldering fires, with an SSA of 0.97±0.02. The SSA diff
ACPD
15, 2745–2789, 2015The relationship between CCN concentration and dry light extinction
Y. Shinozuka et al.
Title Page
Abstract Introduction
Conclusions References
Tables Figures
◭ ◮
◭ ◮
Back Close
Full Screen / Esc
Printer-friendly Version
Interactive Discussion
Discussion
P
a
per
|
Discussion
P
a
per
|
Discussion
P
a
per
|
Discussion
P
a
per
on soot-containing particles among others, in addition to the diversity in combustion mechanisms.
Combustion mechanisms and post-emission physicochemical processes may be doubly effective in lowering the slope from unity, acting not only on refractive index but also on hygroscopicity. The critical dry diameter (see Sect. 2.1) tends to be greater,
5
hence the CCN proportionally fewer, for greater extinction observed in the biomass burning particles (Fig. 4a). The implied negative correlation between particle hygro-scopicity and extinction might be attributable to the processes.
Besides the production and transformation, mixing and removal can conceivably in-fluence the slope, although we do not have observational evidence. Dilution with clean
10
air, for example, should work to bring the slope to unity, since optically effective parti-cles and CCN are reduced by the same rate. So should the types of rain wash-out that scavenge particles regardless of their size and hygroscopicity. Such processes might explain slopes higher than 0.75 in some locations (Fig. 3a, Table 2), though this might be caused by a few data points separate from the rest. Mixing, be it internal or external,
15
of dust particles with hygroscopic particles can influence the slope, as indicated by the Niamey data (Figs. 2 and 3, Table 2). Generally, fine-tuning of our parameterization for local meteorology and aerosol conditions should improve its accuracy.
Figure 4 helps explain not only the slope but also the variability in the CCN–extinction relationship. The shades in Fig. 4b indicate the one geometric SD range of the
normal-20
ized size distributions, each of which corresponds to unit extinction and an Angstrom exponent near 1.8. As such, the shades, which encompass roughly±70 % of the
geo-metric mean at most CCN sizes, represent the number of particles that can be added or removed without significantly influencing the extinction and its wavelength depen-dence. The variation in calculated critical diameter (horizontal bar in Fig. 4a), by roughly
25
ACPD
15, 2745–2789, 2015The relationship between CCN concentration and dry light extinction
Y. Shinozuka et al.
Title Page
Abstract Introduction
Conclusions References
Tables Figures
◭ ◮
◭ ◮
Back Close
Full Screen / Esc
Printer-friendly Version
Interactive Discussion
Discussion
P
a
per
|
Discussion
P
a
per
|
Discussion
P
a
per
|
Discussion
P
a
per
|
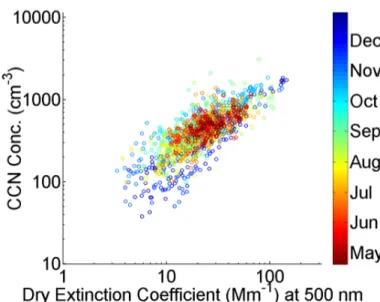
Multiple emissions followed by mixing can diversify the CCN–extinction relationship. The extinction coefficient at Graciosa Island with the Angstrom exponent between 0.3 and 0.5 should be dominated by coarse marine aerosols, setting aside occasional influ-ences of dust. Fine pollution particles of continental origin may also be included in the extinction, but only to a degree that keeps the Angstrom exponent low. The CCN
num-5
ber, on the other hand, can be dominated by either pollution or marine aerosols. Specif-ically, continental outflow influences the site in the summer, whereas high wind speed increases marine aerosols in the winter (Clarke et al., 1997; Logan et al., 2014; Wood et al., 2014). The seasonal cycle thus contributes to the variability in CCN–extinction relationship (Fig. 5). The average CCN concentration coincident with the extinction of
10
20±2 M m−1, for example, is 426 cm−3in June, 245 cm−3in December. Mixing in
vari-ous time scales may also explain the high variability in the data from Black Forest and Cape Cod (Fig. 2), sites sampling air masses with a number of different geographic origins. In fact, the location where data are collected appears to have a large impact on the variability (Fig. 3b), in comparison with the Angstrom exponent which shows no
15
obvious tendency with the RMS deviation. The deviation is not necessarily higher for smaller Angstrom exponent, as might be expected for the smaller overlap in the size between optically important particles and CCN.
Any process that influences the particle hygroscopicity can contribute significantly to the variability around the dry CCN–extinction relationship. In general, knowledge
20
of typical local aerosol size distribution and chemical composition helps constrain the impact of variation in hygroscopicity on the CCN concentration (Moore et al., 2012). While local observations and transport models can help, these properties, especially the composition, are difficult to observe from satellite. Despite the negative correlation between the hygroscopicity and extinction, the CCN–extinction relationship in central
25
ACPD
15, 2745–2789, 2015The relationship between CCN concentration and dry light extinction
Y. Shinozuka et al.
Title Page
Abstract Introduction
Conclusions References
Tables Figures
◭ ◮
◭ ◮
Back Close
Full Screen / Esc
Printer-friendly Version
Interactive Discussion
Discussion
P
a
per
|
Discussion
P
a
per
|
Discussion
P
a
per
|
Discussion
P
a
per
In another location the chemical composition is related to optical properties in a dis-cernible manner. Shinozuka et al. (2009) find that the wavelength dependence of ex-tinction was anti-correlated with the organic fraction of refractory mass of submicron particles (OMF) as α=−0.70· OMF +2.0 for Central Mexico’s urban and industrial pollution. Shinozuka et al. (2009) and Russell et al. (2010) also show that absorption
5
Angstrom exponent increased with the OMF, more rapidly for higher SSA, as expected for the interplay between soot, some organic species and dust. Such observations may assist remote sensing of aerosol chemical composition and CCN concentration in specific regions, making regional aerosol characterization an important element of improved satellite retrieval of CCN.
10
The discussion above, built on observed aerosol properties, remains to be verified with direct analysis of aerosol processes. That probably requires model simulations. The slope between simulated CCN concentrations and dry extinction coefficient for a given location and Angstrom exponent should be 0.75±0.25 to compare well with
observations. Simulations without certain aerosol processes, coagulation and
conden-15
sation for example, can reveal their impact on the CCN–extinction relationship and permit fine-tuning of their model representation.
Besides, co-variance of two aerosol properties should complement each of them as a model constraint. That is because taking the consistency between them should in-crease the chance that either property is estimated correctly. Think, as an example,
20
a probabilistic evaluation of regional aerosol simulations where histograms are com-pared between simulations and observations separately for CCN concentration and dry extinction coefficient. The error in the estimate of each quantity may be obscured by its dynamic range and overlooked. This is less likely with the CCN/σ0.75 ratio, be-cause the CCN–σ relationship is tighter than is the dynamic range of either property.
25
ACPD
15, 2745–2789, 2015The relationship between CCN concentration and dry light extinction
Y. Shinozuka et al.
Title Page
Abstract Introduction
Conclusions References
Tables Figures
◭ ◮
◭ ◮
Back Close
Full Screen / Esc
Printer-friendly Version
Interactive Discussion
Discussion
P
a
per
|
Discussion
P
a
per
|
Discussion
P
a
per
|
Discussion
P
a
per
|
basis in Table 2). Thus, the evaluation of the simulations would be more effective if the histograms of the ratio are considered in addition to those of each quantity.
4.2 Implications for satellite-based CCN estimates
The relationship of CCN to AOD, rather than to the dry extinction, is relevant to the satellite-based CCN estimates with passive sensors. The relationship is influenced
5
considerably by the vertical profile of aerosols and their humidity growth. These strongly meteorology-dependent variables are difficult to parameterize and better left with trans-port models and direct observations to determine. Here we argue that, in general, these variables should not make log CCN–log AOD relationship steeper than the log CCN– logσ. We also consider how the variability in the CCN–AOD relationship is magnified
10
from that of the CCN–σby these variables as well as horizontal-temporal variability and measurement errors. We simulate CCN–AOD relationship for two scenarios, compare the results with the existing parameterizations and discuss implications for the study of aerosol-cloud interactions.
The relationship between boundary layer CCN concentration and column AOD in
15
a given humidity environment is influenced by aerosol spatio-temporal distribution and intensive properties, as well as measurement errors (see Sect. 1). Our analysis of the central Canada data illustrates a way to isolate these influences from each other. The observed relationship in large part reflects the CCN–extinction relationship for dried particles within boundary layer air masses, as indicated by their resemblance in slope
20
and a minor reduction in deviation (Sect. 3.1, compare Fig. 1a and b). This data set is exceptionally suitable for demonstrating the resemblance, thanks primarily to the predominance of low-altitude aerosols, low relative humidity and high organic content of the particles from local forest fires, as well as the wide dynamic ranges that make the regression robust.
25
ACPD
15, 2745–2789, 2015The relationship between CCN concentration and dry light extinction
Y. Shinozuka et al.
Title Page
Abstract Introduction
Conclusions References
Tables Figures
◭ ◮
◭ ◮
Back Close
Full Screen / Esc
Printer-friendly Version
Interactive Discussion
Discussion
P
a
per
|
Discussion
P
a
per
|
Discussion
P
a
per
|
Discussion
P
a
per
situ dry measurements (Ziemba et al., 2012; Tesche et al., 2014). One can then reduce a satellite observation of AOD to the dry light extinction, for example by applying the following:
σ=(AOD − AODstr)/H/f(RH) (4)
where AODstr is the stratospheric AOD and H, the aerosol layer thickness.f(RH) is the
5
extinction coefficient of the ambient particles divided by that of dried particles, which is approximated by a scalar in this expression in spite of its altitude dependence. The extinction and its Angstrom exponent can then be inserted into Eq. (1) to yield a CCN concentration estimate.
This strategy assumes that the CCN–extinction relationship found in our airborne
10
(<1 km altitude) and ground-based measurements holds for the cloud-base altitude. This assumption may or may not be valid. Ghan et al. (2006) find that the vertical profile of normalized dry extinction closely follows that of CCN concentration on most of the flights they examine, particularly within the lowest kilometer above the surface. Stier et al. (2015) find a large variability in their model.
15
The uncertainties in the vertical profile and the humidity response needs to be com-bined with the factor of 2.0 error associated with our CCN–extinction parameterization. Uncertainties also arise from horizontal-temporal variability and measurement errors for the satellite-based estimates, though these additional factors are negligible for our airborne and ground-based data.
20
The presence of a dust layer aloft, for example, complicates the CCN–AOD relation-ship. The vertical profile depends on aerosol source and evolution as well as meteo-rological conditions, and may exert an uncertainty comparable with, or greater than, a factor of 2.0. The slope is also influenced and might be systematically decreased from 0.75±0.25, due to widening of the relative dynamic range, as the dry extinction is
25
ACPD
15, 2745–2789, 2015The relationship between CCN concentration and dry light extinction
Y. Shinozuka et al.
Title Page
Abstract Introduction
Conclusions References
Tables Figures
◭ ◮
◭ ◮
Back Close
Full Screen / Esc
Printer-friendly Version
Interactive Discussion
Discussion
P
a
per
|
Discussion
P
a
per
|
Discussion
P
a
per
|
Discussion
P
a
per
|
example, the planetary boundary layer height generally increases and aerosol loading decreases away from the coast in the subtropical regions. But such a negative corre-lation is not known to exist systematically over the globe. Higher satellite resolution in vertical, horizontal and temporal dimensions, if achieved without significantly sacrific-ing AOD retrieval accuracy, will better constrain the relationship. Model estimates of
5
aerosol layer thickness over wide horizontal and temporal extents will continue to be useful and might be improved with assimilated satellite data.
The response of light extinction to humidity changes is also difficult to ascertain, es-pecially from remote sensing. Because the enhanced scattering due to water uptake by the particles can exceed a factor of 2.0 and varies widely in humid environment
10
(Howell et al., 2006; Shinozuka et al., 2007; Tesche et al., 2014), its uncertainty might be comparable with or greater than a factor of 2.0, especially if the ambient humidity is unknown, high, or variable (Kapustin et al., 2006). In theory, the response of light extinction to humidity changes should be partly correlated with particle hygroscopic-ity, at least for aerosols whose chemical composition varies little with size. If such an
15
association existed in humid environments, increases in light extinction would tend to be accompanied by lower critical dry diameter for activation and hence higher CCN concentrations. This would work to reduce the variability in the CCN per extinction and might help remote sensing of CCN concentration. However, such association is not evident in the central Canada data.
20
Like the vertical profile, the humidity response should randomly diversify the slope or, possibly, systematically decrease it. If the impact of hygroscopicity is greater on the AOD than on the CCN concentration, as is probably the case for all but hydrophobic particles in dry conditions, this effect may work to lower the slope when the extinction for dried particles is replaced with the ambient AOD for humid environment (not evident
25
ACPD
15, 2745–2789, 2015The relationship between CCN concentration and dry light extinction
Y. Shinozuka et al.
Title Page
Abstract Introduction
Conclusions References
Tables Figures
◭ ◮
◭ ◮
Back Close
Full Screen / Esc
Printer-friendly Version
Interactive Discussion
Discussion
P
a
per
|
Discussion
P
a
per
|
Discussion
P
a
per
|
Discussion
P
a
per
of dried particles, it is logical to expect the relationship to the columnar ambient (not dried) AOD to have a slope smaller than unity as well.
The effects of horizontal-temporal variability are difficult to assess. The variability in the CCN concentration is partly a consequence of that in aerosol intensive properties such as size and hygroscopicity. This is accounted for in the factor of 2.0 error in our
5
CCN-to-dry-extinction parameterization. Some of the horizontal-temporal variability in extensive properties is also accounted for, if the uncertainty in the estimate of verti-cal profile encompasses the horizontal-temporal variability of the vertiverti-cal profile itself. The same is true for the humidity response of extinction. With the CCN–σ link, verti-cal profile and humidity response taken care of, the horizontal-temporal variability that
10
remains to be accounted for is only of the AOD. More precisely, we should consider the AOD variability between the satellite and model grid boxes that is not included in the uncertainty estimate for the satellite AOD products, and enter this into the overall uncertainty in satellite-based CCN estimates. This way only the impact of the humidity response is double-counted.
15
The AOD horizontal-temporal variability within satellite grid boxes is negligible in comparison with other sources of uncertainty associated with AOD-based estimates of CCN. The AOD seldom varies by a few tens of percent within satellite grid cells (Shi-nozuka and Redemann, 2011) or within a time window in which the air travels tens of kilometers. This is small compared with the factor of 2.0 variability associated with the
20
local dry CCN–extinction relationship. Note that the AOD presented in Shinozuka and Redemann (2011) is measured from a single aircraft and averaged over one kilometer distance. The variability over one kilometer distance must be generally smaller than that over 1 km×1 km area, and is probably closer to that over 0.5 km×0.5 km area
(see Sect. 2.6 and Supplement of Shinozuka and Redemann, 2011). These statistics
25
mat-ACPD
15, 2745–2789, 2015The relationship between CCN concentration and dry light extinction
Y. Shinozuka et al.
Title Page
Abstract Introduction
Conclusions References
Tables Figures
◭ ◮
◭ ◮
Back Close
Full Screen / Esc
Printer-friendly Version
Interactive Discussion
Discussion
P
a
per
|
Discussion
P
a
per
|
Discussion
P
a
per
|
Discussion
P
a
per
|
ters if the CCN concentration for cloud pixels is to be estimated from AOD retrieved for clear-sky pixels hundreds of kilometers away.
Besides these aerosol properties, the satellite retrieval uncertainties can also pose a challenge to AOD-based estimates of the CCN concentration. For example, an AOD retrieval uncertainty of 30 % translates into a 22 % uncertainty in the CCN concentration
5
because of the 0.75 exponent. An Angstrom exponent uncertainty of ±0.2 translates into a+15 %/−13 % uncertainty ((10(±0.2·0.3)−1)·100 %). If these two sources of uncer-tainties are independent of each other (which may not be correct), then the retrieval uncertainty alone makes the estimated CCN uncertain by+26 %/−25 %. An AOD error
by 100 % and an Angstrom exponent error by 0.5 result in a+80 %/−74 % uncertainty
10
in the estimated CCN – comparable with our observed factor of 2.0.
We illustrate in Fig. 6a how our CCN–σ parameterization can be translated into the CCN–AOD relationship for given scenarios. Values of the Angstrom exponent, layer depth, humidity response and AOD retrieval uncertainties are assumed separately for remote marine aerosols (0.2±0.2, 2±1 km, 3±1,±0.03±0.05×AOD for AOD between
15
0.02 and 0.2; blue dashed curve) and polluted continental ones (2±0.2, 3±1.5 km,
2±0.5, ±0.05±0.15× AOD for AOD between 0.03 and 0.3; red dashed curve). The
slight bend near AOD of 0.01 with both curves is caused by the assumed stratospheric AOD of 0.01 that is not converted to CCN. This treatment makes the CCN–AOD slope steeper for small AOD values that many satellite pixels, especially those in pristine
20
marine conditions, observe. The uncertainties represented by shades were computed by means of Monte Carlo simulations for the factor of 2.0 variability of our parameter-ization and the assumed uncertainties indicated above. The overall uncertainties are a factor of∼3 for AOD500 nm<∼0.1 and a little over a factor of 2 for the rest.
Experiment averages over hundreds of kilometres and months shown in Fig. 1 and
25
parame-ACPD
15, 2745–2789, 2015The relationship between CCN concentration and dry light extinction
Y. Shinozuka et al.
Title Page
Abstract Introduction
Conclusions References
Tables Figures
◭ ◮
◭ ◮
Back Close
Full Screen / Esc
Printer-friendly Version
Interactive Discussion
Discussion
P
a
per
|
Discussion
P
a
per
|
Discussion
P
a
per
|
Discussion
P
a
per
terization almost triples the CCN concentration as the Angstrom exponent is increased from 0.5 to 2.0. Applying regression through multiple aerosol types without accounting for the size differences invites the log CCN–log AOD slope to appear greater than it ac-tually is in finer scales within aerosol types. This can mislead satellite-based estimates of ACI. Also, the use of standard least squares regression may exacerbate the
over-5
estimate of the slope when uncertainties associated with both the CCN and AOD are large (see Sect. 2.2). The uncertainties include the effect of the spatio-temporal gap between the two measurements.
Aerosol index can work well for fine particles. The dash-dot lines in Fig. 6b show that with an adequate constant of proportionality (say, 3000), the 500 nm AOD multiplied
10
by the Angstrom exponent can predict the number concentration nearly as well as our measurement-based parameterization does.
However, two characteristics of this product deviate from the reality. First, AI de-creases as rapidly as Angstrom exponent does. Atα=0.2, the AI-based CCN estimate is significantly lower than ours (blue curves in Fig. 6b); atα <0, AI is negative. Our
pa-15
rameterization, derived from log-log plots, always returns a positive CCN concentration as long as the extinction coefficient is positive.
Second, AI is proportional to the AOD with the Angstrom exponent kept unchanged. Nakajima et al. (2001) suggested raising the product to the power of 0.869, which subsequent studies neglected. Doing so would make it a better surrogate for CCN,
20
closer to 0.75, the value we find through the direct observations.
The slope is smaller in our parameterization than any of the existing ones. This, we expect, is translated into a smaller CCN variability, at least by a simplistic model where satellite AOD is directly converted to the CCN using such a parameterization. As a result, satellite-based estimates of radiative forcing through the interactions between
25