www.biogeosciences.net/12/2517/2015/ doi:10.5194/bg-12-2517-2015
© Author(s) 2015. CC Attribution 3.0 License.
First on-line isotopic characterization of N
2
O above intensively
managed grassland
B. Wolf1,2, L. Merbold3, C. Decock3, B. Tuzson1, E. Harris1, J. Six3, L. Emmenegger1, and J. Mohn1
1Laboratory for Air Pollution/Environmental Technology, Empa, Überlandstrasse 129, 8600 Dübendorf, Switzerland 2Institute for Meteorology and Climate Research (IMK-IFU), Karlsruhe Institute of Technology, Kreuzeckbahnstrasse 19, 82467 Garmisch-Partenkirchen, Germany
3Department of Environmental Systems Science, ETH Zurich, Universitätsstrasse 2, 8092 Zürich, Switzerland
Correspondence to:B. Wolf ([email protected])
Received: 9 December 2014 – Published in Biogeosciences Discuss.: 23 January 2015 Revised: 1 April 2015 – Accepted: 3 April 2015 – Published: 29 April 2015
Abstract.The analysis of the four main isotopic N2O species (14N14N16O,14N15N16O,15N14N16O,14N14N18O) and es-pecially the intramolecular distribution of15N (“site prefer-ence”, SP) has been suggested as a tool to distinguish source processes and to help constrain the global N2O budget. How-ever, current studies suffer from limited spatial and tem-poral resolution capabilities due to the combination of dis-crete flask sampling with subsequent laboratory-based mass-spectrometric analysis. Quantum cascade laser absorption spectroscopy (QCLAS) allows the selective high-precision analysis of N2O isotopic species at trace levels and is suit-able for in situ measurements.
Here, we present results from the first field campaign, con-ducted on an intensively managed grassland site in central Switzerland. N2O mole fractions and isotopic composition were determined in the atmospheric surface layer (at 2.2 m height) at a high temporal resolution with a modified state-of-the-art laser spectrometer connected to an automated N2O preconcentration unit. The analytical performance was deter-mined from repeated measurements of a compressed air tank and resulted in measurement repeatability of 0.20, 0.12 and 0.11 ‰ for δ15Nα,δ15Nβ andδ18O, respectively. Simulta-neous eddy-covariance N2O flux measurements were used to determine the flux-averaged isotopic signature of soil-emitted N2O.
Our measurements indicate that, in general, nitrifier-denitrification and nitrifier-denitrification were the prevalent sources of N2O during the campaign and that variations in iso-topic composition were due to alterations in the extent to which N2O was reduced to N2 rather than to other
path-ways, such as hydroxylamine oxidation. Management and rewetting events were characterized by low values of the in-tramolecular15N site preference (SP), δ15Nbulk andδ18O, suggesting that nitrifier-denitrification and incomplete het-erotrophic bacterial denitrification responded most strongly to the induced disturbances. The flux-averaged isotopic com-position of N2O from intensively managed grassland was 6.9±4.3,−17.4±6.2 and 27.4±3.6 ‰ for SP,δ15Nbulkand δ18O, respectively. The approach presented here is capable of providing long-term data sets also for other N2O-emitting ecosystems, which can be used to further constrain global N2O inventories.
1 Introduction
de-velopment of adequate mitigation strategies is pertinent and requires a better understanding of the processes driving N2O fluxes. To date, nitrification, nitrifier-denitrification and den-itrification are considered to constitute the dominant N2O-producing processes, especially in agricultural soils (Wrage et al., 2001). Other N2O source processes such as abiotic N2O production, co-denitrification and heterotrophic nitrifi-cation have also been observed; a concise overview of ob-served processes is given elsewhere (Butterbach-Bahl et al., 2013). This complexity inherent in the N cycle and associ-ated transformation processes is a major challenge in devel-oping mitigation strategies, as the attribution of N2O produc-tion to the respective processes is required to tailor target-oriented actions (Baggs, 2008). Approaches for apportion-ing N2O emissions to nitrification and denitrification and N2O reduction to N2(source partitioning) have mostly relied on acetylene (C2H2) inhibition and isotope labeling (Groff-man et al., 2006), but denitrification rates are underestimated by the C2H2 method (Butterbach-Bahl et al., 2013; Groff-man et al., 2006; Watts and Seitzinger, 2000). Isotope label-ing approaches are vulnerable to incomplete diffusion of the tracer and to the stimulation of process rates by the addi-tion of the labeled substrates themselves (Groffman et al., 2006). Changes in the natural abundance of15N and18O in N2O have been explored to investigate N2O production pro-cesses, but the δ15N and δ18O determined depend on both fractionation factors and the isotopic composition of precur-sors, which in turn exhibit strong variations (Baggs, 2008; Bedard-Haughn et al., 2003; Heil et al., 2014; Toyoda et al., 2011).
N2O is a linear molecule and four main isotopic species can be discerned: 14N14N16O,14N15N16O,15N14N16O and 14N14N18O. The isotopic species 14N14N16O, 14N14N18O and 14N15N16O (or 15N14N16O) are isotopologues, while 14N15N16O and 15N14N16O are isotopomers and will be termed 15Nα-N2O and 15Nβ-N2O (Toyoda and Yoshida,
1999). The umbrella term isotopocule is used for both iso-topomers and isotopologues. The intramolecular distribution of15N in N2O (“site preference”; SP=δ15Nα−δ15Nβ) has
been reported to be independent of the substrate’s isotopic composition, as SP in the N2O produced de novo remained constant even though δ15N and δ18O values of both N2O and substrates changed markedly during experiments with pure cultures (Heil et al., 2014; Sutka et al., 2003, 2006, 2008; Toyoda et al., 2005). Therefore, SP can be consid-ered as a tracer conserving the source process information (Ostrom and Ostrom, 2011). The SP of different processes has been characterized in a number of pure-culture, mixed-culture (Ostrom et al., 2007; Sutka et al., 2003, 2006; Toyoda et al., 2005; Wunderlin et al., 2012, 2013) and soil-incubation studies (Köster et al., 2011, 2013a; Lewicka-Szczebak et al., 2014; Well et al., 2006, 2008), with a compilation of data in Toyoda et al. (2011). A recent review on source par-titioning and SP (Decock and Six, 2013b) concluded that SP is capable of distinguishing between the process groups
N2ON(NH2OH oxidation, fungal denitrification and abiotic N2O production; SP=32.8±4.0 ‰) and N2OD
(nitrifier-denitrification and (nitrifier-denitrification; SP= −1.6±3.8 ‰). In
addition, N2O isotopocules can be used as an independent validation of the global, measurement-based bottom-up N2O budget and have already confirmed that the isotopically light sources such as agriculture and industry contribute to the increase in atmospheric N2O (Toyoda et al., 2013; Yoshida and Toyoda, 2000). Owing to the temporal and spatial vari-ability of isotopomer ratios, it is indispensable to derive flux-weighted average values from different sources (such as ecosystems) for later use in budget analysis using box mod-els (Kim and Craig, 1993; Perez et al., 2001; Yoshida and Toyoda, 2000).
N2O isotopomers can be measured by mass spectrometry, but this requires discrete flask sampling with subsequent lab-oratory analysis. Hence, this approach is limited in temporal resolution and spatial representation of a given site. Addi-tionally, it is indirect, as information on the site-specific iso-topic composition is derived from the analysis of the NO+ fragment and N2O+molecular ion. Recently, a quantum cas-cade laser absorption spectrometer (QCLAS) capable of se-lective analysis of the three most abundant N2O isotopocules has been presented (Waechter et al., 2008), and its potential for in situ measurements in conjunction with an automated pre-concentration unit has been shown (Mohn et al., 2010, 2012). Here we present the results obtained from a, to our knowledge first, campaign in which the isotopic composition of N2O (SP,δ15N,δ18O) in the atmospheric surface layer was determined on-line by using an optimized state-of-the-art laser spectrometer. Using the combination of N2O isotopic analysis by QCLAS, accompanying eddy-covariance-based N2O flux measurements as well as the monitoring of environ-mental conditions and inorganic nitrogen concentrations, our specific objectives for this study were (i) to demonstrate the capability of QCLAS systems for carrying out high-precision isotopic analysis of (soil-emitted) N2O in ambient air; (ii) to investigate management and weather effects on isotopic composition and source processes; and (iii) to characterize the flux-averaged isotopic composition of N2O emitted from an intensively managed grassland site.
2 Material and methods
2.1 Study site
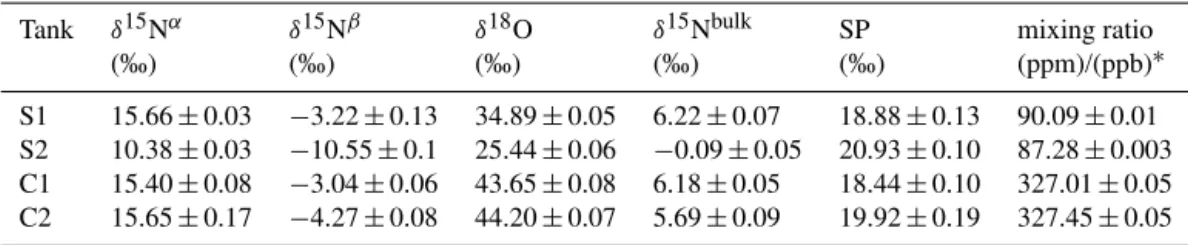
con-Table 1.Reference gas and compressed air tanks used during the campaign. S1 and S2 represent the anchor and calibration standard. C1 and C2 are the target gases used for determination of system performance. The reported precision is 1σ.
Tank δ15Nα δ15Nβ δ18O δ15Nbulk SP mixing ratio
(‰) (‰) (‰) (‰) (‰) (ppm)/(ppb)∗
S1 15.66±0.03 −3.22±0.13 34.89±0.05 6.22±0.07 18.88±0.13 90.09±0.01 S2 10.38±0.03 −10.55±0.1 25.44±0.06 −0.09±0.05 20.93±0.10 87.28±0.003 C1 15.40±0.08 −3.04±0.06 43.65±0.08 6.18±0.05 18.44±0.10 327.01±0.05 C2 15.65±0.17 −4.27±0.08 44.20±0.07 5.69±0.09 19.92±0.19 327.45±0.05
∗ppm for S1 and S2, ppb for C1, C2.
tent in the top 10 cm was 37.9 and 4.1 g kg−1(Roth, 2006). Mean annual temperature and annual precipitation are 9.1◦C and 1151 mm, respectively (Zeeman et al., 2010). Manage-ment practices aim at fodder production and consist of mow-ing followed by slurry application, with up to six mowmow-ing and slurry applications per year and the occasional grazing of sheep and cattle in October and November. During the campaign in summer 2013, three management cycles were carried out. Harvest dates were 6 June, 11 July and 21 Au-gust, and slurry was applied within 10 days after each mow-ing event. Nitrogen input was calculated from the amount of slurry applied to the field and the N concentration determined (Labor für Boden- und Umweltanalytik, Eric Schweizer AG, Thun, Switzerland) in a sample drawn from the supply to the trailing hose applicator. The applied N amounted to 30, 40 and 43.3 kg N ha−1 for the first, second and third appli-cation, respectively. Grassland is reestablished via ploughing and resowing approximately every 10 years. The last reestab-lishment event took place in 2012 (Merbold et al., 2014).
2.2 Instrumental setup for analysis of N2O isotopocule ratios
The four most abundant N2O isotopic species were quanti-fied using a modiquanti-fied QCLAS (Aerodyne Research Inc., Bil-lerica MA, USA) equipped with a continuous-wave quan-tum cascade laser (cw-QCL) with spectral emission at 2203 cm−1, an astigmatic Herriott multi-pass absorption cell (204 m path length, AMAC-200) and a reference path with a short (5 cm) N2O-filled cell to lock the laser emission frequency (Tuzson et al., 2013). During the campaign, the QCLAS was operated in an air-conditioned trailer located 60 m west of the eddy-covariance (EC) tower. This trailer position contributes<20 % to the main flux and is at the far side of the prevailing wind direction (Zeeman et al., 2010). The sample air inlet was installed next to the inlet of the EC tower (2.2 m height). Sample air was drawn through a PTFE tube (4 mm ID) by a membrane pump (PM 25032-022, KNF Neuberger, Switzerland). Upstream of the pump, the sample air was pre-dried with a permeation drier (MD-050-72S-1, PermaPure Inc., USA). Following the pump, the pressure was maintained at 4 bar overpressure using a
pres-sure relief valve. Humidity as well as CO2 were quantita-tively removed from the gas flow by applying a chemical trap filled with Ascarite (7 g, 10–35 mesh, Fluka, Switzerland) bracketed by Mg(ClO4)2(2×1.5 g, Fluka, Switzerland). Fi-nally, the sample gas was passed through a sintered metal filter (SS-6F-MM-2, Swagelok, USA) and directed to a pre-concentration unit described in detail previously (Mohn et al., 2010, 2012). For an increase in N2O mixing ratios from ambient level to around 50 ppm N2O, approx. 8 L of am-bient air were preconcentrated. Afterwards, the preconcen-trated N2O was introduced into the evacuated multi-pass cell of the QCLAS. Isotopic fractionation during preconcentra-tion (increase by 0.31±0.10, 0.34±0.16 and 0.29±0.07 ‰
forδ15Nα,δ15Nβ andδ18O, respectively) was quantified by the preconcentration of N2O with a known isotopic com-position and subsequently corrected. The compatibility of N2O isotopomer analysis by QCLAS with isotope ratio mass spectrometry (IRMS) laboratories was recently demonstrated in an inter-laboratory comparison campaign (Mohn et al., 2014).
2.3 Measurement and calibration strategy
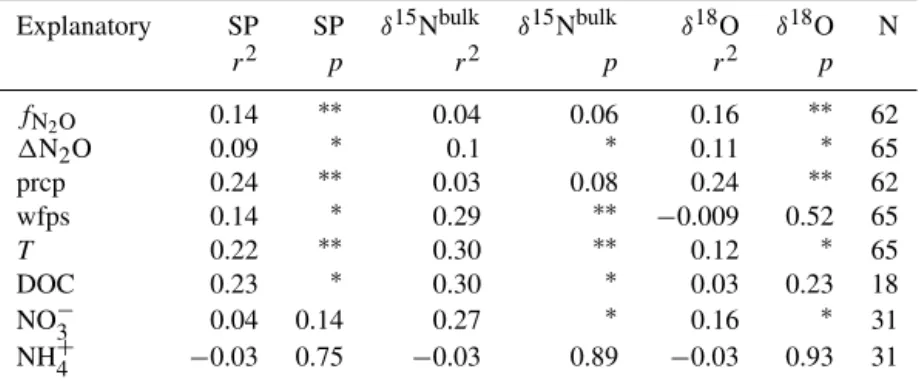
tar-Table 2.Adjustedr2andpvalues for regression analysis of Keeling-plot-derived isotopic compositions in soil-emitted N2O versus auxiliary variables N2O flux (fN2O), difference of maximum and minimum concentration over a noon-to-noon period (1N2O), precipitation (prcp), soil moisture (wfps), and nutrient concentrations (NO−3, NH+4 and DOC).
Explanatory SP SP δ15Nbulk δ15Nbulk δ18O δ18O N
r2 p r2 p r2 p
fN2O 0.14 ∗∗ 0.04 0.06 0.16 ∗∗ 62
1N2O 0.09 ∗ 0.1 ∗ 0.11 ∗ 65
prcp 0.24 ∗∗ 0.03 0.08 0.24 ∗∗ 62 wfps 0.14 ∗ 0.29 ∗∗ −0.009 0.52 65
T 0.22 ∗∗ 0.30 ∗∗ 0.12 ∗ 65
DOC 0.23 ∗ 0.30 ∗ 0.03 0.23 18 NO−3 0.04 0.14 0.27 ∗ 0.16 ∗ 31 NH+
4 −0.03 0.75 −0.03 0.89 −0.03 0.93 31
Significance codes:∗p <0.05;∗∗p <0.001. Sample size (n) differs due to data availabilities.
geted to closely resemble background air. As the N2O iso-topic composition of surface layer air is mainly a mixture of soil-derived and background composition, the second stan-dard (S2, Table 2) used for span correction was depleted in δ15Nα,δ15Nβ andδ18O compared to background air in ac-cordance with the expected terrestrial source signatures.
The measurement protocol started with the injection of S1, dynamically diluted to 50 ppm, the mole fraction of ambi-ent N2O after preconcambi-entration. After flushing the absorp-tion cell with synthetic air, S2 was injected and also diluted to 50 ppm. For the determination of the slight concentra-tion dependence already reported (Mohn et al., 2012), S1 was injected again but at a higher mole fraction of 67 ppm (later referred to as S1h). This mole fraction represents the mole fraction expected after the preconcentration of high-concentration surface layer air. Subsequently, S1 was in-jected again and diluted to 50 ppm, before the cell was filled with preconcentrated ambient N2O (A). This subrou-tine (S1+A) of injection of S1 and preconcentrated ambient
N2O took 35 min and was repeated three times. For an inde-pendent determination of repeatability, the fourth sample was preconcentrated compressed air (target gas). During the cam-paign, two compressed air cylinders (C1 and C2, referred to as target gas) were used. The isotopic composition and N2O mixing ratio of both cylinders were determined in the labora-tory prior to the campaign start (Table 1). N2O mole fractions and isotopic composition analyzed in the laboratory and at the field site agreed within their analytical uncertainty. Fol-lowing target gas analysis, S1 and S1hwere analyzed again. Another set of three subroutines S1+A completed one run.
One complete cycle of 6 ambient air samples and one com-pressed air sample took 340 min, leading to approx. 25 ambi-ent air samples being analyzed during 24 h. N2O mole frac-tions were determined according to Mohn et al. (2012).
2.4 Data processing
Data processing is based on individual mixing ratios of the four main N2O isotopic species and spectrometer character-istics as recorded by the instruments’s software (TDLWin-tel, Aerodyne Research Inc., Billerica, MA, USA). In the first step, variations in the isotope ratios induced by drifts in the instrument working parameters during the field op-eration were corrected. A linear additive model explaining the deviation of isotope ratiosRα,RβandR18Ofor repeated measurements of standard S1 from their mean value by ab-sorption cell temperature (T1), laser temperature (T2), line position (LP) and pressure (p) was calibrated based on S1 injections. For isotope ratios of S1, S1h, S2, sample air and compressed air, these systematic deviations were corrected based on the respective values ofT1,T2, LP andp. In a sec-ond step, concentration dependence of isotope ratios, deter-mined using the measurements of S1 and S1h, was addressed with corrections (0.013, 0.028 and 0.004 ‰ ppb−1forδ15Nα,
δ15Nβ andδ18O) being in the same range as described ear-lier (Mohn et al., 2012). Subsequently, remaining drifts were corrected based on the analysis of S1. Finally, isotope ratios were converted toδvalues using a two-point calibration de-rived from corrected values of S1 and S2.
2.5 Determination of soil-emitted N2O isotopic composition
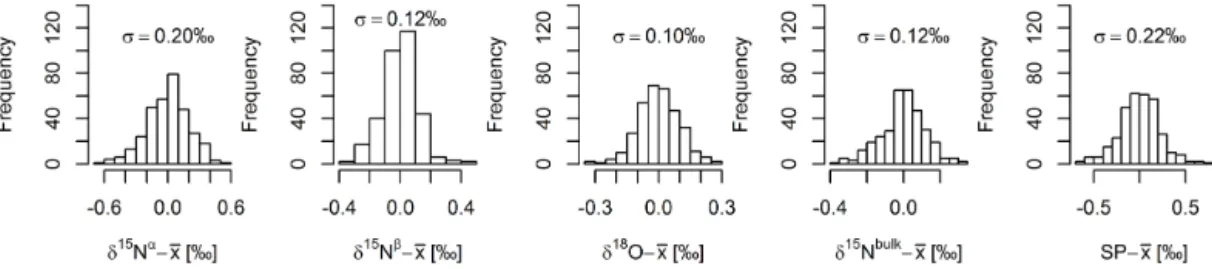
at-Figure 1.Long-term stability (standard deviationσ) derived by target gas injections (n=331) over a 3-month period. As two target gas tanks were used, histograms show deviation of respective tank means,x¯, forδ15Nα,δ15Nβ,δ18O,δ15Nbulkand SP.
mospheric background. At night, the surface layer becomes more stable and the N2O mole fraction increases, shifting isotopic composition towards its source composition. As a consequence, Keeling plots were based on noon-to-noon pe-riods. This approach is discussed in Sect. 4.6.
2.6 N2O flux measurement
At CHA, greenhouse gas mole fractions, including N2O, have been measured continuously since 2012 by means of the EC method (Baldocchi and Meyers, 1998). The system consists of a three-dimensional sonic anemometer to mea-sure wind speed and direction (2.41 m height, Solent R3, Gill Instruments, Lymington, UK) and a QCLAS (mini-QCLAS, Aerodyne Research Inc., Billerica, MA, USA) to determine N2O mole fractions at a temporal resolution of 10 Hz. Both data streams are merged in near real time within a data ac-quisition system (MOXA embedded Linux computer; Moxa, Brea, CA, USA) via an RS-232 serial data link (Eugster and Plüss, 2010). The setup has been described in detail previously (Merbold et al., 2014). Post-processing of N2O fluxes included screening for obvious out-of-range values (±100 nmol m−2s−1). N2O fluxes were further aggregated
to noon-to-noon daily averages to smoothen the large vari-ability in the 30 min flux averages. Daily averages were cal-culated for days where more than 30 half-hour values were available, with this filter excluding 3 days from analysis.
2.7 Soil inorganic N, dissolved organic C and environmental conditions
Ammonium (NH+
4) and nitrate (NO−3) concentrations were determined from soil (0–20 cm depth) sampled at 10 posi-tions along a transect within the footprint of the EC measure-ments following the predominant wind direction. Samples were taken weekly throughout the campaign or daily during mowing and slurry application events. Per sample,∼15 g of
fresh soil were added to specimen vessels containing 50 mL 1 M KCl. After 1 h on a shaker, the supernatant was filtered (Whatman no. 42 ashless filter paper, 150 mm diameter) and analyzed colorimetrically for NH+
4 and NO −
3. For a subset of extracts, we determined dissolved organic carbon (DOC) concentrations by combustion of KCl extracts using a
to-tal organic C analyzer (Shimdazu TOC-V, Columbia, MD, USA).
Soil temperatures and volumetric soil moisture contents at 10 cm depth were measured at the same 10 locations along the transect (5TM-sensors, Decagon Devices Ltd., Pullman, USA). Data were stored as 10 min averages on a data logger (EM50, Decagon Devices Ltd., Pullman, USA). The volu-metric water content was converted to water-filled pore space (wfps) using a bulk density of 1.09 g cm−3. Precipitation was measured with a tipping bucket rain gauge (Type 10116, Toss GmbH, Potsdam, Germany) and stored as 10 min averages on a data logger (CR10X-2M, Campbell Scientific Inc., Logan, USA).
3 Results
3.1 Long-term precision for target gas analysis
System performance for N2O mole fractions and isotopic composition was determined based on the repeated analysis of compressed air from target gas tanks (C1, C2). There was no significant drift in theδvalues and N2O mole fractions, in-dicating the stability of the applied measurement technique. Repeatability, calculated as the standard deviation (σ) of 331 target gas measurements, amounted to 0.20, 0.12, 0.10, 0.12 and 0.22 ‰ forδ15Nα,δ15Nβ,δ18O,δ15Nbulkand SP, respec-tively (Fig. 1). The standard deviation for the N2O mole frac-tion of the target gas was 0.25 ppb.
3.2 N2O mole fractions and isotopic composition at 2.2 m height
Air samples were taken at 2.2 m height, which is within the lowest 10 % of the atmospheric boundary layer (ABL) where mechanical generation of turbulence exceeds buoyant gener-ation or consumption. This part of the ABL is called surface layer; hence, corresponding air samples are referred to as face layer air samples. N2O isotopic composition of the sur-face layer air samples (n=2130) ranged from 2.5 to 16.1 ‰, −11.9 to−2.4 ‰, 37.6 to 44.6 ‰,−4.6 to 6.6 ‰ and 14.3
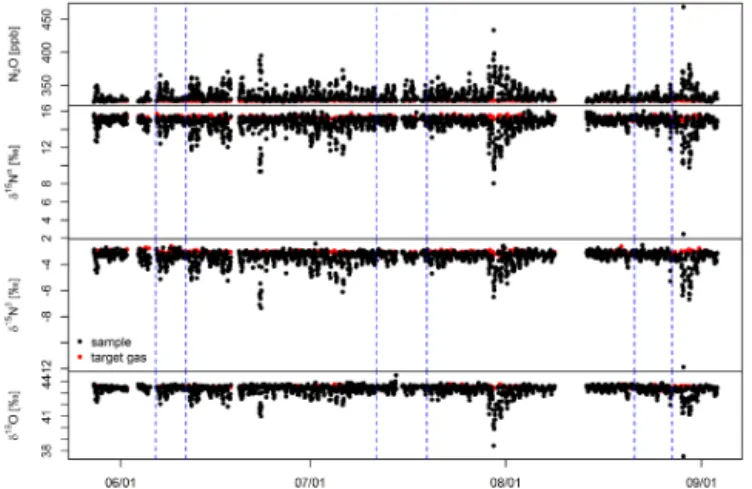
highest values during the night, when the boundary layer be-came more stable. Increasing N2O mole fractions were asso-ciated with decreasingδ values, indicating that soil-emitted N2O that was mixed into the surface layer was depleted in 15N as compared to N2O in the atmospheric background.
3.3 Auxiliary measurements
Half-hourly N2O fluxes were averaged from noon-to-noon (fN2O) and ranged from −1 to 5 nmol m
−2s−1. Maximum N2O fluxes coincided with an overnight build up in N2O mole fractions (1N2O) as analyzed by QCLAS and could not be attributed to slurry application events alone (Fig. 3). Among the correlations offN2Oand auxiliary variables, only
the one with a nitrate concentration (r2=0.18) was signifi-cant (p <0.01). Soil water content (wfps) was modulated by precipitation, and two clear states could be identified. Dur-ing the “wet” part of the campaign, lastDur-ing until 7 July, av-erage wfps was 62±4 % and thus was significantly (t test,
p <0.001) higher than the average of 37±4 % calculated
for the remainder of the campaign (referred to as the “dry” part). Soil temperature did not show such a clear two-phase pattern; however, temperatures during the first, wet part were 16.7±4◦C and thus significantly (p <0.001) lower than
during the dry phase (21.2±2◦C).
Background NH+
4 and NO−3 concentrations were smaller than 3 µg g−1
soil and clearly responded to mowing and slurry application in the second and third management events. The NO−
3 concentration was higher than the NH +
4 concentration and peaked at 16 and 50 µg g−1
soil, while NH +
4 concentration peaked at 9 and 15 µg g−1
soilfor these two management events. In contrast, dissolved organic carbon concentrations (DOC) did not respond to management events but were higher dur-ing the dry phase of the campaign (p <0.001).
3.4 Isotopic composition of soil-emitted N2O
The uncertainty of the determined source isotopic composi-tion was estimated based on the standard error of the Keel-ing plot intercept and depends on the degree to which soil air accumulates in the surface layer (1N2O, Fig. 4). For in-stance, the intercept (source) standard error ranged from 0.3 to 82 ‰ for SP. To apply the Keeling plot approach only to situations in which soil air accumulated in the surface layer, only source isotopic compositions for overnight increases in N2O mole fractions of more than 12 ppb were considered in this study. This filter led to a maximum and average (µ) standard error of 6.8 (µ=2.2) ‰, 4.5 (µ=1.4) ‰ and 2.2
(µ=1) ‰ for SP,δ15Nbulk andδ18O isotopic source signa-tures, respectively.
During the field campaign, the Keeling-plot-derived iso-topic composition of soil-emitted N2O ranged from 1.4 to 17.3 ‰, −29 to−3 ‰ and 22.6 to 34.8 ‰ for SP,δ15Nbulk and δ18O, respectively. All explanatory variables except NH+
4 and NO −
3 were found to significantly correlate with
Figure 2.Target gas (red) and surface layer (black) N2O mole frac-tions (top) andδvalues (three bottom panels) measured in the at-mospheric surface layer at 2.2 m height during the field campaign. Each pair of vertical dashed blue lines indicates the management events mowing (first line) and fertilization (second line).
SP (Table 2). Forδ15Nbulk, correlations with1N2O, wfps, soil temperature, DOC and NO−
3and forδ18O correlations of fN2O,1N2O, precipitation, soil temperature and NO
− 3 were significant. However, the adjustedr2for all regressions was below 0.4; in addition, multiple explanatory variables such as NH+
4 and NO−3 or wfps and temperature (Fig. 5) did not increase the explained variance above this value.
3.5 Event-based data aggregation
As already described in the section “Auxiliary measure-ments”, there was a wet phase (n=27 Keeling-plot-derived
N2O isotopic compositions) in the beginning of the cam-paign, which lasted about 1 month, and a dry phase last-ing about 2 months (n=38). Therefore, the data set was
split into two corresponding parts with averages of 7.4±3.6
vs. 11.1±4.2 ‰ for SP, −19±3.8 vs. −12.5±5.9 ‰ for
δ15Nbulkand 28.7±2.2 vs. 29.7±3.4 ‰ forδ18O in the wet vs. the dry phase, respectively. Averages of SP andδ15Nbulk were significantly different (p <0.001), butδ18O averages were not. Based on this simple classification, the dry phase contains rewetting events. A rewetting event was defined as a 2-day period starting at the day for which wfps increased. Exclusion of these rewetting events during the dry phase in-creased averageδvalues (n=30) and decreased standard
de-viations for SP,δ15Nbulkandδ18O to 12.5±3.4,−10.8±4.5 and 30.7±2.8 ‰ . Moreover, the difference inδ18O was sig-nificant (p <0.001).
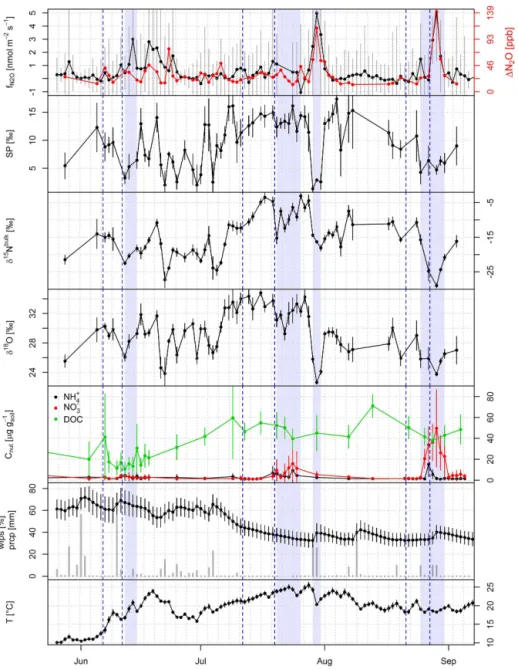
measure-Figure 3. Noon-to-noon averaged N2O flux (fN2O), overnight increase in N2O mole fractions (difference in minimum and maximum N2O concentration in a noon-to-noon period;1N2O), Keeling-plot-derived isotopic composition of soil-emitted N2O (SP,δ15Nbulk,δ18O), nutrient concentrations (ammonium, nitrate and dissolved organic carbon; DOC), water-filled pore space (wfps), precipitation (prcp) and soil temperature (T) over the measurement period. Each pair of vertical dashed blue lines indicates the management events mowing (first line) and fertilization (second line). Transparent blue sections represent periods of N2O emission influenced by management or rewetting (third section).
ments). There were two distinct rewetting events between management events II and III, but N2O isotopic composition is only available for the first one (29–31 July 2014). Isotopic compositions of soil-emitted N2O were assigned to subsets of management or rewetting if the associated flux or nutrient concentration was elevated. This classification scheme led to 3 to 7 measurements for management and rewetting events (Fig. 3, underlaid in blue), while 47 measurements were as-signed to class BG. Boxplots for SP,δ15Nbulk,δ18O and wfps (Fig. 6) showed characteristicδvalues and wfps for
manage-ment and rewetting but not for subset BG. Measuremanage-ments as-signed to BG covered practically the whole range of values observed across all the other classes. Therefore, standard de-viations for class BG were 1 order of magnitude larger than for the four other classes.
us-Figure 4.Standard error for SP (εSP) of soil-derived N2O estimated by the Keeling plot approach as function of overnight N2O accu-mulation in the surface layer. The red dashed line shows 12 ppb in-crease in N2O mole fractions. Red dots represent the selected sub-set.
ing the Bartlett test. For all investigatedδvalues, only differ-ences between groups Mana II and Mana III were significant.
3.6 Averages of N2O isotopic signature for intensively managed grassland
Simple averages of the daily isotopic composition of soil-emitted N2O were 9.6±4.4, −15.2±6.0 and 29.3±3 ‰
for SP,δ15Nbulkandδ18O, respectively (n=62).
Represen-tative isotopic composition of N2O emitted from a given site or treatment can be estimated based on flux-weighted averages of daily isotopic composition. For some noon-to-noon periods included in the above average, thus in-cluding an overnight increase in N2O mole fractions of at least 12 ppb, negative N2O fluxes were detected by the EC system (−0.17±2.1 nmol m−2s−1; n=14). This might be
due to the uncertainty of N2O flux measurements, tempo-ral averaging over positive and negative fluxes in a noon-to-noon period, or different footprint regions for N2O flux and isotopic analysis (flux vs. concentration footprint). To avoid bias in the flux-weighted average of emitted N2O due to either one of the abovementioned possible reasons, the weighted averages were calculated for positive flux events only. Flux-weighted averages were 6.9±4.3, −17.4±6.2
and 27.4±3.6 ‰ for SP, δ15Nbulk and δ18O, respectively (n=48).
Figure 5.Maps of SP in relation to NH+4 and NO−3 and SP in rela-tion to wfps and soil temperature. The size of the points is inversely scaled to Keeling plot intercept standard error so that biggest points are those with lowest uncertainty.
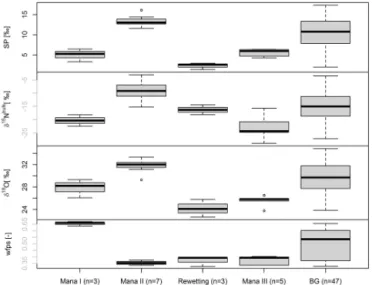
Figure 6.Boxplots for Keeling-plot-derived SP,δ15Nbulk,δ18O of soil-emitted N2O and wfps of management events (Mana I–III), rainfall after a dry period (Rewetting) and the remaining measure-ment period (BG).
4 Discussion
4.1 Analytical performance
To our knowledge, only two pilot studies exist demonstrat-ing the potential of QCLAS-based analytical techniques for on-line and high-precision analysis of N2O mole fractions and isotopic composition in surface layer air. While Mohn et al. (2012) analyzed the three most abundant15N isotopocules (14N14N16O,15N14N16,14N15N16O), Harris et al. (2014) in-cluded the18O isotopologue (14N14N18O). In both studies, however, the instrument was located in the laboratory. Based on 3 weeks of measurements, Mohn et al. (2012) reported a precision of 0.24 and 0.17 ‰ forδ15Nα andδ15Nβ,
ana-lytical performance was determined based on the repeated analysis of compressed air samples. Thereby, the analytical precision reached in the present study was distinctly higher forδ15Nβ andδ18O and similar forδ15Nα compared to these
two previous studies, even though the measurements were done under field conditions and over a much longer, 3-month, period. This confirms the high level of precision associated with the QCLAS-based determination of N2O isotopic com-position. Standard errors for Keeling plot intercepts (Fig. 4) confirm that this precision is sufficient to resolve the vari-ability of atmospheric N2O sampled close to the ground. As our instrument was located directly at the field site and measurements were conducted over a period of more than 3 months, our study indicates that this level of repeatability can be achieved both on long timescales and in the field.
4.2 N2O isotopic composition in the atmospheric surface layer (2.2 m height)
In our study, δ values of single preconcentrated air sam-ples were between atmospheric background and 14.3 ‰ (SP) and −4.7 ‰ (δ15Nbulk). Mohn et al. (2012) reported
simi-lar values between atmospheric background and 12 ‰ (SP) and −4 ‰ (δ15Nbulk). Therefore, the variation observed in
both studies is much higher compared to the measurements by Harris et al. (2014), where the N2O isotopic composi-tion deviated only slightly from atmospheric background. A consistent decrease in δ15Nbulk in parallel with increas-ing N2O mole fractions (accumulation of soil-derived N2O) confirms that the soil N2O source is depleted in 15N-N2O relative to ambient N2O (Toyoda et al., 2013). A similar pat-tern was found forδ18O; an increase in N2O mole fraction was associated with a decrease in 18O-N2O, again indicat-ing that soil emissions were depleted in 18O-N2O with re-spect to the atmospheric background. In contrast, Harris et al. (2014) reported a decoupling ofδ18O andδ15Nbulk. This may have been due to only marginal influence of soil-emitted N2O since the measurements were carried out in an urban area and approx. 95 m above the ground. Studies on N2O de-rived from combustion processes indicate that some of these sources might be less depleted or even enriched in15N-N2O compared to ambient N2O (Harris et al., 2015; Ogawa and Yoshida, 2005).
4.3 Isotopic composition of soil-emitted N2O
The SP of soil-emitted N2O observed in our study (1 to 17 ‰) is within the ranges expected for a mixture of the two process groups N2ON and N2OD and does not neces-sarily indicate a significant contribution of N2O reduction, an effect which is discussed further below. Isotopic com-position of soil-emitted N2O has been predominately deter-mined in laboratory incubation studies (Köster et al., 2013a, b; Perez et al., 2006; Well and Flessa, 2009b; Well et al., 2006, 2008). Additionally, results from field experiments
us-ing static chambers (Opdyke et al., 2009; Ostrom et al., 2010; Toyoda et al., 2011; Yamulki et al., 2001) and N2O accu-mulation below a snowpack have been published (Mohn et al., 2013). Based on pure-culture studies, SP values from 19.7 to 40 and −8.7 to 8.5 ‰, were observed for N2ON
and N2OD, respectively (Decock and Six, 2013b). In field experiments SP was found to range between−1 and 32 ‰
(Opdyke et al., 2009),−3 and 18 ‰ (Yamulki et al., 2001), −14 and 90 ‰ (Toyoda et al., 2011) and 0 and 13 ‰ (Ostrom
et al., 2010). The very high SP values detected by Toyoda et al. (2011) may have resulted from extensive N2O reduction to N2, a process increasing SP,δ15Nbulk andδ18O (Ostrom et al., 2007). Forδ15Nbulk andδ18O, a much wider varia-tion as compared to SP is expected because these variables depend both on fractionation factors, which vary among dif-ferent microbial communities and depend on reaction condi-tions as well as on the isotopic composition of the substrate (Baggs, 2008). Under field conditions,δ15Nbulkwas reported to range between−17 and 9 ‰ (Opdyke et al., 2009),−27
and 1 ‰ (Yamulki et al., 2001),−44 and 34 ‰ (Toyoda et
al., 2011), and−18 and−15 ‰ (Ostrom et al., 2010),
cov-ering the range of−29 to−3 ‰ observed in this study. With
respect toδ18O, the values of 22.6 to 34.8 ‰ detected for grassland in this study are at the lower end of measurements under field conditions (4–82 ‰).
4.4 Changes in N2O source signatures induced by N2O reduction to N2
Quantitative source partitioning between process groups N2ONand N2ODbased on SP is possible only when no other processes except those contained in the process groups have an influence on the site-specific N2O isotopic composition. However, in the terminal step of denitrification, namely the reduction of N2O to N2, N–O bonds between lighter iso-topes are cleaved preferentially, leading to an increase in SP, δ15Nbulkandδ18O in the remaining N2O. Consequently, part of the N2O originating from a combination of the two process groups, i.e., N2ONand N2OD, may have been consumed by N2O-to-N2reduction prior to emission.
Figure 7.Left panel: map of SP vs.δ15Nbulk, with rectangles repre-senting process groups N2ONand N2ODbased on SP values in De-cock and Six (2013b),δ15Nbulkestimated from minimum and max-imum fractionation factors reported in Baggs (2008), and substrate isotopic compositions reported by Bedard-Haughn et al. (2003), Pörtl et al. (2007) and Toyoda et al. (2011). Right panel: map of SP vs.δ18O with traces of management events (Mana I in black, Mana II in red, Mana III in green) and the rewetting event (blue). Isotopic compositions are plotted for the transparent blue sections in Fig. 3, including one preceding and one following composition. The preceding composition is represented by the enlarged filled triangle and transparency of the line connecting the composition decreases with event duration.
−40 to−15 ‰ were assumed (Baggs, 2008); for the isotopic
compositions of the N2O precursors (i.e., NH+4 and NO−3) a range of−20 to+10 and−25 to 15 ‰ were assumed. Koba
et al. (2009) attributed a concurrent decrease inδ15Nbulkwith increasing SP values as indicative of an increasing contribu-tion of N2ON. In contrast, an increase inδ15Nbulkin parallel with increasing SP values (enrichment of 15N in the α po-sition relative to theβ position), as observed in the present study, was attributed to a substantial increase in N2O reduc-tion to N2. Our results (Fig. 7, left panel) indicate that N2O is predominately formed by bacterial denitrification and that deviations in the isotope values from denitrification may have been caused by variations in the extent to which N2O was reduced to N2. It is noteworthy that, based on such modi-fied isotope maps, systematic changes in δ15Nbulk induced by systematic changes in the N isotopic composition of one of the precursors NH+
4 or NO−3 could be misinterpreted as reduction events (Well et al., 2012).
In addition to the SP vs.δ15Nbulkmaps, SP vs.δ18O maps have been suggested to trace N2O reduction to N2 (Lewicka-Szczebak et al., 2014, 2015; Well et al., 2012). While δ15Nbulkdepends on the isotopic composition of the precur-sor (e.g., NO−
3) and, thus, may vary considerably,δ18O-N2O is expected to be more stable as, during both nitrification and denitrification, oxygen (O) later found in N2O may almost completely originate from water (Kool et al., 2009). Due to this almost complete O exchange with water, relatively sta-bleδ18O in soil water, and the observed constant ratio of frac-tionation factors for SP andδ18O-N2O (rsp-o), variation in the share of N2O reduced to N2should be reflected in a linear
re-lationship between SP andδ18O-N2O with a slope of 0.2–0.5 (Jinuntuya-Nortman et al., 2008; Ostrom et al., 2007; Well and Flessa, 2009a). In this study, a linear relationship with a slope of 1.02 was found (Fig. 7, right panel). Tracking the management events (Mana I to Mana III) and the rewetting event in SP vs.δ18O space revealed that the onset of such an event is associated with a decrease in both SP andδ18O, grad-ually increasing back to approximately initial values, except for Mana II. During Mana II, no significant change in SP vs. δ18O occurred (Fig. 7, right panel, red trace). The gradual in-crease in isotopic composition supports the conclusion from the SP/ δ15Nbulkmap that N2O was mainly produced by bac-terial denitrification and that variations in isotopic composi-tion may have been caused predominately by N2O reduction to N2. This interpretation is in agreement with observations of the isotopic composition of N2O, NO−
3 and NH+4 during a rewetting event in an agricultural field (Decock and Six, 2013a). Additionally,δ18O was found to be positively cor-related withδ15Nbulk, which enforces the interpretation that varying shares of N2O reduction occurred because it acts on both N and O isotopic composition (Koehler et al., 2012).
As stated above, the ratios of fractionation factors forδ18O andδ15Nbulk (ro-n) and SP andδ18O (rsp-o) during N2O re-duction were 2.5 and 0.2 to 0.5 in laboratory incubation ex-periments (Jinuntuya-Nortman et al., 2008; Ostrom et al., 2007; Well and Flessa, 2009a). In our study,ro-n andrsp-o were 0.5 and 1, respectively, for the whole data set. We also calculated these ratios for a subset of data for which all δ values (SP, δ15Nbulk andδ18O) increased for 2 consecu-tive days, indicating that N2O reduction may have occurred. Such events were observed on eight occasions. If source pro-cesses (N2OD, N2ON) contributed constantly over 2 consec-utive measuring days, changes in the isotopic composition of emitted N2O were solely attributed to changes in the fraction of N2O reduction. Under such conditions one would expect that the ratio of the changes inδ18O andδ15Nbulk (ro-n) is around 2.5 and that the ratio of the changes in SP andδ18O (rsp-o) is between 0.2 and 0.5. The mean (median) ratios for ro-n andrsp-ofor these selected events were 0.69 (0.44) and 2.1 (1.16), respectively. While the high values ofrsp-o indi-cate that, for instance, changing physical conditions such as soil moisture may play a role in field measurements, the de-viation ofro-nfrom the value of 2.5 could either indicate that the fractionation factor for18O might be smaller than the one for15N or that there is no correlation of fractionation factors in natural environments. This is in line with recent findings showing that apparent isotope effects associated with N2O reduction are sensitive to experimental conditions which in-fluenced diffusive isotope effects (Lewicka-Szczebak et al., 2014, 2015). The same study also showed that fractionation factors during N2O reduction for 15N and 18O were vari-able (from−11 to+12 ‰ and from−18 to+4 ‰,
measure-ments alone without the knowledge of the isotopic composi-tion of the substrates.
4.5 Controls on isotopic composition and event-based data aggregation
The high temporal resolution of N2O isotopic and auxil-iary measurements allowed us to investigate the controls on N2O isotopic composition over the 3-month campaign pe-riod. Correlations with isotopic composition were highest and positive for DOC and soil temperature (Table 2). The sig-nificant correlation with temperature for the whole campaign was due to a significant correlation during the dry part of the campaign. If the increase in SP was due to an increased con-tribution of nitrification,δ15Nbulkshould decrease due to the higher isotopic fractionation during this process. The simul-taneous increase in SP,δ15Nbulkandδ18O revealed in Fig. 7, however, indicates an increased share of N2O reduction to N2, which might have been triggered by increased substrate availability (DOC) for heterotrophic denitrification. The re-ported effect of temperature on the N2O : N2ratio is not en-tirely certain, but a decrease has been observed with increas-ing temperature, supportincreas-ing the hypothesis that N2O reduc-tion increased as temperature rose throughout the measure-ment period (Saggar et al., 2013).
Though substrate availability has been identified as a ma-jor control on N2O source processes (see references in Sag-gar et al., 2013), correlations between N2O isotopic compo-sition and NO−
3 and NH+4 concentrations were low, except for the correlation withδ15Nbulk. The reason might be both the number of measurement points for substrate concentra-tions being lower compared to other explanatory variables and substrate concentrations not necessarily reflecting pro-cess or turnover rates (Wu et al., 2012).
The low explanatory power of all linear regressions un-derlines that drivers of N2O emissions are highly variable and may even change from event to event. In the absence of management or rewetting events (group BG), isotopic com-position covered the whole range of measured values, while management or rewetting events were characterized by lower variability in isotopic composition. Values for SP, δ15Nbulk and δ18O were low for Mana I, rewetting and Mana III, whereas Mana II showed increased SP,δ15Nbulk andδ18O. This indicates that processes must have been different for Mana II, although management was almost identical.
4.6 Short-term variation in isotopic composition
The Keeling plot approach is based on the conservation of mass and assumes that the atmospheric concentration of a gas in the surface layer is a mixture of background atmo-spheric concentration and a variable amount of gas added by a source, raising the atmospheric concentration above back-ground. The source’s isotope value can be determined, given that its isotope value remains constant during the observation
vigor-ous N2O emission, and therefore may dominate the deter-mined N2O isotopic composition, as the influence of a source area increment scales with the source strength. The grass-land site was restored in 2012, which led to an extraordinar-ily high N2O-N emission of 29.1 kg ha−1year−1(Merbold et al., 2014). In the following year 2.5 kg N2O-N ha−1were re-leased. This value is still in the range of maximum emissions reported for a different intensively managed Swiss grassland site, emitting 1.5–2.6 kg N ha−1year−1, and at least a factor of 5 greater compared to an extensively managed grassland site with less than 0.5 kg N ha−1 year−1 (Ammann et al., 2009). With regard to distant land use and land cover, the 2.5 kg N2O-N is also more than double the median (between the 70th and 75th percentile) of all reported values for cul-tivated temperate sites and is higher than the highest value reported for forests presented in a study containing 1008 N2O emission measurements from agricultural fields (Ste-hfest and Bouwman, 2006). However, the possibility cannot be excluded that the N2O isotopic signatures analyzed above the grassland site were influenced by adjacent ecosystems.
4.7 Flux-weighted averages of source isotopic compositions
N2O isotopic composition can be used to calculate and fur-ther constrain the global N2O budget (Kim and Craig, 1993; Yoshida and Toyoda, 2000). The analysis of emissions from different sources such as agricultural soils or managed grass-land based on box models and isotopic composition is com-plicated by the distinct temporal and spatial variability of isotopic composition (Kim and Craig, 1993; Toyoda et al., 2011; Yoshida and Toyoda, 2000); hence, flux-weighted av-erages are required to obtain representative values for agri-cultural N2O (Perez et al., 2001). Our flux-weighted averages of 6.9±4.3,−17.4±6.2 and 27.4±3.6 ‰ for SP,δ15Nbulk andδ18O are well within the range of the values of 2.9 to 36.6,−41.5 to−1.9 and 23.2 to 51.7 ‰ for agricultural soils
(Park et al., 2011; Toyoda et al., 2011). The comparison with other grassland soils (Opdyke et al., 2009; Park et al., 2011) indicates that the variability of isotopic composition within a group, such as grassland, may be considerable (for SP: 2.2 to 11.1 ‰). One has to keep in mind, however, that part of the observed variability may be attributed to the fact that the footprint area of the N2O isotopic composition includes ar-eas with other land use or land cover. Another part of the variability might also be explained by a limited compatibil-ity of different laboratory results, as recently demonstrated in an inter-laboratory comparison campaign (Mohn et al., 2014). The uncertainty in budgets derived by isotopic com-position depends on the uncertainty of the representative iso-topic composition for a single source, which can be reduced by a quasi-continuous measurement approach, as shown in this study.
5 Conclusions
Our field observations indicate that nitrifier-denitrification and denitrification (process group N2OD) dominated throughout the measurement period and that variation in iso-topic composition was more likely due to variation in the ex-tent of N2O reduction rather than contributions of NH2OH oxidation or fungal denitrification. A high temporal reso-lution of isotopic composition in soil-emitted N2O showed that, at the beginning of the growing season, medium wfps and low temperature induced low isotope values (representa-tive for process group N2OD), whereas in the second part of the measurement period, higher temperature and DOC stim-ulated N2O reduction to N2, although wfps was lower. Man-agement or rewetting events were mostly characterized by low SP,δ15Nbulkandδ18O, but the event Mana II indicated that processes underlying N2O emissions can vary even un-der similar management conditions. With this study, a new method is available that can provide real-time data sets for various individual N2O-emitting (eco)systems, such as grass-land or agricultural soils, which will help in further constrain-ing the global N2O budget based on box model calculations. However, future campaigns should be accompanied by foot-print modeling in order to optimize of the inlet height and associated concentration footprint size.
The Supplement related to this article is available online at doi:10.5194/bg-12-2517-2015-supplement.
Acknowledgements. We are grateful to Hans-Ruedi Wettstein and his team for the collaboration with the ETH research station Chamau and Christoph Zellweger for support with the determi-nation of GHG mixing ratios in our target gases. Antoine Roth is acknowledged for his support during the field campaign. This project was funded by the State Secretariat for Education and Research (SER) within COST Action ES0806. The QCLAS used for EC measurements was funded by the R’Equip Project (206021 133763) of the Swiss National Science Foundation. Funding form GHG-Europe (FP7, EU contract no. 244122) and COST Action ES0804–ABBA is gratefully acknowledged. Instrumental developments at Empa were supported by the Swiss National Science Foundation (SNSF). Technical support on the eddy-covariance station has been provided by Thomas Baur and Peter Plüss. The preparation of N2O isotope standards and inter-laboratory comparison measurements were supported by the EMRP ENV52 project “Metrology for high-impact greenhouse gases”. The EMRP is jointly funded by the EMRP participating countries within EURAMET and the European Union.
References
Ammann, C., Spirig, C., Leifeld, J., and Neftel, A.: Assessment of the nitrogen and carbon budget of two managed temperate grass-land fields, Agr. Ecosyst. Environ., 133, 150–162, 2009. Baggs, E. M.: A review of stable isotope techniques for N2O source
partitioning in soils?: recent progress, remaining challenges and future considerations, Rapid Commun. Mass Spectr., 22, 1664– 1672, 2008.
Baldocchi, D. and Meyers, T.: On using eco-physiological, mi-crometeorological and biogeochemical theory to evaluate carbon dioxide, water vapor and trace gas fluxes over vegetation: a per-spective, Agr.. For. Meteorol., 90, 1–25, 1998.
Bedard-Haughn, A., van Groenigen, J. W., and van Kessel, C.: Trac-ing 15N through landscapes: potential uses and precautions, J. Hydrol., 272, 175–190, 2003.
Butterbach-Bahl, K., Baggs, E. M., Dannenmann, M., Kiese, R., and Zechmeister-Boltenstern, S.: Nitrous oxide emissions from soils: how well do we understand the processes and their con-trols?, Philos. Trans. R. Soc. B-Biological Sci., 368, 20130122, doi:10.1098/rstb.2013.0122, 2013.
Davidson, E. A.: The contribution of manure and fertilizer nitrogen to atmospheric nitrous oxide since 1860, Nat. Geosci., 2, 659– 662, 2009.
Decock, C. and Six, J.: An assessment of N-cycling and sources of N2O during a simulated rain event using natural abundance15N, Agr.., Ecosyst. Environ., 165, 141–150, 2013a.
Decock, C. and Six, J.: How reliable is the intramolecular distribu-tion of15N in N2O to source partition N2O emitted from soil?, Soil Biol. Biochem., 65, 114–127, 2013b.
Eugster, W. and Plüss, P.: A fault-tolerant eddy covariance system for measuring CH4fluxes, Agr. Forest Meteorol., 150, 841–851, 2010.
Griffis, T. J., Zhang, J., Baker, J. M., Kljun, N., and Billmark, K.: Determining carbon isotope signatures from micrometeo-rological measurements: Implications for studying biosphere– atmosphere exchange processes, Bound.-Lay. Meteorol., 123, 295–316, 2007.
Groffman, P. M., Altabet, M. A., Bohlke, J. K., Butterbach-Bahl, K., David, M. B., Firestone, M. K., Giblin, A. E., Kana, T. M., Nielsen, L. P., and Voytek, M. A.: Methods for measuring denitri-fication: Diverse approaches to a difficult problem, Ecol. Appl., 16, 2091–2122, 2006.
Harris, E., Nelson, D. D., Olszewski, W., Zahniser, M., Potter, K. E., McManus, B. J., Whitehill, A., Prinn, R. G., and Ono, S.: Development of a Spectroscopic Technique for Continuous On-line Monitoring of Oxygen and Site-Specific Nitrogen Isotopic Composition of Atmospheric Nitrous Oxide, Anal. Chem., 86, 1726–1734, doi:10.1021/ac403606u, 2014.
Harris, E., Zeyer, K., Kegel, R., Müller, B., Emmenegger, L., and Mohn, J.: Nitrous oxide emissions and isotopic composition from waste incineration in Switzerland, Waste Manag., 35, 135–140, 2015.
Heil, J., Wolf, B., Brüggemann, N., Emmenegger, L., Tuzson, B., Vereecken, H., and Mohn, J.: Site-specific 15N isotopic signa-tures of abiotically produced N2O, Geochim. Cosmochim. Ac., 139, 72–82, 2014.
Jinuntuya-Nortman, M., Sutka, R. L., Ostrom, P. H., Gandhi, H., and Ostrom, N. E.: Isotopologue fractionation during microbial
reduction of N2O within soil mesocosms as a function of water-filled pore space, Soil Biol. Biochem., 40, 2273–2280, 2008. Keeling, C. D.: The concentration and isotopic abundances of
at-mospheric carbon dioxide in rural areas, Geochim. Cosmochim. Ac., 13, 322–334, 1958.
Kim, K. R. and Craig, H.: Nitrogen-15 and oxygen-18 characteris-tics of nitrous oxide: a global perspective, Science, 262, 1855– 1857, 1993.
Koba, K., Osaka, K., Tobari, Y., Toyoda, S., Ohte, N., Katsuyama, M., Suzuki, N., Itoh, M., Yamagishi, H., Kawasaki, M., Kim, S. J., Yoshida, N., and Nakajima, T.: Biogeochemistry of nitrous ox-ide in groundwater in a forested ecosystem elucidated by nitrous oxide isotopomer measurements, Geochim. Cosmochim. Ac., 73, 3115–3133, 2009.
Koehler, B., Corre, M. D., Steger, K., Well, R., Zehe, E., Sueta, J. P., and Veldkamp, E.: An in-depth look into a tropical lowland for-est soil: nitrogen-addition effects on the contents of N2O, CO2 and CH4and N2O isotopic signatures down to 2-m depth, Bio-geochemistry, 111, 695–713, 2012.
Kool, D. M., Wrage, N., Oenema, O., Harris, D., and Van Groeni-gen, J. W.: The18O signature of biogenic nitrous oxide is deter-mined by O exchange with water, Rapid Commun. Mass Spectr., 23, 104–108, 2009.
Köster, J. R., Cárdenas, L., Senbayram, M., Bol, R., Well, R., But-ler, M., Mühling, K. H., and Dittert, K.: Rapid shift from denitri-fication to nitridenitri-fication in soil after biogas residue application as indicated by nitrous oxide isotopomers, Soil Biol. Biochem., 43, 1671–1677, 2011.
Köster, J. R., Well, R., Dittert, K., Giesemann, A., Lewicka-Szczebak, D., Mühling, K.-H., Herrmann, A., Lammel, J., and Senbayram, M.: Soil denitrification potential and its influence on N2O reduction and N2O isotopomer ratios, Rapid Commun. Mass Spectr., 27, 2363–73, 2013a.
Köster, J. R., Well, R., Tuzson, B., Bol, R., Dittert, K., Giesemann, A., Emmenegger, L., Manninen, A., Cárdenas, L., and Mohn, J.: Novel laser spectroscopic technique for continuous analysis of N2O isotopomers–application and intercomparison with isotope ratio mass spectrometry, Rapid Commun. Mass Spectr., 27, 216– 22, 2013b.
Lewicka-Szczebak, D., Well, R., Köster, J. R., Fuß, R., Senbayram, M., Dittert, K., and Flessa, H.: Experimental determinations of isotopic fractionation factors associated with N2O produc-tion and reducproduc-tion during denitrificaproduc-tion in soils, Geochim. Cos-mochim. Ac., 134, 55–73, 2014.
Lewicka-Szczebak, D., Well, R., Bol, R., Gregory, A. S., Matthews, G. P., Misselbrook, T., Whalley, W. R., and Cardenas, L. M.: Iso-tope fractionation factors controlling isotopocule signatures of soil-emitted N2O produced by denitrification processes of vari-ous rates, Rapid Commun. Mass Spectr.., 29, 269–282, 2015. Merbold, L., Eugster, W., Stieger, J., Zahniser, M., Nelson, D., and
Buchmann, N.: Greenhouse gas budget (CO2, CH4and N2O) of intensively managed grassland following restoration, Glob. Change Biol., 20, 1913–1928, 2014.
Mohn, J., Tuzson, B., Manninen, A., Yoshida, N., Toyoda, S., Brand, W. A., and Emmenegger, L.: Site selective real-time measurements of atmospheric N2O isotopomers by laser spec-troscopy, Atmos. Meas. Tech., 5, 1601–1609, doi:10.5194/amt-5-1601-2012, 2012.
Mohn, J., Steinlin, C., Merbold, L., Emmenegger, L., and Hagedorn, F.: N2O emissions and source processes in snow-covered soils in the Swiss Alps, Isotopes Environ. Health Stud., 49, 520–531, 2013.
Mohn, J., Wolf, B., Toyoda, S., Lin, C. T., Liang, C. M., Brügge-mann, N., Wissel, H., Steiker, A. E., Dyckmans, J., Szwek, L., Ostrom, N. E., Casciotti, K. L., Forbes, M., Giesemann, A., Well, R., Doucett, R. R., Yarnes, C. T., Ridley, A. R., Kaiser, J., and Yoshida, N.: Inter-Laboratory assessment of notrous oxide iso-topomer analysis of isoiso-topomer analysis by isotope ratio mass spectrometry and laser spectroscopy: current status and perspec-tives, Rapid Commun. Mass Spectr.., 28, 1995–2007, 2014. Mosier, A., Kroeze, C., Nevison, C., Oenema, O., Seitzinger, S.,
and van Cleemput, O.: Closing the global N2O budget: ni-trous oxide emissions through the agricultural nitrogen cycle – OECD/IPCC/IEA phase II development of IPCC guidelines for national greenhouse gas inventory methodology, Nutr. Cycl. Agroecosys., 52, 225–248, 1998.
Myhre, G., Shindell, D., Bréon, F.-M., Collins, W., Fuglestvedt, J., Huang, J., Koch, D., Lamarque, L., Mendoza, B., Nakaijima, T., Robock, A., Stephens, G., Takemura, T., and Zhang, H.: An-thropogenic and Natural Radiative Forcing, in: Climate Change 2013: The Physical Science Basis. Contribution of Working Group I to the Fifth Assessment Report of the Intergovernmental Panel on Climate Change, edited by: Stocker, T., Qin, D., Plat-tner, G. K., Tignor, M., Allen, S., Boschung, J., Nauels, A., Xia, Y., Bex, V., and Midgley, P., Cambridge University Press, Cam-bridge, UK and New York, NY, USA, 659–740, 2013.
Ogawa, M. and Yoshida, N.: Intramolecular distribution of stable ni-trogen and oxygen isotopes of nitrous oxide emitted during coal combustion, Chemosphere, 61, 877–87, 2005.
Opdyke, M. R., Ostrom, N. E., and Ostrom, P. H.: Evidence for the predominance of denitrification as a source of N2O in temperate agricultural soils based on isotopologue measurements, Global Biogeochem. Cy., 23, GB4018, doi:10.1029/2009GB003523, 2009.
Ostrom, N. E. and Ostrom, P. H.: The Isotopomers of Nitrous Ox-ide: Analytical Considerations and Application to Resolution of Microbial Production Pathways, in: Handbook of Envirionmen-tal Isotope Geochemistry Volume 1, edited by: Baskaran, M., Springer Berlin Heidelberg, Berlin, Heidelberg, 453–476, 2011. Ostrom, N. E., Pitt, A., Sutka, R. L., Ostrom, P. H., Grandy, A. S., Huizinga, K. M., and Robertson, G. P.: Isotopologue effects during N2O reduction in soils and in pure cultures of denitrifiers, J. Geophys. Res., 112, 1–12, 2007.
Ostrom, N. E., Sutka, R. L., Ostrom, P. H., Grandy, A. S., Huizinga, K. M., Gandhi, H., von Fischer, J. C., and Robertson, G. P.: Isotopologue data reveal bacterial denitrification as the primary source of N2O during a high flux event following cultivation of a native temperate grassland, Soil Biol. Biochem., 42, 499–506, 2010.
Park, S., Pérez, T., Boering, K. A., Trumbore, S. E., Gil, J., Mar-quina, S., and Tyler, S. C.: Can N2O stable isotopes and iso-topomers be useful tools to characterize sources and microbial
pathways of N2O production and consumption in tropical soils?, Global Biogeochem. Cy., 25, 1–16, 2011.
Pataki, D., Ehleringer, J., Flanagan, L., Yakir, D., Bowling, D., Still, C., Buchmann, N., Kaplan, J., and Berry, J.: The application and interpretation of Keeling plots in terrestrial carbon cycle research, Global Biogeochem. Cy., 17, 1022, doi:10.1029/2001GB001850, 2003.
Perez, T., Trumbore, S. E., Tyler, S. C., Matson, P. A., Ortiz-Monasterio, I., Rahn, T., and Griffith, D. W. T.: Identifying the agricultural imprint on the global N2O budget using stable iso-topes, J. Geophys. Res., 106, 9869–9878, 2001.
Perez, T., Garcia-Montiel, D. C., Trumbore, S. E., Tyler, S., de Ca-margo, P. B., Moreira, M., Piccolo, M. C., and Cerri, C.: Nitrous Oxide Nitrification and Denitrification15N Enrichment Factros from Amazon Forest Soils, Ecol. Appl., 16, 2153–2167, 2006. Ravishankara, A. R., Daniel, J. S., and Portmann, R. W.: Nitrous
oxide (N2O): the dominant ozone-depleting substance emitted in the 21st century, Science, 80, 123–125, 2009.
Roth, K.: Bodenkartierung und GIS-basierte Kohlenstoffinventur von Graslandböden, University of Zürich (UZH), 132 pp., 2006. Saggar, S., Jha, N., Deslippe, J., Bolan, N. S., Luo, J., Giltrap, D. L., Kim, D.-G., Zaman, M., and Tillman, R. W.: Denitrification and N2O : N2 production in temperate grasslands: processes, mea-surements, modelling and mitigating negative impacts, Sci. Total Environ., 465, 173–195, 2013.
Stehfest, E. and Bouwman, L.: N2O and NO emission from agricul-tural fields and soils under naagricul-tural vegetation: summarizing avail-able measurement data and modeling of global annual emissions, Nutr. Cycl. Agroecosys., 74, 207–228, 2006.
Sutka, R. L., Ostrom, N. E., Ostrom, P. H., Gandhi, H., and Brez-nak, J. A: Nitrogen isotopomer site preference of N2O produced by Nitrosomonas europaea and Methylococcus capsulatus Bath, Rapid Commun. Mass Spectr.., 17, 738–45, 2003.
Sutka, R. L., Ostrom, N. E., Ostrom, P. H., Breznak, J. A., Pitt, A. J., Li, F., and Gandhi, H.: Distinguishing Nitrous Oxide Production from Nitrification and Denitrification on the Basis of Isotopomer Abundances, Appl. Environ. Microbiol., 72, 638–644, 2006. Sutka, R. L., Adams, G. C., Ostrom, N. E., and Ostrom, P. H.:
Iso-topologue fractionation during N2O production by fungal deni-trification, Rapid Commun. Mass Spectr.., 22, 3989–3996, 2008. Syakila, A. and Kroeze, C.: The global nitrous oxide budget
revis-ited, Greenh. Gas Meas. Manag., 1, 17–26, 2011.
Toyoda, S. and Yoshida, N.: Determination of Nitrogen Isotopomers of Nitrous Oxide on a Modified Isotope Ratio Mass Spectrome-ter, Anal. Chem., 71, 4711–4718, 1999.
Toyoda, S., Mutobe, H., Yamagishi, H., Yoshida, N., and Tanji, Y.: Fractionation of N2O isotopomers during production by denitri-fier, Soil Biol. Biochem., 37, 1535–1545, 2005.
Toyoda, S., Yano, M., Nishimura, S., Akiyama, H., Hayakawa, A., Koba, K., Sudo, S., Yagi, K., Makabe, A., Tobari, Y., Ogawa, N. O., Ohkouchi, N., Yamada, K., and Yoshida, N.: Characteriza-tion and producCharacteriza-tion and consumpCharacteriza-tion processes of N2O emitted from temperate agricultural soils determined via isotopomer ratio analysis, Global Biogeochem. Cy., 25, 1–17, 2011.
Tuzson, B., Zeyer, K., Steinbacher, M., McManus, J. B., Nelson, D. D., Zahniser, M. S., and Emmenegger, L.: Selective measure-ments of NO, NO2and NOyin the free troposphere using quan-tum cascade laser spectroscopy, Atmos. Meas. Tech., 6, 927–936, doi:10.5194/amt-6-927-2013, 2013.
Waechter, H., Mohn, J., Tuzson, B., Emmenegger, L., and Sigrist, M. W.: Determination of N2O isotopomers with quantum cas-cade laser based absorption spectroscopy, Opt. Express, 16, 9239–9244, 2008.
Watts, S. H. and Seitzinger, S. P.: Denitrification rates in organic and mineral soils from riparian sites?: a comparison of N2flux and acetylene inhibition methods, Soil Biol. Biochem., 32, 1383– 1392, 2000.
Well, R. and Flessa, H.: Isotopologue enrichment factors of N2O reduction in soils, Rapid Commun. Mass Spectr., 23, 2996–3002, 2009a.
Well, R. and Flessa, H.: Isotopologue signatures of N2O produced by denitrification in soils, J. Geophys. Res., 114, 1–11, 2009b. Well, R., Kurganova, I., Lopesdegerenyu, V., and Flessa, H.:
Iso-topomer signatures of soil-emitted N2O under different moisture conditions – A microcosm study with arable loess soil, Soil Biol. Biochem., 38, 2923–2933, 2006.
Well, R., Flessa, H., Xing, L., Xiaotang, J., and Römheld, V.: Iso-topologue ratios of N2O emitted from microcosms with NH+4 fertilized arable soils under conditions favoring nitrification, Soil Biol. Biochem., 40, 2416–2426, 2008.
Well, R., Eschenbach, W., Flessa, H., von der Heide, C., and Wey-mann, D.: Are dual isotope and isotopomer ratios of N2O use-ful indicators for N2O turnover during denitrification in nitrate-contaminated aquifers?, Geochim. Cosmochim. Ac., 90, 265– 282, 2012.
Wrage, N., Velthof, G. L., van Beusichem, M. L., and Oenema, O.: Role of nitrifier denitrification in the production of nitrous oxide, Soil Biol. Biochem., 33, 1723–1732, 2001.
Wu, H., Dannenmann, M. D., Wolf, B., Han, X. G., Zheng, X., and Butterbach-Bahl, K.: Seasonality of soil microbial nitro-gen turnover in continental steppe soils of Inner Mongolia, Eco-sphere, 3, 34, doi:10.1890/ ES11-00188.1, 2012.
Wunderlin, P., Mohn, J., Joss, A., Emmenegger, L., and Siegrist, H.: Mechanisms of N2O production in biological wastewater treat-ment under nitrifying and denitrifying conditions, Water Res., 46, 1027–37, 2012.
Wunderlin, P., Lehmann, M. F., Siegrist, H., Tuzson, B., Joss, A., Emmenegger, L., and Mohn, J.: Isotope signatures of N2O in a mixed microbial population system: constraints on N2O produc-ing pathways in wastewater treatment, Environ. Sci. Technol., 47, 1339–1348, 2013.
Yamulki, S., Toyoda, S., Yoshida, N., Veldkamp, E., Grant, B., and Bol, R.: Diurnal fluxes and the isotopomer ratios of N2O in a temperate grassland following urine amendment, Rapid Com-mun. Mass Spectr.., 15, 1263–1269, 2001.
Yoshida, N. and Toyoda, S.: Constraining the atmospheric N2O budget from intramolecular site preference in N2O isotopomers, Nature, 405, 330–334, 2000.