NHESSD
2, 1837–1865, 2014Developing an index for heavy convective rainfall over western
Greece
M. Korologou et al.
Title Page
Abstract Introduction
Conclusions References
Tables Figures
◭ ◮
◭ ◮
Back Close
Full Screen / Esc
Printer-friendly Version
Interactive Discussion
Discussion
P
a
per
|
D
iscussion
P
a
per
|
Discussion
P
a
per
|
Discuss
ion
P
a
per
Nat. Hazards Earth Syst. Sci. Discuss., 2, 1837–1865, 2014 www.nat-hazards-earth-syst-sci-discuss.net/2/1837/2014/ doi:10.5194/nhessd-2-1837-2014
© Author(s) 2014. CC Attribution 3.0 License.
Natural Hazards and Earth System Sciences
Open Access
Discussions
This discussion paper is/has been under review for the journal Natural Hazards and Earth System Sciences (NHESS). Please refer to the corresponding final paper in NHESS if available.
Developing an index for heavy convective
rainfall over a Mediterranean coastal area
M. Korologou1, H. Flocas2, and H. Michalopoulou2
1
Hellenic National Meteorological Service, Greece
2
National and Kapodistrian University of Athens, Faculty of Physics, Department of Environmental Physics-Meteorology, Greece
Received: 13 December 2013 – Accepted: 18 January 2014 – Published: 25 February 2014 Correspondence to: M. Korologou ([email protected])
NHESSD
2, 1837–1865, 2014Developing an index for heavy convective rainfall over western
Greece
M. Korologou et al.
Title Page
Abstract Introduction
Conclusions References
Tables Figures
◭ ◮
◭ ◮
Back Close
Full Screen / Esc
Printer-friendly Version
Interactive Discussion
Discussion
P
a
per
|
D
iscussion
P
a
per
|
Discussion
P
a
per
|
Discuss
ion
P
a
per
|
Abstract
Heavy convective rainfall incidents that occurred over western coastal Greece and led to flash floods are analyzed with respect to mesoscale analysis for the period from January 2006 to June 2011. The synoptic scale circulation is examined throughout the troposphere along with satellite images, lightning data and synoptic observations of 5
weather stations. Well known instability indices are calculated and tested against syn-optic observations. Taking into account the severity of the incidents, the performance of the indices was not as good as expected. Further detailed analysis resulted to the development of a new index that incorporates formalized experience of local weather and modeled knowledge of mechanism of severe thunderstorms. The proposed index 10
named Local Instability Index (LII) is then evaluated and its performance is found to be quite satisfactory.
1 Introduction
Thunderstorms accompanied by heavy rainfall often lead to flash flood events with disastrous consequences on the economy, the environment and in some cases have 15
resulted in fatalities. Although the performance of the numerical weather prediction models have been improved, it is always challenging to further study due to their im-pacts.
One of the fundamental conditions for a thunderstorm initiation is the existence of an unstable atmosphere. In order to estimate the instability, thermodynamic indices 20
NHESSD
2, 1837–1865, 2014Developing an index for heavy convective rainfall over western
Greece
M. Korologou et al.
Title Page
Abstract Introduction
Conclusions References
Tables Figures
◭ ◮
◭ ◮
Back Close
Full Screen / Esc
Printer-friendly Version
Interactive Discussion
Discussion
P
a
per
|
D
iscussion
P
a
per
|
Discussion
P
a
per
|
Discuss
ion
P
a
per
Related studies have been carried out for specific regions of Greece with acceptable results (Dalezios and Papamanolis, 1991; Michalopoulou and Karadana, 1996; Sioutas and Flocas, 2003; Chrysoulakis et al., 2006; Marinaki et al., 2006). The main challenge of these studies was the availability and reliability of observation data as the existing radiosonde network is rather insufficient. It has been shown that the performance of the 5
indices depends on the season or even month, the terrain of the area and the type of the thunderstorms (Michalopoulou and Jacovides, 1987; Prezerakos, 1989; Dalezios and Papamanolis, 1991; Haklander and Van Delden, 2003;?).
Western Peloponnese, being washed by the Ionian Sea, is an area that is frequently affected by severe thunderstorms (Maheras and Anagnostopoulou, 2003; Metaxas 10
et al., 1999; Ziakopoulos, 2009; Xoplaki, 2002). However, relevant studies have not been performed so far, mainly due to the luck of radiosondes data. The objective of this study is to examine the thermodynamic environment of severe thunderstorms with respect to heavy rainfall occurring in this area for the period of 1 January 2006 to 30 June 2011. It is proposed an alternative methodological tool for developing a useful and 15
practical index in order to forecast these events without employing radiosondes data, rather other data sources. Using this tool for the examined area, a new index, namely Local Instability Index (LII), was built.
2 Data
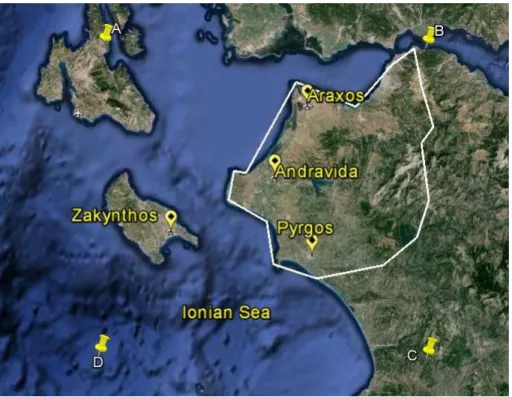
The severe thunderstorms with heavy rainfall occurred in the examined area of north-20
western Peloponnese (see Fig. 1), more specifically over the hydrological basin defined by the rivers Peiros, Parapeiros, Vergas and Pinios (almost 2500 km2) of northwestern Peloponnese (MEECC, 2012) during 1 January 2006 to 30 June 2011 were consid-ered. For this purpose, a mesoscale analysis of the atmosphere with 6 h time step for that period was performed with the aid of datasets of dry and dew point tempera-25
atmo-NHESSD
2, 1837–1865, 2014Developing an index for heavy convective rainfall over western
Greece
M. Korologou et al.
Title Page
Abstract Introduction
Conclusions References
Tables Figures
◭ ◮
◭ ◮
Back Close
Full Screen / Esc
Printer-friendly Version
Interactive Discussion
Discussion
P
a
per
|
D
iscussion
P
a
per
|
Discussion
P
a
per
|
Discuss
ion
P
a
per
|
sphere derived from the archive of Hellenic National Meteorological Service (HNMS) and a re-analysis of 0.125◦ resolution from the European Centre for Medium-Range Weather Forecasts (ECMWF) with the same time step were also employed (Veremei et al., 2013). Additionally, the surface synoptic observations (SYNOP) derived from the stations of Andravida, Araxos, Pyrgos and Zakynthos (see Fig. 1) were employed and 5
merged in 6 h intervals in order to be compatible with the aforementioned time step (i.e. 00:00–6:00, 06:00–12:00, 12:00–18:00, 18:00–24:00).
Missing merged SYNOP were noticed randomly throughout the available dataset, mainly during night hours, weekends and public holidays, representing a percentage of 2.8 %, 3.1 %, 51.2 %, 29.2 % for the stations Andravida, Araxos, Pyrgos and Zakynthos 10
respectively.
For the Dry Temperature, the missing data were classified in three categories. The first category is characterized by observation times at Andravida that there no available observations from the nearby stations, consisting of 9 missing observations. For this category, the Group Method of Data Handling (GMDH) algorithm (Acock and Pachep-15
sky, 2000) was employed with depended variables: the Temperature at 850 hPa (T850)
at the same observation time, the 24 h trend of the T850 before and after the specific time (T8500−T850−24 andT850+24−T8500), the Dry Temperature of the next and of the pre-vious day at the same time (T+24,T−24), the trends of the Dry Temperature from 30 h
before to 6 h before (T−6−T−30) and from 6 h after to 30 h after (T+30−T+6), the 6 hWind
20
Runs at the same time, before 24 h and after 24 h. The accuracy was found to be as high as 88 %. The second category is characterized by observation times at Andravida that there are available observations for the same time from Araxos station, consist-ing of 113 missconsist-ing observations. In this case, the GMDH algorithm was also employed with one more dependent variable, the Dry TemperatureT of this nearby station. The 25
accuracy was found up to 90 %.
NHESSD
2, 1837–1865, 2014Developing an index for heavy convective rainfall over western
Greece
M. Korologou et al.
Title Page
Abstract Introduction
Conclusions References
Tables Figures
◭ ◮
◭ ◮
Back Close
Full Screen / Esc
Printer-friendly Version
Interactive Discussion
Discussion
P
a
per
|
D
iscussion
P
a
per
|
Discussion
P
a
per
|
Discuss
ion
P
a
per
the nearby weather stations when available, the synoptic analysis and the satellite im-ages from the satellite Meteosat-9 and more specifically a combination of the SEVIRI High Resolution Visible channel and the IR10.8 channel with the aid of the CineSat application.
For the surface relative humidity, the 228 missing merged observations were filled 5
with the aid of a qualitative approach, due the nature of this parameter. The subjective estimation was based on succeeding and preceding observations, on observations of the nearby stations, on the synoptic analysis and on Meteosat-9 images (a combination of the SEVIRI IR3.9, IR10.8 and IR12.0 channels).
The amount of precipitation and the duration of each individual thunderstorm led to 10
their intensity determination.
If a thunderstorm occurs in a 6 h interval in at least one of the weather stations with intensity greater than 5 mm min−1for at least 5 min then this interval is defined as interval of severe thunderstorm.
The lightnings data were available for the period 1 June 2008 to 30 June 2011 refer 15
to an area defined by the points with coordinates A(38.33◦N, 20.60◦E), B(38.33◦N, 21.90◦E), C(37.35◦N, 21.90◦E) and D(37.35◦N, 20.60◦E) (Fig. 1). Correspondingly, a 6 h intervals being characterized by more than 10 strokes h−1, were considered as intervals of severe thunderstorms. These records were fused with the synoptic obser-vations. However there were cases with recorded strokes without recorded thunder-20
storms from the synoptic observations. The identification of these cases was further verified with the aid of satellite images (Meteosat-9) as derived from the channel com-bination named Convection RGB (WV6.2 – WV7.3, IR3.9 – IR10.8, NIR1.6 and the VIS0.6 channels).
This analysis showed 508 6 h intervals with thunderstorms events over the exam-25
NHESSD
2, 1837–1865, 2014Developing an index for heavy convective rainfall over western
Greece
M. Korologou et al.
Title Page
Abstract Introduction
Conclusions References
Tables Figures
◭ ◮
◭ ◮
Back Close
Full Screen / Esc
Printer-friendly Version
Interactive Discussion
Discussion
P
a
per
|
D
iscussion
P
a
per
|
Discussion
P
a
per
|
Discuss
ion
P
a
per
|
were excluded from the subsequent analysis. The 143 severe cases occurred from May to October and thus our study became restricted to these.
Due to limited availability of lightnings data, two distinct sub-periods were used. The first period, from 1 May 2006 to 31 October 2007, that is characterised by luck of the lightnings data. The second one, from 1 June 2008 to 30 June 2011, is considered 5
of higher reliability due to the availability of lightnings data. In the first one, 138 6 h intervals of thunderstorms occurred, including 54 severe thunderstorms. In the second period 370 events of thunderstorms were observed, including 89 severe events.
A set of metadata were aggregated from the first period data i.e.
– Veering and backing of winds at surface, 850, 700, 500, 300 hPa 10
– Temperature and Humidity 6 h, 12 h and 24 h trends at surface, 850, 700, 500, 300 hPa (i.e.∆T6h etc)
– Surface Pressure 6 h, 12 h and 24 h trends
– Geopotential Heights trends at 850, 700, 500, 300 hPa
– Thickness for all combinations of the levels surface, 850, 700, 500, 300 hPa 15
– Components that constitute the Instability Indices KI, HI, TTI and SWEAT (i.e. (T−Td)Levelsor sin(wind direction500hPa−wind direction850hPa), etc)
3 Methodology
Available data made feasible the calculation of the thermodynamic instability indices KI, HI, TTI and SWEAT. Due to the fact that these indices refer to a specific geograph-20
NHESSD
2, 1837–1865, 2014Developing an index for heavy convective rainfall over western
Greece
M. Korologou et al.
Title Page
Abstract Introduction
Conclusions References
Tables Figures
◭ ◮
◭ ◮
Back Close
Full Screen / Esc
Printer-friendly Version
Interactive Discussion
Discussion
P
a
per
|
D
iscussion
P
a
per
|
Discussion
P
a
per
|
Discuss
ion
P
a
per
and thus of no practical value. This performance could be attributed to the fact that the indices do not take into account the synoptic scale weather patterns nor the local flows. Therefore the development of a new instability index is imperative.
Severe thunderstorms cannot be modeled and consequently predicted analytically nor synthetically (Holton, 2004). The proposed indices for predicting thunderstorms 5
are hypothesis which had been tested for a specific period and consequently it is pos-sible to be disproved and rejected despite the fact that they are successfully tested for a different period. The validation tests for these indices are performed deductively; the proposed index (consisting actually the hypothesis) and its application constrains are considered as the prerequisite knowledge for prediction of the event; if the predicted 10
event is not manifested, the hypothesis is rejected (Trochim, 2000). From a set of pro-posed indices, the index that is tested more strictly is preferred. It is rational to accept that if there is an effective index, it will be among those who have persisted in criticism and been corroborated.
An index is a successfully tested hypothesis that can be developed from experi-15
ence, literature or theory, or combination of these (Graham et al., 2010). The index that derives from rich explicatory theoretical framework (content) and a consequently deductive hypothesis, incorporates formalized related experience and has performed successfully through strict validation tests, can be conceived that captures important part of the event behavior.
20
In order to state and support the effectiveness of the new index, it is suggested to use two different sets of data. The first for building the hypothesis i.e. to find the patterns and the rules that associate the events with the meteorological parameters for the specific period. The second for testing and evaluate the hypothesis according toModus Tollens rule (Lakatos, 1963). It was preferred to use the first sub-period (1 25
NHESSD
2, 1837–1865, 2014Developing an index for heavy convective rainfall over western
Greece
M. Korologou et al.
Title Page
Abstract Introduction
Conclusions References
Tables Figures
◭ ◮
◭ ◮
Back Close
Full Screen / Esc
Printer-friendly Version
Interactive Discussion
Discussion
P
a
per
|
D
iscussion
P
a
per
|
Discussion
P
a
per
|
Discuss
ion
P
a
per
|
The factors responsible for forming the Index would be inferentially derived from the theoretical and empirical analysis. Data Mining and Optimization techniques are em-ployed to determine the crucial values of these factors and not the factors themselves, since this would led to an index with poor informative content i.e. relations between the event and parameters with no meteorological meaning.
5
In this study it was attempted to automatically extract associations rules and patterns between the events and the data and metadata using the software tools: MATLAB and ARMADA for MATLAB. Data Mining techniques such as Principal Components Analysis, Association Rules and Cluster Analysis were applied to data and metadata. However, no useful result was found, mainly due to the sparseness of the phenomena 10
in question.
Thus, in this study, the described methodological tool ofCombined Hypothesis De-velopment was preferred to be used. The index will have the form of a threshold func-tion that flags or not a warning for an impeded thunderstorm with heavy rainfall. The value of 100 % for the recall of the index will be a major constrain due to the severity of 15
the consequences of the event.
4 Developing the new Local Instability Index (LII)
In this section, the factors accounting for the framework of the index development are depicted and briefly presented along with a specific for the examined area synoptic description.
20
It is well known that a thunderstorm initiation requires the presence of three ingre-dients, namely, energy, moisture and lifting mechanism. Using these ingredients as a guidance, a detailed analysis for the factors that were related to thunderstorms events associated with heavy rainfall was conducted.
These mechanisms are closely related with the synoptic scale circulation over the ex-25
NHESSD
2, 1837–1865, 2014Developing an index for heavy convective rainfall over western
Greece
M. Korologou et al.
Title Page
Abstract Introduction
Conclusions References
Tables Figures
◭ ◮
◭ ◮
Back Close
Full Screen / Esc
Printer-friendly Version
Interactive Discussion
Discussion
P
a
per
|
D
iscussion
P
a
per
|
Discussion
P
a
per
|
Discuss
ion
P
a
per
the warm continent of Europe, they have become dry and warm (Xoplaki, 2002). At the same time, the eastern Mediterranean region is affected by tropical dry and warm air masses (Rodwell and Hoskins, 2001; Hoskins, 1996). Thus, heat is transferred from the warm lower atmosphere layers to the upper layers of the sea, causing the temper-ature of the lower atmosphere to be reduced. These conditions enhance the stability 5
of the atmosphere, often associated with temperature inversion and trapping moisture in the lower layers (from the surface to the 3000–5000 ft), inhibiting conditions of any cyclogenesis or depressions passes.
In late summer and especially during September the polar jet stream is shifted to the south. An atmospheric perturbation may interrupt the equatorial flow of the jet, a part of 10
it usually moves southwards causing a northwesterly flow. Consequently, cyclonic con-ditions are created at the lee side of the Alps (Aebischer and Schär, 1998; Kljun et al., 2000) and the geo-dynamic heights are reduced. The southeastern movement of that part of the jet is usually enhanced by the specific conditions. As the jet gets momentum, it moves further to the south, resulting in further reduction of the geopotential heights 15
and cyclonic conditions over the area of Boot and northern Sidra Sea (Trigo et al., 2001). As a consequence, southwesterly winds gradually prevail over southern Ionian Sea (Brody and Nestor, 1980) enriching even the middle layers of the atmosphere with moisture and reversing the temperature inversion which occurs at the low layers. The examined area is affected by such condition, as the southwestern stream in conjunc-20
tion with local orography accumulates further moisture in the lower atmosphere, while in the meantime the perturbation has moved eastwards bringing cold and dry air mass in the upper layers. The combination of these conditions can be explosive and cause severe storms.
Throughout September and October (9th and 10th month of the year) and when 25
NHESSD
2, 1837–1865, 2014Developing an index for heavy convective rainfall over western
Greece
M. Korologou et al.
Title Page
Abstract Introduction
Conclusions References
Tables Figures
◭ ◮
◭ ◮
Back Close
Full Screen / Esc
Printer-friendly Version
Interactive Discussion
Discussion
P
a
per
|
D
iscussion
P
a
per
|
Discussion
P
a
per
|
Discuss
ion
P
a
per
|
The factors of energy, moisture and lifting are considered as the independent vari-ables of athreshold function that constitute the Local Instability Index (LII) requiring a minimum value for the occurrence of severe thunderstorm.
The analysis was carried out every six hours and consequently the Index provides warning values every six hours lasting for the next 12 h. Due to the severity of the 5
phenomena, it is compulsory for the index to predict all or almost all the phenomena and simultaneously maintain a high and practicable precision.
The estimation of the parameters of the proposed Index was basedonly on the data of the period 1 May 2006 to 31 October 2007. In order to determine the crucial values of the parameters, the linear programming (LP)-based branch-and-bound algorithm of 10
the optimization toolbox of MATLAB (R2010a), bintprog was used. The precision of LII was the objective function to be maximized. The required parameters were the changing variables of the objective function constrained to rational values. Constrain also was the value of recall, set up to 100 %.
4.1 Energy term 15
Instability is a prerequisite for air mass thunderstorms and can be partially indicated by the Convective Available Potential Energy (CAPE) (Moncrieffand Miller, 1976). Al-though CAPE is referring to synoptic scale airmass, it has been shown that CAPE can be used for smaller scale, local weather diagnosis and prediction (Zverev, 1972). CAPE practically defines how strong the updraughts within the thunderstorm potentially are; 20
stronger the updraughts result in heavier rainfalls (Wallace and Hobbs, 2006).
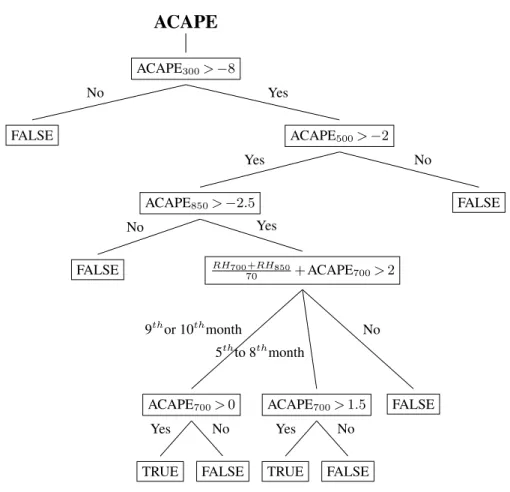
4.1.1 ACAPE term
Using only the data that are available to operational forecasters in their daily duty, the energy term was developed in order to approximate the CAPE. An algorithm in MAT-LAB was built that accepts the Dry Temperatures (T) and the Dew Point (Td) as inputs 25
NHESSD
2, 1837–1865, 2014Developing an index for heavy convective rainfall over western
Greece
M. Korologou et al.
Title Page
Abstract Introduction
Conclusions References
Tables Figures
◭ ◮
◭ ◮
Back Close
Full Screen / Esc
Printer-friendly Version
Interactive Discussion
Discussion
P
a
per
|
D
iscussion
P
a
per
|
Discussion
P
a
per
|
Discuss
ion
P
a
per
and Td (Holton, 2004). The Lifted Condensation Level (LCL) was computed and sim-ulating the wet adiabatic finally computed the Temperature (Tp) of the surface parcel would have if would be raised in the levels of 850, 700, 500 and 300 hPa. The Approx-imated CAPE (ACAPE) is the difference Tp−T and is referring to the four pressure
levels (ACAPE850, ACAPE700, ACAPE500and ACAPE300).
5
ACAPELevel=TpLevel−TLevel (1)
It should be noted that there are a lot of cases of severe thunderstorms with low and sometimes negative CAPE (Curry and Webster, 1999).
Moreover, in the specific case, it can be stated that large amounts of negative ACAPE850is prohibitive for the development of thunderstorm with heavy rainfall
(Pep-10
pler, 1988). This finding can be modeled by requiring ACAPE850≥ −2.5. At the level
of the 700 hPa, the positive energy (ACAPE700>0) is a prerequisite, especially for the
summer period where the geopotential heights are higher and more energy is needed for heavy rainfall to form within the thunderstorm (Bol, 2006). A threshold of 1.5 was noticed for the summer period (ACAPE700>1.5). For the upper levels, the smaller
val-15
ues of ACAPE show that there is a smaller possibility for thunderstorm development. Thresholds of minus 2 and minus 8 were noted for the levels 500 and 300 hPa respec-tively. (ACAPE500>−2, ACAPE300>−8).
4.1.2 Thickness term
The thermal properties of the 850 to 500 hPa atmospheric layer are often better rep-20
resented by the thickness rather than the temperature at a single level (Wallace and Hobbs, 2006). The 850 to 500 hPa thickness is a function of the average temperature and the average moisture content of the air through the specific layer, which are two properties associated with the virtual temperature. Therefore, the specific thickness (between the levelz1(with pressurep1) and the levelz2 (with pressurep2)) is
NHESSD
2, 1837–1865, 2014Developing an index for heavy convective rainfall over western
Greece
M. Korologou et al.
Title Page
Abstract Introduction
Conclusions References
Tables Figures
◭ ◮
◭ ◮
Back Close
Full Screen / Esc
Printer-friendly Version
Interactive Discussion
Discussion
P
a
per
|
D
iscussion
P
a
per
|
Discussion
P
a
per
|
Discuss
ion
P
a
per
|
ated with virtual temperature (Tv), as shown below:
z2−z1=−
RdTv g ·ln
p 2
p1
(2)
The virtual temperature is used for estimating the available convective potential energy and its exclusion may lead to relatively important errors (Doswell and Rasmussen, 1994).
5
CAPE= zLFC
Z
zEL
g·(Tv, parcel
−Tv, env
Tv, env
)d z (3)
where zLFC and zEL are the heights of the levels of free convection and equilibrium
respectively,Tv, parcel is the virtual temperature of the specific parcel,Tv, envis the virtual
temperature of the environment, andgis the acceleration due to gravity.
Consequently, the 850 to 500 hPa thickness effect on CAPE led us to include this 10
indicator in the LII formation. For practical reasons, the thickness seasonality was sub-tracted using the moving average. It has been demonstrated that should be less than 0 for the period from May to August and less than 40 for September and October. The ACAPE and the Thickness Term are represented schematically in the Figs. 2 and 3.
Thus, theEnergy Term (ET)is the conjunction of ACAPE and Thickness Term, i.e. 15
ET :=ACAPE∧Thickness Term. (4)
4.2 Moisture term
According to previous studies (Humphreys, 1926; Showalter and Fulks, 1943; Faw-bush et al., 1951; Appleby, 1954; Whitney and Miller, 1956; Miller, 1967; Schaefer, 1986) the low level moisture is a prerequisite for the thunderstorm initiation and devel-20
NHESSD
2, 1837–1865, 2014Developing an index for heavy convective rainfall over western
Greece
M. Korologou et al.
Title Page
Abstract Introduction
Conclusions References
Tables Figures
◭ ◮
◭ ◮
Back Close
Full Screen / Esc
Printer-friendly Version
Interactive Discussion
Discussion
P
a
per
|
D
iscussion
P
a
per
|
Discussion
P
a
per
|
Discuss
ion
P
a
per
to the lower atmosphere. In the opposite, when mid-level moisture increases then the atmospheric instability can decrease because moist air is less dense and is therefore less able to evaporate precipitation than the drier air. The evaporation of precipitation at or beneath cloud level causes the air-cooling inside precipitation downdrafts making the air denser and increases instability.
5
The minimum amount of moisture that was noticed in the recorded events, expressed in relative humidity term, was 60 % at 850 hPA and 40 % at 700 hPA and 120 % for their sum (see Fig. 4). The aforementioned thresholds are insufficient for heavy rainfall. Although, increasing moisture increases the potentiality for heavy rainfall within the thunderstorm, the moisture in the upper levels may decrease the instability (Bol, 2006) 10
and is not taken into account although it was found that the values of the upper levels were associated with the thunderstorms.
4.3 Terrain heating effect and local features
A lifting force is necessary for a rising parcel of air to overcome the convective inhibition which occurs when a layer of warmer air is above a particular region of air, resulting 15
in the cooler air parcel to be hindered from ascending into the atmosphere (Mapes, 2000). Thus, a temperature inversion is created and therefore a stable region of air. The lift mechanism pushes the cooler parcel of air over the inversion contributing to the thunderstorm development. The main sources of a lift mechanism are associated with terrain features, heating and sea breeze.
20
4.3.1 Terrain heating effect term
NHESSD
2, 1837–1865, 2014Developing an index for heavy convective rainfall over western
Greece
M. Korologou et al.
Title Page
Abstract Introduction
Conclusions References
Tables Figures
◭ ◮
◭ ◮
Back Close
Full Screen / Esc
Printer-friendly Version
Interactive Discussion
Discussion
P
a
per
|
D
iscussion
P
a
per
|
Discussion
P
a
per
|
Discuss
ion
P
a
per
|
heating effect is suggested to be modeled as:
THeat=T0−2T−1+T−2
3 (5)
whereT0,T−1, T−2 are the temperature of the terrain on the specific day, 1 day and
2 days before respectively at the same time. The weight factor for the previous day temperature is set to 2 and for the temperature of 2 days before is set to 1. They are 5
decreasing as the effect decreases with time.
The threshold was estimated to Theat=2 since greater values mean reduced insta-bility. In the cases, where the current is southwesterly, and is consequently supplying to the area, the factor THeat became more ineffective moisture and this can be modeled by subtracting three degrees.
10
4.3.2 Locality term
Apart from the local influences that were modeled within the aforementioned terms, it can be introduced that the dissolving effect of the easterly downdraft current due to the high mountains on the Eastern parts of the area examined.
4.4 The Local Instability Index (LII) 15
Summarizing the above terms, the LII can be considered as the conjunction of the ET (Energy Term), MT (Moisture Term), THeat (Terrain Heating Effect Term) and LT (Locality Term):
LII :=ET∧MT∧THeat∧LT (6)
5 Calculations, evaluation and discussion 20
NHESSD
2, 1837–1865, 2014Developing an index for heavy convective rainfall over western
Greece
M. Korologou et al.
Title Page
Abstract Introduction
Conclusions References
Tables Figures
◭ ◮
◭ ◮
Back Close
Full Screen / Esc
Printer-friendly Version
Interactive Discussion
Discussion
P
a
per
|
D
iscussion
P
a
per
|
Discussion
P
a
per
|
Discuss
ion
P
a
per
the actual number was 54 and all of them were predicted. Although the importance of 100 % recall is controversial, the risk of neglecting a severe thunderstorm warning may prove hazardous, since injuries or fatalities and damages to structures or to the envi-ronment may not be prevented. The LII predicted 1418 no thunderstorm events and the actual number was 1452.
5
The Consistency Table of LII for the specific period is shown in the Table 1 and its performance is described as follows:
– Precision=(the number of the thunderstorms that occurred from those that had been forecasted/the number of the latter)=61 %
– Recall=(the number of the thunderstorms that forecasted from those that had 10
been occurred/the number of the latter)=100 %
– Fall-out=(the number of the cases with no thunderstorms from those that had not been forecasted/the number of the latter)=98 %
The weighted harmonic mean of precision and recall, the traditional F-measure or balanced F-score is:
15
F =2· Precision·Recall
Precision+Recall (7)
resulting inF =76 % and the most adequate measure for the case of severe phenom-ena theF1.2that weights recall as 1,2 times much as precision is:
F1.2=(1+1.22)· Precision·Recall
1.22Precision+Recall (8)
resulting inF1.2=79 % (total performance)
20
NHESSD
2, 1837–1865, 2014Developing an index for heavy convective rainfall over western
Greece
M. Korologou et al.
Title Page
Abstract Introduction
Conclusions References
Tables Figures
◭ ◮
◭ ◮
Back Close
Full Screen / Esc
Printer-friendly Version
Interactive Discussion
Discussion
P
a
per
|
D
iscussion
P
a
per
|
Discussion
P
a
per
|
Discuss
ion
P
a
per
|
number was 2239. The Consistency Table of the LII for the specific period is shown in the Table 2 and its performance is: Precision=55 %, Recall=100 %, Fall-out=97 % The balanced F-score is:F =71 % and the weighted F-score i.e. the total performance is:F1.2=75 %
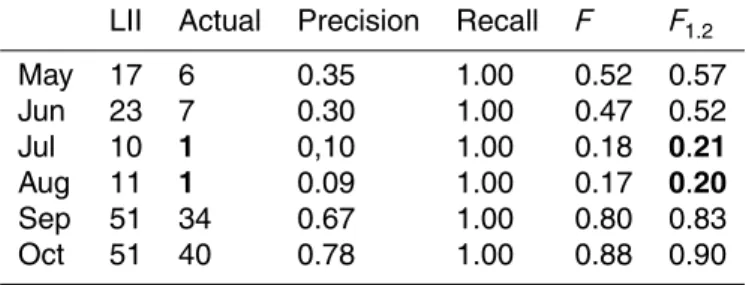
The performance of LII per month is illustrated in Table 3. 5
It is demonstrated that the LII had performed very well for the months May, June, September and October, when unstable weather conditions are more likely to occur. In these cases, most of the thunderstorm events took place during noon or afternoon when the terrain heating effect is stronger. The lower levels of the atmosphere were moist enough and the CAPE was suitable. During July and August of the specific pe-10
riod, only two thunderstorm with heavy rainfall events occurred. This was expected as the atmosphere in the region is generally stable for these months, as was previously explained. Although the performance of LII for July and August is rather low, its use is still beneficial, taking into account the severity of the events and that therecall of the LII is 100 %.
15
6 Conclusions
This study presents an alternative methodological tool for the prediction of severe thun-derstorms occurring over a specific area. The northwestern Peloponnese was chosen to illustrate the proposed tool because many thunderstorms with heavy rainfall have occurred with disastrous impacts.
20
The parameters used were constrained to those that are easily available to oper-ational forecasters while performing their everyday duties. The statistical correlations of the parameters with the observations were examined. In the cases that the correla-tions were not justified by the relative theory, the respective parameters were neglected. Then, the Local Instability Index (LII) was inferentially drawn by using them. The LII is 25
NHESSD
2, 1837–1865, 2014Developing an index for heavy convective rainfall over western
Greece
M. Korologou et al.
Title Page
Abstract Introduction
Conclusions References
Tables Figures
◭ ◮
◭ ◮
Back Close
Full Screen / Esc
Printer-friendly Version
Interactive Discussion
Discussion
P
a
per
|
D
iscussion
P
a
per
|
Discussion
P
a
per
|
Discuss
ion
P
a
per
found that the LII has satisfactory total performance (75 %) over northwestern Pelo-ponnese region for the period from 1 June 2008 to 30 June 2011 and predicted all the thunderstorms with heavy rainfall events (recall=100 %).
The future challenge for further development and optimization of this tool is to exper-iment the LII for a longer period and for hydrological basins all around Greece since in 5
case of good performance, the LII would be at the disposal of operational forecasters of HNMC.
Acknowledgements. We would like to thank the HNMC operational forecasters for their help.
References
Acock, M. C. and Pachepsky, Y. A.: Estimating missing weather data for agricultural simulations
10
using group method of data handling, J. Appl. Meteorol. Clim., 39, 1176–1184, 2000. 1840 Aebischer, U. and Schär, C.: Low-level potential vorticity and cyclogenesis to the lee of the Alps,
J. Atmos. Sci., 55, 186–207, doi:10.1175/1520-0469(1998)055<0186:LLPVAC>2.0.CO;2, 1998. 1845
Appleby, J. F.: Trajectory method of making short-range forecasts of differential temperature
15
advection, instability, and moisture, Mon. Weather Rev., 82, 320–334, 1954. 1848
Bol, A.: Buoyancy and CAPE, Principles of Convection, University Corporation for Atmosspheric Research, available at: http://meted.ucar.edu/mesoprim/cape/print.htm. (last access: 26 Au-gust 2012), 2006. 1847, 1849
Boyden, C. J.: A simple instability index for use as a synoptic parameter, Meteorol. Mag., 92,
20
198–210, 1963. 1838
Branick, M.: NOAA Technical Memorandum NWS SR-145: A Comprehensive Glossary of Weather Terms for Storm Spotters, NOAA/NWS/WFO Norman, 2ed, 1996.
Brody, L. R. and Nestor, M. J. R.: Regional Forecasting Aids for the Mediterranean Basin, Handbook for Forecasters in the Mediterranean, Naval Research Laboratory, Part 2, 1980.
25
1845
Sympo-NHESSD
2, 1837–1865, 2014Developing an index for heavy convective rainfall over western
Greece
M. Korologou et al.
Title Page
Abstract Introduction
Conclusions References
Tables Figures
◭ ◮
◭ ◮
Back Close
Full Screen / Esc
Printer-friendly Version
Interactive Discussion
Discussion
P
a
per
|
D
iscussion
P
a
per
|
Discussion
P
a
per
|
Discuss
ion
P
a
per
|
sium GIS and Remote Sensing: Environmental Applications, Volos, 7–9 November 2003, 155–166, 2006. 1839
Curry, J. A. and Webster, P. J.: Thermodynamics of Atmospheres and Oceans, vol. 65, Interna-tional Geophysics, Academic Press, 1999. 1847
Dalezios, N. R. and Papamanolis, N. K.: Objective assessment of instability indices for opera-tional hail forecasting in Greece, Meteorol. Atmos. Phys., 45, 87–100, 1991. 1839
5
Dimitrovaa, T., Mitzevab, R., and Savtchenko, A.: Environmental conditions responsible for the type of precipitation in summer convective storms over Bulgaria, Atmos. Res., 93, 30–38, 2009. 1842
Doswell III, C. A. and Rasmussen, E. N.: The effect of neglecting the virtual temperature cor-rection on CAPE calculations, Weather Forecast., 9, 625–629, 1994. 1848
10
Fawbush, E. J., Miller, R. C., and Starrett, L. G.: An empirical method for forecasting tornado development, B. Am. Meteorol. Soc., 32, 1–9, 1951. 1848
George, J. J.: Weather forecasting for aeronautics, Q. J. Roy. Meteor. Soc., 87, 15, doi:10.1002/qj.49708737120, 1960. 1838
Graham, I., Shaw, R., Dixon, D. and Jones, J. P., Theorizing Our World, in: Research Methods
15
in Geography, edited by: Gomez, B. and Jones, J. P., 9–25, Blackwell Publishing Ltd, 2010. 1843
Haklander, A. J. and Van Delden, A.: Thunderstorm predictors and their forecast skill for the Netherlands, Atmos. Res., 67–68, 273–299, 2003. 1839
Holton, J. R.: An Introduction to Dynamic Meteorology, 4th edn., Academic Press, 2004. 1843,
20
1847
Hoskins, B. J.: On the existence and strength of the summer subtropical anticyclones – Bern-hard Haurwitz memorial lecture, B. Am. Meteorol. Soc., 77, 1287–1292, 1996. 1845
Humphreys, W. J.: The tornado, Mon. Weather Rev., 54, 501–503, 1926. 1848
Jacovides, C. P. and Yonetani, T.: An evaluation of stability indices for thunderstorm prediction
25
in Greater Cyprus, Weather Forecast., 5, 559–569, 1990. 1838
Jefferson, G. J.: A modified instability index, Meteorol. Mag., 92, 92–96, 1963a. 1838
Jefferson, G. J.: A further development of the instability index, Meteorol. Mag., 92, 313–316, 1963b. 1838
Kessler, E.: Thunderstorm Morphology and Dynamics, University of Oklahoma Press, 1983.
30
NHESSD
2, 1837–1865, 2014Developing an index for heavy convective rainfall over western
Greece
M. Korologou et al.
Title Page
Abstract Introduction
Conclusions References
Tables Figures
◭ ◮
◭ ◮
Back Close
Full Screen / Esc
Printer-friendly Version
Interactive Discussion
Discussion
P
a
per
|
D
iscussion
P
a
per
|
Discussion
P
a
per
|
Discuss
ion
P
a
per
Kljun, N., Sprenger, M., and Schär, C.: Frontal modification and lee cyclogenesis in the Alps: a case study using the ALPEX reanalysis data set, Meteorol. Atmos. Phys., 78, 89–105, doi:10.1007/s007030170008, 2000 1845
Lakatos, I.: Proofs and refutations: the logic of mathematical discovery, Cambridge; New York: Cambridge University Press, 1976. 1843
Litynska, Z., Parfiniewicz, J., and Pinkowski, H.: The prediction of air mass thunderstorms and
5
hails, WMO Bulletin, 450, 128–130, 1976. 1838
Maheras, P. and Anagnostopoulou, C.: Circulation types and their influence on the interannual variability and precipitation changes in Greece, in: Mediterranean Climate-Variability and Trends, Springer Verlag, Berlin, Heidelberg, 215–239, 2003. 1839
Mapes, B. E.: Convective inhibition, subgrid-scale triggering energy, and stratiform instability in
10
a toy tropical wave mode, J. Atmos. Sci., 57, 1515–1535, 2000. 1849
Marinaki, A., Spiliotopoulos, M., and Michalopoulou, H.: Evaluation of atmospheric instability indices in Greece, Adv. Geosci., 7, 131–135, doi:10.5194/adgeo-7-131-2006, 2006. 1839, 1842
Metaxas, D. A., Philandras, C. M., Nastos, P. T., and Repapis, C. C.: Variability of precipitation
15
pattern in Greece during the year, Fresen. Environ. Bull., 8, 1–6, 1999. 1839
Michalopoulou, H. and Jacovides, C. P.: Instability indices for the Cyprus area, Meteorol. Atmos. Phys., 37, 153–157, 1987. 1839
Michalopoulou, H. and Karadana, E.: A review of instability indices for the greater area of Athens, 3rd Hellenic Conference on Meteorological and Atmospheric Physics, 193–198,
20
1996 (in Greek). 1839
Miller, R. C.: Notes on the analysis and severe storm forecasting procedures of the Military Weather Warning Center, Tech. Report 200, AWS, USAF, [Headquarters, AWS, Scott AFB, IL 62225], 1967. 1838, 1848
Ministry of Environment, Energy and Climate Change: Synoptic Description of the Hydrological
25
Basin of Northern Peloponnese. Available at: http://wfd.opengov.gr/index.php?option=com_ content\&task=view\&id=25\&Itemid=12 (Accessed: 15 June 2012), 2012. 1839
Moncrieff, M. W. and Miller, M. J.: The dynamics and simulation of tropical cumulonimbus and squall lines, Q. J. Roy. Meteor. Soc., 120, 373–94, 1976. 1846
Peppler, P. A.: A Review of Static Stability Indices and related Thermodynamic Parameters,
30
NHESSD
2, 1837–1865, 2014Developing an index for heavy convective rainfall over western
Greece
M. Korologou et al.
Title Page
Abstract Introduction
Conclusions References
Tables Figures
◭ ◮
◭ ◮
Back Close
Full Screen / Esc
Printer-friendly Version
Interactive Discussion
Discussion
P
a
per
|
D
iscussion
P
a
per
|
Discussion
P
a
per
|
Discuss
ion
P
a
per
|
Peppler, R. A. and Lamb, P. J.: Tropospheric static stability and central North American growing season rainfall, Mon. Weather Rev., 117, 1156–1180, 1989. 1838
Petrou, C., Mavroudakis, T., and Giannopoulos, P.: Verification of extreme weather phenomena in HELLAS, The European Forecaster Newsletter of WGCEF, 14, 22–23, 2009. 1842 Prezerakos, N. G.: An investigation into the conditions in which airmass thunderstorms occur
at Athens, Meteorol. Mag., 118, 31–36, 1989. 1839
5
Reuter, G. W. and Aktary, N.: A slantwise Showalter index based on moist symmetric instability: results for Central Alberta, Atmos. Ocean, 31, 379–394, 1993. 1838
Rodwell, M. J. and Hoskins, B. J.: Subtropical anticyclones and summer monsoons, J. Climate, 14, 3192–3211, 2001. 1845
Schaefer, J. T.: Severe thunderstorm forecasting: a historical perspective, Weather Forecast.,
10
1, 164–189, 1986. 1848
Showalter, A. K.: A stability index for thunderstorms forecasting, B. Am. Meteorol. Soc., 34, 250–252, 1953. 1838
Showalter, A. K. and Fulks, J. R.: Preliminary report on tornadoes, US Dept. of Commerce, Weather Bureau, No. 806, 162 pp.,1943. 1848
15
Sioutas, M. V. and Flocas, H. A.: Hailstorms in northern Greece: synoptic patterns and thermo-dynamic environment, Theor. Appl. Climatol., 75, 189–202, 2003. 1839
Tian, B. and Fan, K.: Factors favorable to frequent extreme precipitation in the upper Yangtze River Valley, Meteorol. Atmos. Phys., 121, 189–197, 2013. 1838
Trigo, I. F., Bigg, G. R., and Davies, T. D.: Climatology of cyclogenesis mechanisms in the
20
Mediterranean, Mon. Weather Rev., 130, 549–569, 2001. 1845
Trochim, W.: The Research Methods Knowledge Base, 2nd edn., Atomic Dog Publishing, Cincinnati, OH, 2000. 1843
Tyagi, B., Krishna, V. N., and Satyanarayana, A. N. V.: Study of thermodynamic indices in fore-casting pre-monsoon thunderstorms over Kolkata during STORM pilot phase 2006–2008,
25
Nat. Hazards, 56, 681–698, 2011.
Veremei, N. E., Dovgalyuk, Yu. A., Efimov, S. V., Nosova, A. M., and Pechenkin, A. A.: Studying the showers and thunderstorms on the territory of Russia using the numerical model of convective cloud and the reanalysis data, Russ. Meteorol. Hydrol., 38, 20–27, 2013. 1840 Wallace, J. M. and Hobbs, P. V.: Atmospheric Science, 2nd edn., Academic Press, 2006. 1846,
30
NHESSD
2, 1837–1865, 2014Developing an index for heavy convective rainfall over western
Greece
M. Korologou et al.
Title Page
Abstract Introduction
Conclusions References
Tables Figures
◭ ◮
◭ ◮
Back Close
Full Screen / Esc
Printer-friendly Version
Interactive Discussion
Discussion
P
a
per
|
D
iscussion
P
a
per
|
Discussion
P
a
per
|
Discuss
ion
P
a
per
Whitney Jr., L. F. and Miller, J. E.: Destabilization by differential advection in the tornado situa-tion 8 June 1953, B. Am. Meteorol. Soc., 37, 224–229, 1956. 1848
Xoplaki, E.: Climate variability over the Mediterranean, Inauguraldissertation der
Philosophisch-515
naturwissenschaftlichen Fakultät der Universität Bern, 2002. 1839, 1845
Ziakopoulos, D.: Weather, The Son of the Earth and the Sun (Forecast), Artio stamp epe, 2009 (in Greek). 1839
Zverev, A. S.: Practical Work in Synoptic Meteorology, 1st edn., Hydrometeorological Publishing House, 1972. 1846
NHESSD
2, 1837–1865, 2014Developing an index for heavy convective rainfall over western
Greece
M. Korologou et al.
Title Page
Abstract Introduction
Conclusions References
Tables Figures
◭ ◮
◭ ◮
Back Close
Full Screen / Esc
Printer-friendly Version
Interactive Discussion
Discussion
P
a
per
|
D
iscussion
P
a
per
|
Discussion
P
a
per
|
Discuss
ion
P
a
per
|
Table 1.LII – Consistency table for the period 1 May 2006 to 31 Oct 2007. Observation
NHESSD
2, 1837–1865, 2014Developing an index for heavy convective rainfall over western
Greece
M. Korologou et al.
Title Page
Abstract Introduction
Conclusions References
Tables Figures
◭ ◮
◭ ◮
Back Close
Full Screen / Esc
Printer-friendly Version
Interactive Discussion
Discussion
P
a
per
|
D
iscussion
P
a
per
|
Discussion
P
a
per
|
Discuss
ion
P
a
per
Table 2.LII – Consistency table for the period 1 Jun 2008 to 30 Jun 2011. Observation
NHESSD
2, 1837–1865, 2014Developing an index for heavy convective rainfall over western
Greece
M. Korologou et al.
Title Page
Abstract Introduction
Conclusions References
Tables Figures
◭ ◮
◭ ◮
Back Close
Full Screen / Esc
Printer-friendly Version
Interactive Discussion
Discussion
P
a
per
|
D
iscussion
P
a
per
|
Discussion
P
a
per
|
Discuss
ion
P
a
per
|
Table 3.LII – Monthly performance for the period 1 Jun 2008 to 30 Jun 2011. LII Actual Precision Recall F F1.2
NHESSD
2, 1837–1865, 2014Developing an index for heavy convective rainfall over western
Greece
M. Korologou et al.
Title Page
Abstract Introduction
Conclusions References
Tables Figures
◭ ◮
◭ ◮
Back Close
Full Screen / Esc
Printer-friendly Version
Interactive Discussion
Discussion
P
a
per
|
D
iscussion
P
a
per
|
Discussion
P
a
per
|
Discuss
ion
P
a
per
|
ACAPE
ACAPE300>−8
ACAPE500>−2
FALSE ACAPE850>−2.5
RH700+RH850
70 +ACAPE700>2
FALSE ACAPE700>1.5
FALSE TRUE
Yes No ACAPE700>0
FALSE TRUE
Yes No 9thor 10thmonth
5thto 8thmonth
No FALSE
No Yes
Yes No
FALSE
No Yes
NHESSD
2, 1837–1865, 2014Developing an index for heavy convective rainfall over western
Greece
M. Korologou et al.
Title Page
Abstract Introduction
Conclusions References
Tables Figures
◭ ◮
◭ ◮
Back Close
Full Screen / Esc
Printer-friendly Version
Interactive Discussion
Discussion
P
a
per
|
D
iscussion
P
a
per
|
Discussion
P
a
per
|
Discuss
ion
P
a
per
Thickness Term
T H
−
Seasonality <
0
FALSE
TRUE
Yes
No
T H
−
Seasonality <
40
FALSE
TRUE
Yes
No
9
thor 10
thmonth
5
thto 8
thmonth
NHESSD
2, 1837–1865, 2014Developing an index for heavy convective rainfall over western
Greece
M. Korologou et al.
Title Page
Abstract Introduction
Conclusions References
Tables Figures
◭ ◮
◭ ◮
Back Close
Full Screen / Esc
Printer-friendly Version
Interactive Discussion
Discussion
P
a
per
|
D
iscussion
P
a
per
|
Discussion
P
a
per
|
Discuss
ion
P
a
per
|
Moisture Term
RH
700≥
40
RH
850≥
60
FALSE
RH
700+
RH
850≥
120
FALSE
TRUE
Yes
No
Yes
No
FALSE
No
Yes
NHESSD
2, 1837–1865, 2014Developing an index for heavy convective rainfall over western
Greece
M. Korologou et al.
Title Page
Abstract Introduction
Conclusions References
Tables Figures
◭ ◮
◭ ◮
Back Close
Full Screen / Esc
Printer-friendly Version
Interactive Discussion
Discussion
P
a
per
|
D
iscussion
P
a
per
|
Discussion
P
a
per
|
Discuss
ion
P
a
per
Terrain Heating Effect Term
T Heat
≤
2
W dir
500∈
(180
0,270
0)
FALSE
T Heat
≤
5
FALSE
TRUE
Yes
No
Yes
No
TRUE
Yes
No
NHESSD
2, 1837–1865, 2014Developing an index for heavy convective rainfall over western
Greece
M. Korologou et al.
Title Page
Abstract Introduction
Conclusions References
Tables Figures
◭ ◮
◭ ◮
Back Close
Full Screen / Esc
Printer-friendly Version
Interactive Discussion
Discussion
P
a
per
|
D
iscussion
P
a
per
|
Discussion
P
a
per
|
Discuss
ion
P
a
per
|