Stability indicating RP-HPLC method for
the estimation of Decitabine in bulk drug
and lipid based Nanoparticles
Yub Raj Neupane, Manish Srivastava, Nafees Ahmad, Kriti Soni, & Kanchan Kohli*
Department of Pharmaceutics, Faculty of Pharmacy, Hamdard University, New Delhi-110062
Tel.: +91 11 26059688
E-mail address: [email protected]
ABSTRACT:
Purpose: The aim of our present work was to develop and validate a reverse phase high-performance liquid chromatography (RP-HPLC) method for the determination of Decitabine (DCB). The developed method was further applied to observe the degradation of DCB under various stress conditions. Methods: Chromatographic separation was achieved on C18, 250 × 4.6 mm, particle size 5 μm, Agilent column, using ammonium acetate (0.01M) as mobile phase with flow rate of 1mL/min and injection volume was 20 µL. Quantification was carried out with UV detector at 230 nm with a linear calibration curve in the concentration range of 10–100 μg/mL based on peak area. Thus, developed method was validated for linearity, accuracy, precision, and robustness. Results: Linearity was found to be in the range between 10–100 μg/mL with a significantly higher value of correlation coefficient r2 = 0.9994. The limits of detection (LOD) and the limits of quantification (LOQ) were found to be 1.92µg/mL and 5.82 µg/mL respectively. Moreover, validated method was applied to study the degradation profile of DCB under various stress degradation conditions. Examination of different stress conditions on degradation of DCB showed that its degradation was highly susceptible to oxidative condition as 31.24% of drug was degraded. In acidic and alkaline conditions, the drug was degraded by 21.03% and 12.16% respectively, while thermal and photolytic condition causes least degradation, i.e. 0.21% and 0.3% respectively. Conclusion: The proposed method was found to be sensitive, specific and was successfully applied for the estimation of DCB in bulk drug, and lipid based nanoparticles.
KEYWORDS: Decitabine, ICH guidelines,Lipid based nanoparticles, RP-HPLC,Stress degradation studies.
Running Head: RP-HPLC method for the determination of Decitabine
INTRODUCTION:
Chemically, DCB is (4-amino-1-(2-deoxy-β-D-erythro-pentofuranosyl)-1, 3, 5triazin 2 (1H)-one), which was first synthesized in early 1960s and is an analogue of natural nucleoside 2′-deoxycytidine (Fig. 1) [1, 2]. It is off white solid crystalline powder having molecular formula of C8H12N4O4 with a molecular weight of 228.21
Dalton and is available in the market under the brand-name DecogenTM (Eisai, Tokyo, Japan). It was first approved for the treatment of patients with myelodysplastic (MDS) syndrome in the United States in May, 2006 [3].
Figure 1. Chemical structure of Decitabine.
approach to determine its degradation pathway by applying different stress conditions to predict its interim stability profile.
DCB a novel drug which is used to treat all types of MDS. There are very few analytical methods have been described for its determination. Among them, a capillary electrophoresis method has been used for the determination of half-life of the DCB in neutral aqueous solution [6].
From the extensive review of the literatures, there is no official method for the stability study of the DCB has been found. As per ICH guidelines, the drug should not be degraded more than 5% of the initial value during shelf life [7]. The stability indicating assay method provides wide knowledge about the degradation profile of the drug. Degradation of the active compound and also its degraded products can be monitored from this study, which could help in the determination of the possible degradation pathways [8]. Any chemical moieties to be formulated into suitable dosage should have prior knowledge about its stability in various stress conditions to make sure that the drug is stable during its transport and storage conditions as well as its absorption from the gastrointestinal tract.
ICH Q1A R2 provides detailed information about the stability testing of the drug and their products along with their validation of the analytical test procedures [9]. Degradation studies help in the determination of degraded products under stress conditions and help in determining the degradation pathways, and developing suitable analytical procedure [10, 11].
Therefore, objective of this study was to develop and validate RP-HPLC method for the determine DCB in bulk drug as well as in lipid based nanoparticles. Moreover, the proposed method was also applied for the stress degradation studies of the DCB under various stress conditions.
MATERIAL AND METHODS: Materials
DCB was kindly donated by Dabur Research Foundation, New Delhi, India and certified to contain (99.89% purity). The other reagents used were of analytical grade. HPLC grade water (LiChrosolv®, Merck, Mumbai, India), Ammonium acetate (Merck, Mumbai, India), Sodium bisulfite (Merck, Mumbai, India), Methanol HPLC Grade (SRL, Mumbai, India) and Ethanol (Merck, Mumbai, India) were used.
Solution preparations
Preparation of mobile phase (0.01M Ammonium acetate):
An accurately weighed amount 0.7708 g of ammonium acetate was dissolved into l000 mL of HPLC grade water and filtered through a 0.25 µm (Axiva Sichem Biotech, New Delhi, India) nylon membrane filter.
Preparation of diluents:
An accurately weighed amount 5.208 g of sodium bisulphite was dissolved into l000 mL of HPLC grade water and solution pH was further adjusted to 2.5 ± 0.05 with dilute 0.1M sulphuric acid solution. Finally, the solution was filtered through a 0.25 um nylon membrane filter.
Preparation of diluted standard solution:
25 mg of DCB working standard was dissolved by sonication into 10 mL of diluent and then further, an appropriate dilution was made with diluent to get a standard solution having a known concentration of about l00 µg/mL.
Chromatographic conditions
A HPLC system (Shimadzu, Japan; Binary pump) connected with UV detector was used for this study. An analytical column of C18, 250 × 4.6 mm, particle size 5 μm, (Agilent, Switzerland) was used for separation of DCB. Raw data and chromatograms were obtained using Class-VP software. Ammonium acetate (0.01 M) was used as mobile phase with flow rate of 1mL/min and injection volume was 20 µL. The detection of DCB was made at wavelength of 230 nm.
Calibration curve of DCB
Primary stock solution was prepared by dissolving 25 mg of DCB in 10 mL of diluent as sodium bisulfite solution and sonicated to dissolve. Then, an appropriate dilution was made to have 10 working solutions ranging between 10-100 μg/mL and injected to the HPLC system.
Method validation Linearity
Accuracy
The accuracy of an analytical procedure was expressed as the trueness of the measured value with an accepted reference value and value found. The accuracy was performed by an assay method. It was performed by adding the known quantity of the sample and analyzed by the proposed method. At each level, six determinations were done for three different samples.
Precision
The precision of an analytical procedure is expressed as a degree of agreement between a series of measurements obtained from multiple samples of the same homogeneous sample under prescribed conditions. It should be investigated using the homogenous sample. It was determined by the repeatability of the sample application and measurement of the peak areas for replicate samples of the same concentration. Replicate analysis of the sample of DCB was performed on the same day for the determination of intra-day accuracy and precision. Inter-day analysis was done on three batches at different days. The precision of an analytical procedure was expressed as the % relative standard deviation (%RSD). Method repeatability was obtained from %RSD value by repeating the assay six times in the same day for day precision. The inter-day and intra-day variation for the determination of DCB was carried out at six different concentration levels (10, 20, 30, 40, 50, 60 µg/mL), respectively.
Detection and quantification limits
Limit of detection (LOD) of an analytical procedure is its ability to determine the lowest amount of an analyte in a sample which can be detected but not necessarily quantities as an exact value. Limit of quantification (LOQ) of an analytical procedure is its ability to quantify the lowest amount of an analyte in a sample which can be quantitatively determined in the sample with suitable accuracy and precision. LOQ is a parameter of quantitative assays for low levels of the compound in the sample. The limit of detection (LOD) and limit of quantification (LOQ) can be determined on the basis of signal to noise ratio (S/N) of 3 and 10. Quantitatively, it is determined by using standard deviation of the response and the slope, where, LOD=3*S.D./S and LOQ=10*S.D./S where, S.D. is the standard deviation of the response, and S is the slope of the calibration curve.
Robustness of the method
The robustness of an analytical procedure is the reliability of an analysis with respect to deliberate variations in method parameters. The parameters included variation of mobile phase composition, flow rate, column temperature, different columns, and influence of variations of pH in a mobile phase, change in detection wavelength. Robustness of the proposed method was estimated by changing mobile phase composition concentration, changing the flow rate from 1.0 ± 0.1 mL/min, changing the column brand, changing the temperature (±5°C) and changing the wavelength (230±5 nm).
Effect of relative humidity on the degradation of DCB in the powdered state
An accurately weighed 200 mg of DCB was placed in different open glass vials. The filled vials were kept at different relative humidities (RH) (0, 30, 50, and 75%) and control temperature of 40°C. Saturated salt solutions were used to provide different RH. The content of drug was determined at 1, 2, 3, and 6 months. The drug content was also determined before storage using HPLC method and considered as a control (100%).
Effect of temperature on the degradation of DCB in the powdered state
200 mg of powdered DCB accurately weighed and placed in different open glass vials and stored at 0% RH and various temperatures (5, 25, 40, and 50°C) in dark room. Drug content was determined after 1, 2, 3, and 6 months and percentage of drug content before storage were also determined using HPLC method and considered as control (100%).
Stress degradation studies of DCB in the powdered state
Stress degradation studies of the drug substance can help to identify the likely degradaded products. It is carried out to elucidate the inherent stability characteristics of the active substance and help to establish the degradation pathways [12]. It also validates the stability indicating power of the analytical procedures used. However, it may not be necessary to examine specifically for certain degradation products if it has been demonstrated that they are not formed under accelerated or long term storage conditions. It is further stated that the testing should include the effect of pH on hydrolysis of the drug, effect of temperature, effect of humidity, oxidation, photolysis, and aqueous hydrolysis. For this study weighed amount of the DCB was treated with different stress conditions and analyzed by HPLC using above procedure. Sample preparation was done as follows:
Control sample preparation
Acidic degradation (0.1 N HCL, 2 h at RT):
An accurately weighed amount 10.61 mg of DCB was kept in 1 mL of 0.1N HCL into a 10 mL volumetric flask. It was kept at room temperature for 2 h, and volume was made up with diluent.
Alkaline degradation (0.001 N NaOH, 2 h at RT):
An accurately weighed amount 10.40 mg of DCB was mixed with 1 mL of 0.001N NaOH into 10 mL volumetric flask. It was kept at room temperature for 2 h, and volume was made up with diluent.
Oxidative degradation (3% v/v H2O2):
A solution of DCB (10.80 mg) and 1 mL of 3%v/v H2O2 into 10 mL volumetric flask heated at 50°C for 45
min, cooled and diluted to volume with diluent.
Water degradation (RT for 1 hr):
10.89 mg of DCB was added to 1 mL of HPLC grade water into 10 mL volumetric flask, placed at room temperature for 1 h, and diluted to volume with diluent.
Thermal degradation (105°C-24 h):
Weigh accurately about 10.67 mg of thermally degraded DCB into 10 mL volumetric flask, 2mL of diluents was added, sonicated to dissolve, and diluted to volume with diluents.
Preparation of UV exposed sample:
Weigh accurately about 10.72 mg of UV exposed DCB (254nm for 48 h) was mixed with 2 mL of diluent into 10 mL volumetric flask, sonicated to dissolve, diluted to volume with diluent and mixed well.
Preparation of UV unexposed sample (dark control sample):
Accurately weighed 10.55 mg of dark control DCB with 2 mL of diluent into a 10 mL volumetric flask sonicated to dissolve, diluted to volume with diluent and mixed well.
Single injection of all sample solutions of DCB under applied stress conditions injected and % degradations of DCB in each sample were determined by using the following formula:
% Degradation= % Purity in the control sample - % Purity in the degradation sample × 100 % Purity in the control sample
Determination of DCB in lipid based nanoparticles:
The amount of the drug present in the DCB loaded lipid based nanoparticles was also determined using above proposed HPLC method [13] in our previous published research article. The amount of the drug present in the weighed amount of the lipid based nanoparticles was determined by dissolving the optimized nanoparticles in a measured volume of ethanol and stirred by the vortex mixer. The solution was further diluted with diluents to get in the proper concentration range, filtered through the 0.25 µm membrane filter and then analyzed by using the above-described HPLC method.
RESULTS AND DISCUSSION: Method validation
Linearity
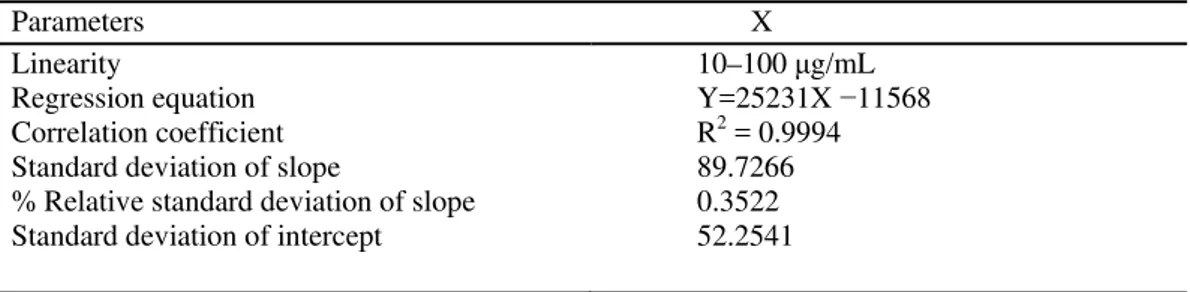
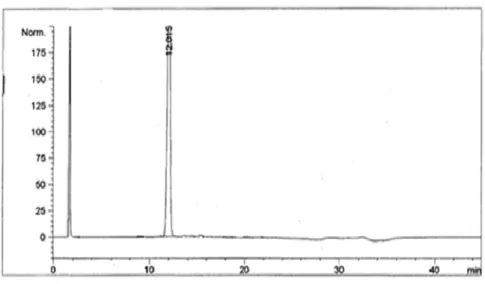
Linearity of DCB for the proposed method was established by least squares regression analysis of the calibration curve. The calibration curve for the method was obtained in the range between 10–100 ug/mL with Regression equation Y = 25231X −11568 and Correlation coefficient R2 = 0.9994. All other parameters are given in the (Table 1). The standard chromatogram of the sample is shown in Fig. 2.
List of Tables
Table 1. Statistical data of calibration curves of Decitabine
Parameters X
Linearity
Regression equation Correlation coefficient Standard deviation of slope
% Relative standard deviation of slope Standard deviation of intercept
Figure 2. Typical HPLC chromatogram of Decitabine sample.
Accuracy
Accuracy as the recovery studies were carried out to ensure the reliability and accuracy of the method. It was carried out by adding the known quantity of the DCB in solvent, and the contents were analyzed by using the same method as described above. Accuracy as the recovery of the sample was evaluated by injecting three different concentrations at six times by adding a known amount of drug to known concentration and calculating the % recovery of drug for each concentration. The results obtained are summarized in the (Table 2) as the accuracy of the drug assay determined at concentration of 30, 40 and 50 μg/mL. The accuracy calculated as mean percent recovery was in the range of 99.88–100.4%.
Table 2. Recovery studies of Decitabine.
Amount present (μg/mL) Amount found* % Recovery * ± SD
30 40 50
30.12 100.4±0.54 40.03 100.07±0.43 49.94 99.88±0.72
*Mean of six values. RSD, Relative standard deviation
Precision
Precision of the system was done by the repeatability of the sample application and measurement of the response for replicate samples of the same concentration. For determining the intra-day precision, a replicate analysis of samples of DCB was performed on the same day. The run consisted of a calibration curve, and five replicates of each concentration sample. The inter-day accuracy and precision were assessed by analysis of three batches on different days. The precision was expressed as the % RSD. The obtained results for inter-day and intra-day precision are summarized in the (Table 3).
Table 3. Precision studies of Decitabine
Concentration
(µg/ml) Inter-day
Observed concentration*
%RSD Intra-day %RSD
10 10.28 20 20.35 30 30.29 40 40.98 50 50.21 60 60.25
0.215 10.34 0.321
0.371 20.25 0.243
0.242 30.12 0.175
0.534 40.03 0.112
0.211 49.94 0.674
0.213 60.12 0.103
Detection and quantification limits
The limit of detection (LOD) and limit of quantification (LOQ) were separately determined by using standard deviation of the response and the slope, where, LOD=3*S.D./S and LOQ=10*S.D./S where, S.D. is the standard deviation of the response, and S is the slope of the calibration curve. The result of LOD and LOQ were found to be 1.92 µg/mL and 5.82 µg/mL respectively.
Robustness of the method
Robustness of the proposed method was estimated by changing the various parameters such as changing mobile phase composition, mobile phase concentration, flow rate of the mobile phase, temperature of the system and wavelength for detection. The concentration of mobile was increased by 20% and 40% by adding ammonium acetate in the solution, composition was changed by mixing 10% of methanol in the mobile phase, different column brand has used, flow rate of the mobile phase was changed from 1.0±0.1 mL/min, temperature of the system was changed (±5°C) and changed the wave length to (230±5 nm). System suitability parameters were found to be within acceptable limits except change in the concentration of mobile phase by 40% concentration, which showed an increase in the retention time. Results obtained from robustness studies were summarized the in (Table 4), with low % RSD, indicates that the test method was robust for all variable conditions except change in mobile phase by 40% concentration of ammonium acetate. Hence, it showed that the method was sufficiently robust for given chromatographic conditions.
Table 4. Results of Robustness of the Method (n=3)
Parameter Modification Retention
time
USP Tailing factor
%RSD
Mobile phase concentration Mobile Phase concentration Flow rate
Wave length Wave length Temperature
+ 20% + 40% 0.1 ml/min 235nm 225nm 5°C
13.77 17.84 12.76 12.67 12.43 12.93
0.356 0.475 0.289 0.134 0.145 0.267
0.31 0.59 0.657 0.212 0.223 0.283
Effect of relative humidity on the degradation of DCB in the powdered state
From the studies of the effect of relative humidity on DCB shows that the drug is sensitive to the higher percentage of the relative humidity where it showed maximum degradation at 75% of relative humidity on a storage period of 6 months. At the low level of humidity drug is not much sensitive to it. It showed that relative humidity can significantly accelerate the degradation of the drug in the powered state. When the percentage of relative humidity gets an increase as with time the amount of drug remained in the powder form gets decreased, which showed the drug gets degraded in the humid condition. (Fig. 3) showed the comparison studies of effect of various relative humidities on DCB.
Effect of temperature on the degradation of DCB in the powdered state
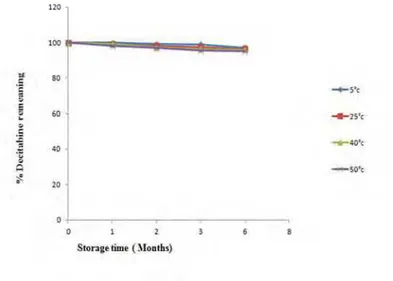
DCB found to be stable in various temperature conditions during storage period up to 3rd month at low temperature but it gets degraded in very small quantity at higher temperature of 50ºC after 3rd month of storage period. It was found that drug is more stable in different temperature conditions in comparison with relative humidity. At very high temperature of 105ºC was also applied to the drug for short period of time in stress degradation studies and there also it was found to be stable with only 0.21% gets degraded. (Fig. 4) showed the comparison studies of effect of various temperature conditions on DCB.
Figure 4. Stability of Decitabine at 0% RH and different temperature level (n = 3).
Stress degradation studies DCB in the powdered state
Table 5. Results of stress degradation studies
Sample ID Condition Chromatographic Purity (% Area) of Decitabine
% Degradation with respect to % area of control
Control sample N/A 99.71 … Acidic
Degradation
0.1N HCI RT-2 hrs 78.74 21.03
Alkaline Degradation.
0.01N NaOH /RT- 2 min 87.55 12.16 31.24 Oxidation
Degradation
3.0%v/v H2O2 Heat at
50°C-45 min
68.47
Water Degradation
RT- 1 hr 95.18 4.43
Photolytic Degradation
UV 254 nm 48 hrs 99.68 0.03
Thermal Degradation
105°C/24 hrs 99.50 0.21
CONCLUSION:
As there is no proper method of analysis available for the determination of DCB reported yet, therefore, the described RP-HPLC method for the determination of DCB is rapid, specific, sensitive, accurate, and reproducible. This method was successfully applied for the estimation of DCB in lipid based nanoparticles. Furthermore, the same method was also applied in the stress degradation studies of DCB in various stress conditions such as acidic, alkaline, oxidative, hydrolytic, thermal, and photolytic degradation. The results from this study indicate that oxidation may be the predominant pathway of drug degradation followed by acidic degradation and alkaline degradation where it showed stability in thermal and photolytic degradation. However, estimation of degraded product by LC/MS and NMR are highly encouraged.
ACKNOWLEDGEMENTS
The Authors wish to express their appreciation to Dabur Research Foundation, India for proving drug as free sample.
DECLARATION OF INTEREST
The authors report no conflicts of interest
REFERENCES:
[1] Cashen A F, Shah A K, Todt L, Fisher N, DiPersio J. Pharmacokinetics of decitabine administered as a 3-h infusion to patients
with acute myeloid leukemia (AML) or myelodysplastic syndrome (MDS). Cancer. Chemother. Pharmacol., 2008, 61, 759–766.
[2] Gore S D, Jones C, Kirkpatrick P. Analysis | myelodysplastic syndromes. Nat. Rev. Drug Discov., 2006, 5, 891-892.
[3] DACOGEN® (decitabine) NDA 021790/S-010 FDA ODAC Briefing Document, Eisai Inc. 2012;
http://www.fda.gov/downloads/AdvisoryCommittees/CommitteesMeetingMaterials/Drugs/OncologicDrugsAdvisoryCommittee/UCM 290512.pdf
[4] Liu D. Recent advances in myelodysplasia: update from 2011 ASH annual meeting. J. Hemat. Oncolo., 2012, 5(S1):A4.
[5] Garcia J S, Jain N, Godley A L. An update on the safety and efficacy of decitabine in the treatment of myelodysplastic syndromes.
Onco. Targets Ther., 2010, 3, 1–13.
[6] Stresemann C, Lyko F. Modes of action of the DNA methyltransferase inhibitors azacytidine and decitabine. Int. J. Cancer., 2008,
123, 8–13.
[7] Stability testing of new drug substances and products. ICH Expert Working Group. Available at:
http://www.ich.org/LOB/media/MEDIA419.pdf. Accessed on 2nd November 2007.
[8] Parmar N, Amin S, Singla N, Kohli K. The solution, solid state stability and kinetic investigation in degradation studies of
lercanidipine: study of excipients compatibility of lercanidipine. Pharm. Dev. Technol., 2011, 17(6), 730-740.
[9] ICH-Q1A (R2), stability testing of new substances and products. International Conference on Harmonization, Geneva. 2003.
http://www.ich.org/cache/compo/363-272-j.htm-Q1A (R2).
[10] Reynolds D W, Facchine K L, Mullaney J F, Alsante K M, Hatajik T D, Motto M G. Available guidance and best practices for
conducting forced degradation studies. Pharm. Technol., 2002, 26, 48–56.
[11] Bakshi M, Singh S. Development of validated stability indicating assay methods–critical review. J. Pharm. Biomed. Anal., 2002, 28,
1011–1040.
[12] Srivastava M, Kohli K, Ali M. Stability Indicating RP-HPLC Method for Analysis of Ketoprofen in Bulk Drug and Eugenol
Containing Nanoemulsion Gel (NEG) Formulation Using Response Surface Methodology, Current Pharm. Anal., 2014, 10: 135–144.
[13] Neupane Y R, MD Sabir, Ahmad N, Ali M, Kohli K. Lipid drug conjugate nanoparticle as a novel lipid nanocarrier for the oral
delivery of DCB: ex vivo gut permeation studies. Nanotechnology., 2013, 24(41) –415102.
[14] Rao BM, Sangaraju S, Srinivasu M K, Madhavan P, Devi M L, Kumar P R, Chandrasekhar K B, Arpitha C, Balaji T S.