Article
Printed in Brazil - ©2017 Sociedade Brasileira de Química0103 - 5053 $6.00+0.00
*e-mail: [email protected]
Development and Validation of a Stability-Indicating Method for Perillyl Alcohol Incorporated
in Poly(lactide-
co
-glycolide) Nanoparticles and Stress Degradation Studies
Breno M. Marson,a Raquel O. Vilhena,a Flavia L. D. Pontes,a Najeh M. Khalilb and
Roberto Pontarolo*,a
aDepartamento de Farmácia, Universidade Federal do Paraná (UFPR),
80210-170 Curitiba-PR, Brazil
bDepartamento de Farmácia, Universidade Estadual do Centro-Oeste (UNICENTRO),
85040-080 Guarapuava-PR, Brazil
Perillyl alcohol has been studied in the treatment of cancer disease. However, its high toxicity is a drawback, which can be overcome by its incorporation in nanostructured systems. The aim of this work was to develop and validate a chromatographic method for determination of perillyl alcohol encapsulation efficiency in a polymeric nanoparticles formulation and evaluation of the presence of related degradation products. Perillyl alcohol was subjected to forced conditions of hydrolysis (acidic, alkaline and neutral), oxidation, photolysis and thermal stress, as suggested in the International Conference of Harmonization (ICH) guidelines. The drug showed significant degradation under acidic conditions. The degradation products could be adequately separated on an XBridge C18 column (100 × 2.1 mm, 3.5 µm) using isocratic elution (350 µL min−1) of water/ acetonitrile (65 : 35, v/v) at 210 nm. Data from validation studies demonstrated that the method is selective, linear (coefficient of determination (r2) > 0.999) over the range of 20.0-80.0 µg mL−1, precise (relative standard deviation (RSD) < 2.0%), accurate (98.07 to 101.99%) and robust for minor changes. The method was successfully applied to determine the encapsulation efficiency of perillyl alcohol in polymeric nanoparticles, both for product development and for quality control purposes. After nanoparticles production, the presence of degradation products was not observed indicating that the single-emulsion solvent-evaporation technique used does not favor chemical degradation of the drug.
Keywords: perillyl alcohol, stability-indicating, validation, nanoparticles, degradation products
Introduction
Perillyl alcohol (POH; IUPAC name: [4-(prop-1-en-2-yl) cyclohex-1-en-yl]methanol; C10H16O; MW: 152.2344 Da;
Figure 1) is a naturally occurring cyclic monoterpene found in essential oils of plants and citrus fruits, derived from the mevalonate pathway.1,2 Medical interest in this compound
has been generated by several researches showing that POH has been able to demonstrate activity against a variety of tumor models, such as adenocarcinoma, brain, breast, colon, gliomas, leukemic cells, liver, lung, pancreas, prostate and skin.2-7 However, the results of phase I and II clinical trials
showed nausea, vomiting and loose stools identified as common toxicities with rare leukocytosis, thrombocytosis, lethargy, renal tubular degeneration with elevated serum creatinine and gastritis.8-10
Chemotherapeutic agents harm healthy tissues, leading to systemic toxicity and adverse effects that greatly limit the maximum tolerated dose of anti-cancer drugs and thus restrict their therapeutic efficacy.11 One
alternative to overcome these problems is the use of polymeric nanoparticles, which are defined as particulate dispersions or solid particles with a size in the range of 10-1000 nm. Poly(lactic-co-glycolic acid) (PLGA) is one of the most successfully developed biodegradable polymers and has attracted considerable attention due to its attractive properties, such as its low risk of toxicity, high biodegradability and biocompatibility, protection of molecules from premature degradation, improvement
of solubility, promotion of controlled drug release and drug targeting. Furthermore, when a drug is loaded into nanostructures the pharmacokinetic parameters are modified, providing improvements in absorption, bioavailability, plasma circulation time and reduction of clearance, consequently increasing the drug’s mean half-life.11-17
The physico-chemical characterization of drug carriers is highly important, and the determination of drug content is especially complex due to the small size and difficulty in separation of free and loaded drug. A technique which has been used to assay drug loading and determination of encapsulation efficiency is the analysis of the clear supernatant following separation of the nanoparticles from the aqueous medium by a centrifugation technique. The drug content in nanoparticles can be calculated by the difference between the total and free estimated drug concentrations.18
The literature reports few methods for determination of POH from different sample types. The most common technique used is the gas chromatography coupled to mass spectrometry (GC-MS) for both biological matrices such as plasma and urine, and non-biological matrices such as the volatile fraction of plant extracts.19-24 Methods by
liquid chromatography (LC) techniques are also described in the literature, such as liquid chromatography-diode array detection (LC-DAD),25-29 liquid
chromatography-electrochemical detection (LC-ECD)30 and liquid
chromatography-fluorescence detection (LC-FLD).31 These
papers are devoted to describing chromatographic methods for analytical and bioanalytical quantification of POH, and none of these cases comprise a degradation behavior study. Forced degradation studies allow the identification of factors that affect drug stability and allow the selection of suitable storage and handling conditions. Furthermore, they can provide information about specificity for adequate method development.
As the nanoparticles used in this study were obtained by the single-emulsion solvent-evaporation technique, with emulsification by ultrasonication and organic solvent elimination by evaporation under vacuum and temperature, the assessment of degradation behavior is crucial for the method development. Furthermore, since the production of such nanoparticles involves conditions that are not very mild, such as ultrasound and temperature, the availability of an analytical method capable of identifying degradation can provide relevant information about the production process. Thus, the aim of this work was to develop and validate a stability-indicating method by LC-DAD, suitable for quantifying POH in polymeric nanostructures, both for product development and for
quality control purposes. The present study was carried out to report the degradation products of the drug formed under International Conference on Harmonization (ICH)-recommended stress conditions of hydrolysis, oxidation, humidity, dry heat and photolysis.32,33
Experimental
Chemicals and reagents
POH (> 96.0%) was obtained from Sigma-Aldrich (St. Louis, MO, USA). Acetonitrile and methanol, HPLC grade, were purchased from Tedia (Fairfield, OH, USA). Ultrapure water was obtained using a Milli-Q purification system from Millipore (Bedford, MA, USA). PLGA (Resomer RG 50 : 50 H; MW ca. 40-75 kDa, inherent viscosity 0.45-0.6 dL g−1) and polyvinyl alcohol (PVA,
MW ca. 31 kDa, 88% hydrolyzed) were obtained from Sigma-Aldrich (St. Louis, MO, USA). Methylene chloride was obtained from Dinâmica (São Paulo, SP, Brazil). Hydrochloric acid (36.5-38%) was obtained from Mallinckrodt Baker (Ecatepec de Morelos, Méx, México). Sodium hydroxide (99%) was obtained from Merck KGaA (Darmstadt, Hesse, Germany). Hydrogen peroxide (30%) was obtained from Labsynth (São Paulo, SP, Brazil).
Apparatus and software
LC-DAD analyses were carried out in an Agilent 1100 HPLC Series (Agilent Technologies, Santa Clara, CA, USA), with a quaternary pump (G1311A), degasser (G1379A), thermostated column oven (G1316A), ALS autosampler manager (G1329A) and diode array detector (G1315B). The chromatographic system was operated using ChemStation for LC 3D system software (B.04.03 (16)). Analyses were performed at 25 °C on an XBridge C18 column (100 × 2.1 mm, 3.5 µm; Waters, Milford, MA, USA) coupled with an XBridge C18 guard column (10 × 2.1 mm, 3.5 µm; Waters, Milford, MA). The mobile phase used was a water/acetonitrile mixture (65 : 35, v/v). The isocratic flow rate was 350 µL min−1, the injection volume was 20 µL and
Stock and working standard solutions
A stock solution of POH (10 mg mL−1) was prepared
in methanol, and transferred to individual glass flasks protected from light and stored under refrigeration (storage at 2-8 °C, for 30 days). The working standard solutions were prepared in appropriate concentrations by dilution of the stock solution in the mobile phase under low light exposure and filtered through a polyvinylidene fluoride (PVDF) syringe filter (13 mm diameter, 0.22 µm pore size; Millipore Millex, Billerica, MA, USA) prior to injection.
Forced degradation studies
In order to develop a stability-indicating method, a forced degradation study was conducted with POH under various stress conditions.32 From the POH stock solution,
intermediate solutions (1 mg mL−1) were prepared and
submitted individually to different stress conditions. After exposure the intermediate solutions were diluted to target concentrations of 200 µg mL−1 in the mobile phase under
low light exposure (except photodegradation) and filtered through a PVDF syringe filter (13 mm diameter, 0.22 µm pore size; Millipore Millex, Billerica, MA, USA) prior to injection.
For acidic degradation conditions, intermediate solutions were kept in 1 mol L−1 HCl at room temperature
for 36 h and neutralized (pH 7.4) before analysis by adding an appropriate amount of NaOH (1 mol L−1). For
alkaline degradation conditions, intermediate solution was kept in 1 mol L−1 NaOH at room temperature for
36 h and neutralized (pH 7.4) before analysis by adding an appropriate amount of HCl (1 mol L−1). Oxidative
degradation was performed by keeping the intermediate solution with 15% hydrogen peroxide at room temperature for 36 h. The dry heat degradation study was done by keeping the intermediate solution diluted in methanol (amber flask without headspace) in an oven at 60 °C for 7 days. The thermal humidity degradation study was done by keeping the intermediate solution diluted in a methanol/ water mixture (1 : 1, v/v) (amber flask without headspace) in an oven at 60 °C for 7 days. The photodegradation study was done by exposing the intermediate solution diluted in methanol (transparent flask without headspace) to 1.2 × 10⁶ lx h of fluorescent light and 200 W h m−2 UV light
in a photostability chamber.
Nanoparticles and sample preparation
The nanoparticles were obtained by the single-emulsion solvent-evaporation technique, as described in
the literature.34 Briefly, POH (10 mg) and PLGA (25 mg)
were separately dissolved in 1.0 and 0.5 mL of methylene chloride, respectively, at room temperature. This organic phase was rapidly poured into 5 mL of PVA aqueous solution (1.0%, m/v) and emulsified by sonication for three cycles of 2 min (Unique® Ultrasonic Mixing, Brazil),
resulting in an oil-in-water (O/W) emulsion. After that, the organic solvent was immediately eliminated by evaporation under vacuum (10 min at 37 °C). The nanoparticles were recovered by centrifugation (14,857 × g, 30 min, 4 °C; Eppendorf Centrifuge 5810 R, Germany), then the recovered nanoparticles were washed twice with water using previously described centrifugation. Supernatants were mixed and stored for posterior analysis.
The amount of POH incorporated into the nanoparticles was determined by analysis of the clear supernatant following separation of the nanoparticles from the aqueous medium by a centrifugation technique previously described. The supernatant was diluted with mobile phase to a final volume of 10 mL and was subjected to ultrasonic bath for 5 min. Then diluted to appropriate concentration by dilution in the mobile phase, under low light exposure, and filtered through a PVDF syringe filter (13 mm diameter, 0.22 µm pore size; Millipore Millex, Billerica, MA, USA) prior to injection.
Analytical method validation
Validation was performed in accordance with the ICH for quantitative methods, considering the following parameters: selectivity, linearity, accuracy, precision and robustness.35 The selectivity of the chromatographic
method was evaluated by comparing the chromatograms of matrix components (nanoparticles excipients), degradation products and sample diluent with the response obtained for POH. The ability of the method in discriminate POH, even in the presence of possible interferences, was evaluated by demonstrating that for the same POH retention time there was no coelution of any other component. The peak purity for POH was assessed with a photodiode array detector. Additionally, selectivity was evaluated by comparing the slopes of two analytical curves. An analytical curve obtained with the standard solution was compared with another analytical curve obtained with the diluted samples spiked with the analyte, at the same concentrations used to prepare the first curve. These curves were prepared in triplicate at concentrations ranging from 20 to 80 µg mL−1
by three calibration curves at seven different concentrations (20.0, 30.0, 40.0, 50.0, 60.0, 70.0 and 80.0 µg mL−1) after
proper dilution of the stock solution. The slope, intercept and coefficient of determination (r2) were calculated
by linear regression performed on the concentration vs. peak area using the least squares method. The accuracy was determined as the recovery by the standard addition method. Nine preparations at three levels around the specification target (POH, 20.0, 50.0 and 80.0 µg mL−1)
were analyzed, three preparations per level. Samples were prepared at 30% of the target analyte concentration and analyzed to confirm the actual values, and then they were spiked with the standard solution. The percentage recovery was calculated and the relationship between the average concentration determined experimentally, and the equivalent theoretical concentration was determined. The precision was determined at two levels: intra-day and inter-day. The intra-day precision was determined by analyzing nine preparations at three levels around the specification target (POH, 20.0, 50.0 and 80.0 µg mL−1),
three preparations per level. All solutions were prepared by the same analyst under identical experimental conditions on the same day. The inter-day precision was performed by analyzing nine new POH solutions in the same way as for intra-day precision, but prepared by a second analyst, after two days. The results are expressed as the relative standard deviation (RSD), and Student’s t-test was performed to compare the results of the analytes in each assay. The robustness was evaluated by changing the experimental conditions to analyze POH solutions with identical concentration (20.0 µg mL−1). The parameters were varied:
isocratic flow (340 to 360 µL min−1), temperature (23 and
28 °C), mobile phase composition ratio (± 2%) and two different columns. The results were evaluated as percentage recovery and RSD, when compared to the normal conditions. Furthermore, the POH purity peak and resolution between POH and degradation peaks were evaluated. Stability studies for POH included evaluation of sample (stored in sample manager at 20 °C for 12 h), and evaluation of stock standard solution (stored at 2-8 °C for 7, 14 and 30 days). Student’s t-test was performed to compare the results of freshly prepared sample and standard solutions with those obtained after storage in different conditions.
Results and Discussion
Preliminary tests were conducted to select an initial LC method. Several trials were conducted with different isocratic or gradient mobile phases containing different solvent, stationary phase, particle size, column temperature and detection wavelength. Parameters such as elution time,
asymmetry, tailing factor and plate number were adjusted for the proposed preliminary LC method and the selected column was an XBridge C18 (100 × 2.1 mm, 3.5 µm). Since there are no reports about POH degradation behavior in the literature to support the initial tests and the goal of this study was to get primary degradations, it was decided to start with mild forced degradation conditions, such as: acidic, 0.1 mol L−1 HCl; alkaline, 0.1 mol L−1 NaOH; oxidative, 3%
hydrogen peroxide; dry heat, 40 °C; thermal humidity, room temperature; photodegradation, 1.2 × 10⁶ lx h fluorescent
light and 200 W h m−2 UV light. As POH is liquid, viscous
and volatile at room temperature, the study was conducted from POH stock solution by preparing intermediate solutions, at 1 mg mL−1, that were submitted individually to
different stress conditions. After each stress time exposure the intermediate solutions were diluted to analytical concentration. This way allowed more precision in sample taking, facilitating comparisons between peak areas and chromatographic profile of the same stress conditions, apart from lower control sample preparations. The intermediate solution volumes were designed to enable several dilutions, and allowed the evaluation of different exposure times. Once the analytical solutions were obtained by dilution of intermediate solutions, it was possible to neutralize the acidic and alkaline conditions. Besides, this procedure provided the dilution of stressing agents such as hydrogen peroxide, for example. The blanks of each condition were prepared in the same way, including dilutions and neutralizing steps. Even after 10 days of exposure to mild forced degradation conditions, no degradation or decay of active pharmaceutical ingredient (API) was observed. Based on the preliminary results, it was decided to increase the intensity of the stress conditions, passing to: acidic, 1 mol L−1 HCl; alkaline, 1 mol L−1 NaOH; oxidative, 15%
hydrogen peroxide; dry heat, 60 °C; thermal humidity, 60 °C. For photodegradation conditions an increase in exposure was not considered because this is already the upper limit used to perform photodegradation stability studies.36 After 36 h of exposure, all samples showed
some degradation and decay of the POH peak area. The degradation profiles of acidic and alkaline conditions are presented in Figure 2, including blank and final time. Stress acidic conditions presented four degradation products (DP1, DP3, DP4 and DP5). Stress alkaline conditions presented two degradation products (DP2 and DP3). The degradation product identified as DP3 was also observed in the oxidative, dry heat and thermal humidity conditions. The degradation product identified as DP5 was also observed in the oxidative and dry heat stress conditions.
below 10% without degradation peaks may suggest analytical variation, and values above 25% with degradation peaks may be related to the appearance of secondary degradation, which is not interesting. The exposure solutions were compared with the blanks for same exposure period, contributing to the preview of peak degradation.
After getting the primary degradations, the following step was to obtain an LC method to achieve good separation between POH and its degradation products. In this phase, several trials were conducted with different gradient mobile phases (containing acetonitrile or methanol and water). Methanol and acetonitrile showed good elution profiles with sharp and symmetrical peaks; however, acetonitrile : water
produced a larger resolution than methanol : water. Furthermore, acetonitrile had a lower absorbance than methanol, especially for shorter wavelengths. The mobile phase containing a mixture of water : acetonitrile (65 : 35, v/v) was found to be the most reliable at a flow rate of 350 µL min−1. The elution was isocratic, providing
greater reproducibility of the chromatographic parameters, such as capacity factor and resolution, between runs of same set of samples and among different sets of samples. Furthermore, in this case the use of elution gradient did not show advantageous since the total running time, including the time spent with the phase rebalance for the next run, was greater than that observed for isocratic elution. No further improvement in the analyte peaks was observed according to the oven column temperatures tested (25, 30 and 40 °C), thus the column temperature was kept at 25 °C. The injection volume that provided the best result was 20 µL; lower values of injection volume decreased the signal to noise ratio and higher values contributed to broadening in the peaks. The chromatographic resolution was a choice factor for chromatographic conditions, resolution greater than 1.5 between adjacent peaks being considered as an acceptable value. The POH peak purity was also evaluated with a value greater than 0.990 being considered as acceptable. Under these chromatographic conditions, the obtained chromatograms were found to be quite sharp and well separated with a retention time of 5.6 min for POH.
Through the forced degradation study it was possible to optimize the separation of POH from its degradation products. However, it is also essential that sample preparation could be able to differentiate the encapsulated drug from the non-encapsulated drug. Nanoparticles are colloidal systems and in the case of encapsulation efficiency measured indirectly, may occur a wrong estimation due to incomplete separation of free drug present in supernatant from the nanoparticles. In this work it was evaluated a procedure similar to already reported in literature.37,38
To ensure that free drug was completely separated by centrifugation, the supernatants obtained after each water wash step were analyzed separately. For this, each fraction was diluted with mobile phase to final volume of 10 mL and was subjected to ultrasonic bath for 5 min, then diluted to appropriate concentration by dilution with mobile phase and filtered through a PVDF syringe filter (13 mm diameter, 0.22 µm pore size; Millipore Millex, Billerica, MA, USA) prior to injection. The first cleanup fraction showed very low amount of POH, whilst in the second one, the presence of POH signal on HPLC was no longer observed. This evaluation was determined in triplicate and based on results it was considered sufficient for the
complete separation of nanoparticles from free drug. So, to encapsulation efficiency test, the clear supernatant for assay was defined as a mixture of the three supernatants fractions, as described in sample preparation. In order to confirm the concentration of POH observed to the clear supernatant, the nanoparticles recovery by centrifugation were also analyzed. They were diluted in 2 mL of acetonitrile and subjected to ultrasonic bath for 5 min. Then this solution was diluted to appropriate concentration by dilution with mobile phase and filtered through a PVDF syringe filter (13 mm diameter, 0.22 µm pore size; Millipore Millex, Billerica, MA, USA) prior to injection. Acetonitrile was chosen because it is already used in the mobile phase and also because there have been reports in the literature confirming the solubility of polymer in this solvent.39,40
The sum of the results observed for the clear supernatant and recovered nanoparticles coincide with the theoretical value used in the formulation, indicating that in this case the indirect determination through the clear supernatant can be used to quantify the encapsulation efficiency. Since there is not consumption of nanoparticles by indirect determination, this procedure was chosen as a way to improve the yield of nanoparticles per batch.
Analytical validation parameters were assessed in order to evaluate the methodology developed here. The interference of the matrix components and degradation products was examined in the selectivity. By visual
inspection no interferences were observed at the same retention time as the analyte of interest. The POH peak purity was assessed for all solutions forced to degradation showing values higher than 0.990, as shown in Table 1. The resolution between POH and adjacent degradation peaks was higher than 2 (Table 1).
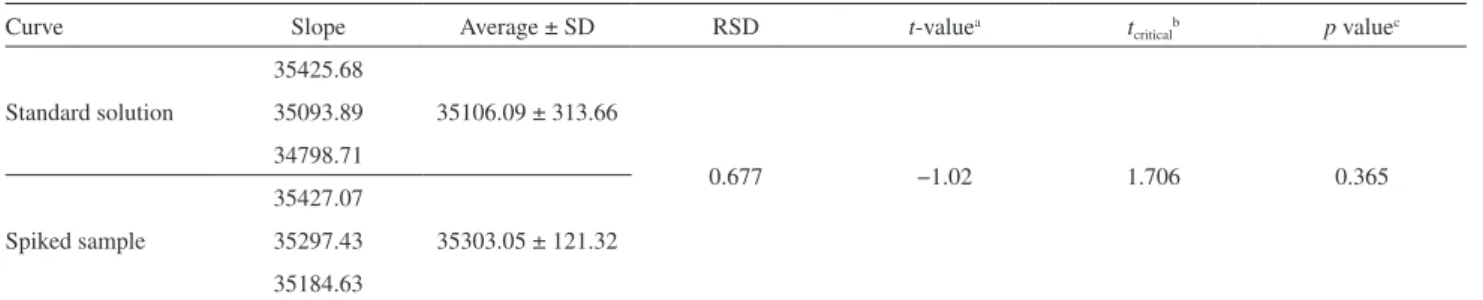
Additionally, as shown in Table 2, the slope comparison of both curves (standard solution and spiked samples) showed no significant variation (RSD < 5%; Student’s t-test,
p > 0.05). When the slopes are equivalent the only matrix effect is the natural interference caused by the basic level of the analyte. Therefore, the selectivity of the developed method was found to be satisfactory.
Linearity was demonstrated by applying a linear regression model to fit the standard curves. The least squares regression model showed excellent correlation in the range of 20 to 80 µg mL−1, higher than 0.99, in
agreement with the ICH guidelines.35 The individual linear
equations and coefficients of determination (r2) were as
follows: curve 1: y = 35425.681x − 42.440 (r2 = 0.999);
curve 2: y = 35093.889x − 27.505 (r2 = 0.999);
curve 3: y = 34798.712x − 10.618 (r2 = 0.999). Additionally,
the equality of variances and homoscedasticity for each curve were assessed by Cochran’s C test, with homoscedasticity as the null hypothesis.41 The values of
C for the curves were: curve 1: 0.407; curve 2: 0.414; curve 3: 0.387, all lower than the critical C value of 0.561
Table 1. Retention times and peak purities for perillyl alcohol (POH) for different stress conditions evaluated and resolution between POH and near peaks
POH retention time / min POH peak purity Resolution
POH/DP3 DP4/POH
Acidic 5.6 997.4 2.052 2.156
Alkaline 5.6 999.8 2.629 N/A
Oxidative 5.6 999.9 2.749 N/A
Thermal humidity 5.6 999.9 2.657 N/A
Dry heat 5.6 999.9 2.379 N/A
POH: perillyl alcohol; DP: degradation product observed; N/A: resolution was not applied because the degradation product was not observed for this stress condition.
Table 2. Statistical comparison of the slopes of the analytical curves for the determination of selectivity
Curve Slope Average ± SD RSD t-valuea t
criticalb p valuec
Standard solution
35425.68
35106.09 ± 313.66
0.677 −1.02 1.706 0.365
35093.89
34798.71
Spiked sample
35427.07
35303.05 ± 121.32 35297.43
35184.63
at-value based on n = 21 for standard solution and n = 9 for spiked sample; bt
critical considering n = 26 degrees of freedom at 5% significance level; cStudent’s
(seven curve points and three replicates for the variable y), suggesting that the null hypothesis is acceptable, i.e., the variances are homoscedastic. The significance of the slope coefficients of the estimated lines was verified by analysis of variance (ANOVA) and F-test (critical
F-value = 4,381, considering 1 numerator degree of freedom and n − 2 denominator degrees of freedom, with a 5% significance level). The values of F for the curves were: curve 1: F(1,19) = 55577.6, p < 0.05; curve 2: F(1,19) = 29997.5,
p < 0.05; curve 3: F(1,19) = 48517.1, p < 0.05. All values
of F were larger than the critical F-value, indicating that the proposed models are suitable for describing the phenomenon. Visual evaluation of residual plots showed
that there was random behavior of distribution, showing no trend.
In order to define the accuracy of the chromatographic method for quantification of POH, recovery studies were performed following the standard addition procedure. The average recovery percentages for low, medium and high levels of POH were 100.99 ± 0.74%, 99.06 ± 0.33% and 99.34 ± 0.51%, respectively. These results indicate a good agreement between the experimental and nominal concentrations of POH. In this way, all measurements performed in this concentration range can be considered as in close agreement with the true POH concentration. The results obtained in the intra- and inter-days precision
Table 3. Repeatability and intermediate precision for perillyl alcohol
Sample
Precision
Repeatability Intermediate precision
t-valuea t critical
Assay ± SD (n = 3) / (µg mL−1)
Average ± SD (n = 9)
RSD (n = 9) / %
Assay ± SD (n = 3) / (µg mL−1)
Average ± SD (n = 9)
RSD (n = 9) / %
Low
19.2 ± 0.028
19.8 ± 0.54 2.75
18.4 ± 0.149
18.9 ± 0.55 2.91 −1.946 2.119
19.7 ± 0.023 19.6 ± 0.014
20.4 ± 0.063 18.7 ± 0.028
Medium
49.9 ± 0.128
49.8 ± 0.28 0.56
51.0 ± 0.056
50.0 ± 0.78 1.55 0.992 2.228
49.6 ± 0.428 49.5 ± 0.497
49.8 ± 0.073 49.6 ± 0.119
High
80.8 ± 0.045
80.7 ± 0.41 0.51
80.6 ± 0.020
80.5 ± 0.30 0.37 1.909 2.119
80.5 ± 0.467 80.1 ± 0.060
80.8 ± 0.618 80.8 ± 0.688
aStudent’s t-test at 95% confidence level (low p value: 0.069; medium p value: 0.334; high p value: 0.074).
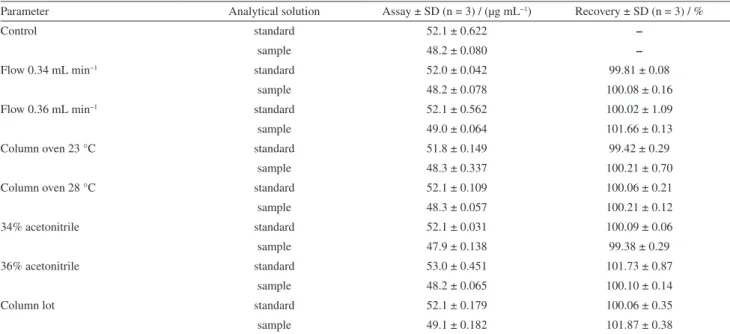
Table 4. Effect of the variation of analytical parameters on the recovery of perillyl alcohol in sample and standard solutions
Parameter Analytical solution Assay ± SD (n = 3) / (µg mL−1) Recovery ± SD (n = 3) / %
Control standard 52.1 ± 0.622 –
sample 48.2 ± 0.080 –
Flow 0.34 mL min−1 standard 52.0 ± 0.042 99.81 ± 0.08
sample 48.2 ± 0.078 100.08 ± 0.16
Flow 0.36 mL min−1 standard 52.1 ± 0.562 100.02 ± 1.09
sample 49.0 ± 0.064 101.66 ± 0.13
Column oven 23 °C standard 51.8 ± 0.149 99.42 ± 0.29
sample 48.3 ± 0.337 100.21 ± 0.70
Column oven 28 °C standard 52.1 ± 0.109 100.06 ± 0.21
sample 48.3 ± 0.057 100.21 ± 0.12
34% acetonitrile standard 52.1 ± 0.031 100.09 ± 0.06
sample 47.9 ± 0.138 99.38 ± 0.29
36% acetonitrile standard 53.0 ± 0.451 101.73 ± 0.87
sample 48.2 ± 0.065 100.10 ± 0.14
Column lot standard 52.1 ± 0.179 100.06 ± 0.35
determination experiments have been expressed as RSD (Table 3). Small RSD values were found for both intra-day and inter-days analyses. The intermediate precision was evaluated by Student’s t-test for each level between the different analysts. The values obtained for t-value were lower than tcritical, highlighting that the means are statistically
equivalent (Student’s t-test, p > 0.05).
Table 4 summarizes the results found in the robustness test. None of the alterations made to the method affected the determination of POH and no significant differences among these experimental effects were observed when compared to the assay of the standard and control samples. The peak purity values for POH were larger than 0.99 in all evaluated conditions, indicating no coelution. The resolution between POH and degradation peaks was evaluated and all situations showed good chromatographic separation, with resolutions larger than 1.5. Even so, the method was considered robust.
The stability tests were designed to take into consideration the anticipated conditions of handling real samples. The recovery results for POH stock standard solutions were, respectively, 99.60, 99.48 and 100.50% for long-term stability (2-8 °C for 7, 14 and 30 days). The recovery result for sample preparation under bench-top stability (sample manager at 20 °C for 12 h) was 99.61%. Under the tested conditions, the results were not statistically different from the results of freshly prepared standard solutions (p > 0.05, Student’s t-test, 95% confidence level).
Since the encapsulation efficiency represents the amount of drug incorporated in nanostructured system, optimize the loading capacity during development phase can improve therapeutic goal. In furtherance of this objective, the proper evaluation of encapsulation efficiency plays a crucial role, being the development of analytical method and subsequent analytical validation important steps prior to the pharmacotechnical development. Nanoparticles containing POH were obtained by the single-emulsion solvent-evaporation technique and presented particle size of 173.15 ± 4.05 nm. The zeta potential was negative: −19.57 ± 1.36 mV. The encapsulation efficiency of POH in nanoparticles was determined in triplicate by the method developed and validated previously in this work. The free POH concentration in sample preparation was determined to be 47.82 ± 0.04 µg mL−1, within the analytical range
determined in the analytical validation. The encapsulation efficiency was 74.45 ± 0.02%, calculated by the difference of the amount of POH initially added to the formulation (9.75 mg (> 96.0%), total dilution volume of 50 mL). Degradation products were not observed in the analyzed nanoparticles, indicating that the production steps that
could be more aggressive to the drug, such as the use of ultrasonication and vacuum system temperature, do not favor chemical degradation.
Conclusions
A suitable stability-indicating method was developed for both determination of POH encapsulation efficiency in polymeric nanoparticles formulation and evaluating the presence of related degradation products. The developed method was found to be selective and efficient as validated according to ICH guidelines. The results of the validation study suggest that the method is selective, linear, precise, accurate and robust. The method was successfully applied to determine the encapsulation efficiency of POH in polymeric nanoparticles. The presence of degradation products was not observed in nanoparticles freshly produced, indicating that the production steps that could be more aggressive to the drug do not favor its chemical degradation. In addition, the chromatographic method could be further employed in performance studies of POH formulations, such as stability and in vitro drug release.
Acknowledgments
The authors thank the Brazilian agencies CAPES and CNPq for fellowships.
References
1. Crowell, P. L.; Elson, C. E. In Handbook of Nutraceuticals and Functional Foods; Wildman, R. E. C., ed.; CRC Press LLC: Boca Raton, FL, 2001, p. 31.
2. Chen, T. C.; Fonseca, C. O. D.; Schönthal, A. H.; Am. J. Cancer Res.2015, 5(5), 1580.
3. Yeruva, L.; Pierre, J. K.; Elegbede, A.; Wang, C. R.; Carper, S. W.; Cancer Lett.2007, 257, 216.
4. Elegbede, J. A.; Flores, R.; Wang, R. C.; Life Sci.2003, 73, 2831.
5. Wiseman, D. A.; Werner, S. R.; Crowell, P. L.; J. Pharmacol. Exp. Ther.2007, 320, 1163.
6. Clark, S. S.; Perman, S. M.; Sahin, M. B.; Jenkins, G.; Elegbede, J. A.; Leukemia2002, 16, 213.
7. Fonseca, C. O.; Gattass, C. R.; Linden, R.; Carvalho, M. G.; Futuro, D.; Santos, T. T.; J. Bras. Neurocir. 2007, 18, 7. 8. Azzoli, C. G.; Miller, V. A.; Ng, K. K.; Krug, L. M.; Spriggs,
D. R.; Tong, W. P.; Cancer Chemother. Pharmacol.2003, 51, 493.
10. Morgan-Meadows, S.; Dubey, S.; Gould, M.; Tutsch, K.; Marnocha, R.; Arzzomanin, R.; Cancer Chemother. Pharmacol. 2003, 52, 361.
11. Danhier, F.; Ansorena, E.; Silva, J. M.; Coco, R.; Breton, A. L.; Préat, V.; J. Controlled Release2012, 161(2), 505.
12. Khalil, N. M.; Nascimento, T. C. F.; Casa, D. M.; Dalmolin, L. F.; Mattos, A. C.; Hoss, I.; Romano, M. A.; Mainardes, R. M.;
Colloids Surf., B2013, 101, 353.
13. Khalil, N. M.; Carraro, E.; Cótica, L. F; Mainardes, R. M.;
Expert Opin. Drug Delivery2011, 8, 95.
14. Kumari, A.; Yadav, S. K.; Yadav, S. C.; Colloids Surf., B2010,
75, 1.
15. Khalil, N. M.; Mainardes, R. M.; Curr. Drug Delivery2009, 6, 261.
16. Frank, A.; Pridgen, E.; Molnar, L. K.; Farokhzad, O. C.; Mol. Pharmacol.2008, 5, 505.
17. Leroux, J. C.; Allemann, E.; De Jaeghere, F.; Doelker, E.; Gurny, R. L.; J. Controlled Release1996, 39, 339.
18. Schaffazick, S. R.; Guterres, S. S.; Quim. Nova2003, 26(5), 726.
19. Zhang, Z.; Chen, H.; Chan, K. K.; Budd, T.; Ganapathi, R.; J. Chromatogr. B: Biomed. Sci. Appl.1999, 728(1), 85. 20. Schimidt, L.; Belov, V. N.; Göen, T.; Anal. Chim. Acta2013,
793(2), 26.
21. Matysik, S.; Matysik, F. M.; Microchim. Acta2009, 166, 109. 22. Sandner, F.; Fornara, J.; Dott, W.; Hollender, J.; J. Chromatogr.
B: Anal. Technol. Biomed. Life Sci.2002, 780(2), 225. 23. Song, H. S.; Sawamura, M.; Ito, T.; Kawashimo, K.; Ukeda,
H.; Flavour Fragrance J.2000, 15, 245.
24. Vichi, S.; Riu-Aumatell, M.; Mora-Pons, M.; Guadayol, J. M.; Buxaderas, S.; López-Tamames, E.; Food Chem.2007, 105(4), 1748.
25. Gupta, A.; Stratton, S. P.; Myrdal, P. B.; J. Pharm. Biomed. Anal.2005, 37(3), 447.
26. Ikechukwu, E. E.; Phillips, L. R.; Wolfe, T. L.; Esmail, T. S.;
J. Chromatogr. B: Biomed. Sci. Appl.1997, 688(2), 354. 27. Hua, H. Y.; Zhao, Y. X.; Liu, L.; Ye, Q. X.; Ge, S. W.; J. Pharm.
Biomed. Anal.2008, 48(4), 1201.
28. Tao, L.; Pereira, M. A.; J. Chromatogr. A1998, 793(1), 71. 29. Hjertman, M.; Wejde, J.; Larsson, O.; Biochem. Biophys. Res.
Commun.2001, 288(3), 736.
30. Boon, P. J.; Van Der Boon, D.; Mulder, G. J.; Toxicol. Appl. Pharmacol.2000, 167(1), 55.
31. Meesters, R. J.; Duisken, M.; Jähnigen, H.; Hollender, J.; J. Chromatogr. B: Anal. Technol. Biomed. Life Sci.2008, 875(2), 444.
32. ICH, International Conference on Harmonization of Technical Requirements for Registration of Pharmaceuticals for Human Use, Q3A(R2); Impurities in New Drug Substances; ICH: Geneva, 2006.
33. ICH, International Conference on Harmonization of Technical Requirements for Registration of Pharmaceuticals for Human Use, Q3B(R2); Impurities in New Drug Products; ICH: Geneva, 2006.
34. Li, M.; Rouaud, O.; Poncelet, D.; Int. J. Pharm.2008, 363, 26. 35. ICH, International Conference on Harmonization of Technical Requirements for Registration of Pharmaceuticals for Human Use, Q2B(R1); Validation of Analytical Procedures: Text and Methodology; ICH: Geneva, 2005.
36. ICH, International Conference on Harmonization of Technical Requirements for Registration of Pharmaceuticals for Human Use, Q1B; Photostability Testing of New Active Substances and Medicinal Products: Text and Methodology; ICH: Geneva, 1998. 37. Alves, A. C. S.; Mainardes, R. M.; Khalil, N. M.; Mater. Sci.
Eng., C2016, 60, 126.
38. Mainardes, R. M.; Gremião, M. P.; Brunetti, I. L.; da Fonseca, L. M.; Khalil, N. M.; J. Pharm. Sci.2009, 98(1), 257. 39. Xie, H.; Smith, J. W.; J. Nanobiotechnol.2010, 8, 18. 40. Morales-Cruz, M.; Flores-Fernandez, G. M.; Morales-Cruz,
M.; Orellano, E. A.; Rodriguez-Martinez, J. A.; Ruiz, M.; Griebenow, K.; Results Pharma Sci.2012, 2, 79.
41. ISO, International Organization for Standardization; ISO 5725-3:1994Accuracy (Trueness and Precision) of Measurement
Methods and Results. Part 3: Intermediate Measures of
Precision of a Standard Measurement Method; ISO: Geneva, 1994.
Submitted: November 1, 2016