AMTD
6, 4039–4075, 2013AATSR aerosol retrieval uncertainty
P. Kolmonen et al.
Title Page
Abstract Introduction
Conclusions References
Tables Figures
◭ ◮
◭ ◮
Back Close
Full Screen / Esc
Printer-friendly Version Interactive Discussion
Discussion
P
a
per
|
Dis
cussion
P
a
per
|
Discussion
P
a
per
|
Discussio
n
P
a
per
|
Atmos. Meas. Tech. Discuss., 6, 4039–4075, 2013 www.atmos-meas-tech-discuss.net/6/4039/2013/ doi:10.5194/amtd-6-4039-2013
© Author(s) 2013. CC Attribution 3.0 License.
Atmospheric Measurement
Techniques
Open Access
Discussions
Geoscientiic Geoscientiic
Geoscientiic Geoscientiic
This discussion paper is/has been under review for the journal Atmospheric Measurement Techniques (AMT). Please refer to the corresponding final paper in AMT if available.
Uncertainty characterization of AOD for
the AATSR dual and single view retrieval
algorithms
P. Kolmonen1, A.-M. Sundstr ¨om2, L. Sogacheva1, E. Rodriguez1, T. Virtanen2, and G. de Leeuw1,2
1
Finnish Meteorological Institute, Erik Palmenin Aukio 1, 00560 Helsinki, Finland 2
Department of Physics, University of Helsinki, Gustav H ¨allstr ¨omin katu 2a, 00560 Helsinki, Finland
Received: 6 March 2013 – Accepted: 18 April 2013 – Published: 29 April 2013
Correspondence to: P. Kolmonen ([email protected])
AMTD
6, 4039–4075, 2013AATSR aerosol retrieval uncertainty
P. Kolmonen et al.
Title Page
Abstract Introduction
Conclusions References
Tables Figures
◭ ◮
◭ ◮
Back Close
Full Screen / Esc
Printer-friendly Version Interactive Discussion
Discussion
P
a
per
|
Dis
cussion
P
a
per
|
Discussion
P
a
per
|
Discussio
n
P
a
per
|
Abstract
The uncertainty associated with satellite-retrieved aerosol properties is needed when these data are used to constrain chemical transport or climate models by using data assimilation. Global uncertainty as provided by comparison with independent ground-based observations is usually not adequate for that purpose. Rather the per-pixel
un-5
certainty is needed. In this work we describe how these are determined in the AATSR dual and single view aerosol retrieval algorithms (ADV and ASV) which are used to retrieve aerosol optical properties from reflectance measured at the top of the atmo-sphere. AATSR is the Aerosol Along-Track Scanning Radiometer which flies on the European Space Agency Environmental Satellite ENVISAT. In addition, issues related
10
to multi-year retrievals are described and discussed. The aerosol optical depth (AOD) retrieved for the year 2008 is validated versus ground-based AERONET sun photome-ter measurements with good agreement (r=0.85). The comparison of the AOD un-certainties with those provided by AERONET shows that they behave well in a sta-tistical sense. Other considerations regarding global multi-year aerosol retrievals are
15
presented and discussed.
1 Introduction
Atmospheric aerosols have a strong effect on the Earth climate due to their reflection and absorption of solar radiation (direct effect) and because they can act as cloud condensation nuclei and thus affect cloud properties (indirect effect). Aerosol particles
20
also have an adverse effect on human health and are important for heterogeneous chemical processes in the atmosphere. To assess the effects of aerosols, their spa-tial and temporal distributions need to be known. Accurate information can be obtained from ground-based measurements, but these are representative for only a limited area. Information on regional and global scales can be obtained from satellite data.
Algo-25
AMTD
6, 4039–4075, 2013AATSR aerosol retrieval uncertainty
P. Kolmonen et al.
Title Page
Abstract Introduction
Conclusions References
Tables Figures
◭ ◮
◭ ◮
Back Close
Full Screen / Esc
Printer-friendly Version Interactive Discussion
Discussion
P
a
per
|
Dis
cussion
P
a
per
|
Discussion
P
a
per
|
Discussio
n
P
a
per
|
the atmosphere (TOA) measured by satellite-based instruments, i.e. radiometers and spectrometers. This information can be used to constrain chemical transport models by data assimilation (e.g. Benedetti et al., 2009) or to evaluate model results. Such combi-nation of measurements and models aims to provide the best possible information on the occurrence and concentrations of aerosol particles.
5
For the assimilation of satellite-retrieved aerosol properties in transport models the data must meet a number of requirements which have been studied extensively by, e.g., Hyer et al. (2011). One of these is a thorough understanding of the uncertainty char-acteristics. Global uncertainties as provided by comparison with independent ground-based observations are usually not adequate for that purpose. Rather the per-pixel
10
uncertainty is needed. This is mainly because of the large variation of the reflectance of the underlying surface. For instance, the TOA reflectance over a highly reflecting surface is more intense than over a dark surface but the aerosol signal over adjacent pixels would be the same and, thus, more difficult to entangle form the total TOA signal. Hence, the retrieval uncertainty depends on the underlying surface. Another critical
is-15
sue for data assimilation is the possible bias in the data. Data outliers can lead the assimilation to erroneous results.
In global climate modelling the assimilation of the retrieved aerosol properties differs slightly. Huneeus et al. (2012) show that a uniform uncertainty in the satellite-retrieved data needs to be used to avoid unwanted bias in the model results. Satellite retrievals
20
can be used, however, as reference for global models, and well-defined retrieval uncer-tainty is very much needed for this purpose.
In this paper the retrieval of aerosol properties using TOA radiances measured by the Advanced Along-Track Scanning Radiometer (AATSR), flying on the European Space Agency (ESA) environmental satellite ENVISAT, is described, including uncertainty
25
AMTD
6, 4039–4075, 2013AATSR aerosol retrieval uncertainty
P. Kolmonen et al.
Title Page
Abstract Introduction
Conclusions References
Tables Figures
◭ ◮
◭ ◮
Back Close
Full Screen / Esc
Printer-friendly Version Interactive Discussion
Discussion
P
a
per
|
Dis
cussion
P
a
per
|
Discussion
P
a
per
|
Discussio
n
P
a
per
|
suitable for the retrieval of aerosol properties. The centre wavelengths of the AATSR channels are 0.555, 0.659, 0.865, 1.61, 3.70, 10.85, and 12.00 µm.
A number of algorithms have been developed for aerosol retrieval over land us-ing AATSR data. The retrieval algorithms described in this paper for use over land and water build on those developed by Veefkind et al. (1998) and Veefkind and de
5
Leeuw (1998), respectively. The dual-view algorithm (ADV) for aerosol retrieval over land was originally developed by Veefkind et al. (1999). It differs significantly from the Swansea algorithm by North et al. (1999); Grey et al. (2006), or the Oxford-RAL algo-rithm (Thomas et al., 2009) in the way the surface reflectance is handled. ADV uses both views to eliminate the surface reflectance from the TOA signals as described
be-10
low. In the Swansea algorithm, a surface reflectance model is used which makes it possible to retrieve aerosol properties and surface reflectance simultaneously (North et al., 1999). The Oxford-RAL algorithm relies on information from the retrieval of an-other instrument: the land surface bi-directional reflectance product of MODIS (MOD-erate resolution Imaging Spectrometer).
15
The over-ocean retrieval is based on modelling of the TOA reflectance and then min-imizing the discrepancy between the measured and modelled reflectance. The ASV (AATSR Single-View) algorithm, described below, currently utilizes only one of the AATSR views.
In this paper we describe recent improvements and extensions of the ADV and ASV
20
algorithms. The principles of the ASV and ADV methods have been introduced in sev-eral earlier publications (Veefkind and de Leeuw, 1998; Veefkind et al., 1999; Curier at al., 2009),but this information in necessarily duplicated to some extent in Sects. 2 and 3, to provide context for recent modifications and improvements of the algorithms and extensions, e.g., to include uncertainty estimation (Sects. 2.3 and 3.4) and to
re-25
AMTD
6, 4039–4075, 2013AATSR aerosol retrieval uncertainty
P. Kolmonen et al.
Title Page
Abstract Introduction
Conclusions References
Tables Figures
◭ ◮
◭ ◮
Back Close
Full Screen / Esc
Printer-friendly Version Interactive Discussion
Discussion
P
a
per
|
Dis
cussion
P
a
per
|
Discussion
P
a
per
|
Discussio
n
P
a
per
|
2 ADV algorithm for over land retrieval
2.1 Formal background of the dual-view algorithm
The AATSR dual-view algorithm ADV uses the TOA reflectance at 3 wavelengths in both the nadir and forward views for retrieval of aerosol properties over land (Veefkind et al., 1999, 2000; Robles Gonz ´alez, 2003; Curier at al., 2009). These properties
in-5
clude aerosol optical depth (AOD) for three wavelengths (nominally 0.555, 0.659 and 1.61 µm). In addition, an aerosol model is retrieved.
The aerosol model is a mixture of four aerosol components each of which is de-scribed by a log-normal size distribution defined by an effective radius and a standard deviation (see Sect. 2.2), and a complex refractive index. Two of the aerosol
com-10
ponents define small particles and the other two coarse particles. One of the small particle components is non-absorbing while the other one is strongly absorbing. By mixing these two components the absorption of the small particles can arbitrarily be set. The coarse particle components are sea salt and desert dust. Desert dust is com-posed of non-spherical particles; the other three components are assumed to consist
15
of spherical particles. The aerosol components are adopted from the ESA Aerosol CCI (Climate Change Initative) project1 (Holzer-Popp et al., 2013; de Leeuw et al., 2013). The properties of the components are described in Table 1. The aerosol model used in the retrieval is determined by first mixing the small and large components separately, and then mixing the ensuing small and coarse modes. The mixing ratios are selected
20
during the retrieval process by fitting the aerosol model to the reflectance measured at three (four over ocean) wavelengths, except for the dust fraction which is selected from an aerosol climatology based on the median of 13 global models as described in (Holzer-Popp et al., 2013). The mixing ratio of non-absorbing and absorbing fine components is retrieved semi-freely. The mixing ratio can have any value in the range
25
1
AMTD
6, 4039–4075, 2013AATSR aerosol retrieval uncertainty
P. Kolmonen et al.
Title Page
Abstract Introduction
Conclusions References
Tables Figures
◭ ◮
◭ ◮
Back Close
Full Screen / Esc
Printer-friendly Version Interactive Discussion
Discussion
P
a
per
|
Dis
cussion
P
a
per
|
Discussion
P
a
per
|
Discussio
n
P
a
per
|
of±0.3 from the AEROCOM climatology value. The fine – coarse mixture is retrieved completely independent of the climatology.
The algorithm is based on a number of assumptions:
– TOA reflectanceρis of the form (Veefkind et al., 2000)
ρ(µ0,µ,φ,λ)=ρa(µ0,µ,φ,λ)+
T(µ0,µ,φ,λ)ρg(µ0,µ,φ,λ)
1−s(λ)Rs(λ)
, (1)
5
whereρais the reflectance due to the atmosphere,ρgis the surface reflectance,
T is the product of downward and upward atmospheric transmittance,sis the at-mospheric backscatter ratio, andRsis the surface albedo. Reflectance and
trans-mittance parameters:µ0is the solar zenith angle,µis the viewing (satellite) zenith
angle,φis the relative azimuth angle between the sun and the satellite, andλis
10
the wavelength. Note that, for method development purposes, multiple scattering between the surface and the atmosphere is assumed to be angle-independent i.e. surface albedoRsis used in the numerator of Eq. (1) instead of surface reflectance
ρg. It has been suggested that multiple scattering in the surface-atmosphere
sys-tem will lead to isotropically distributed scattering (Wanner et al., 1997) which
15
supports the use of surface albedo instead of reflectance.
– Atmospheric reflectance
ρa(µ0,µ,φ,λ)=ρR(µ0,µ,φ,λ)+ρaer(µ0,µ,φ,λ), (2)
whereρRis reflectance due to Rayleigh scattering andρaer is reflectance due to
aerosols.
20
– Reflectance due to aerosols is computed using the modified linear mixing method by Abdou et al. (1997) assuming external mixture of the aerosol particles. The method as adapted to ADV for two aerosol components is
ρaer=b1
ωmix
ω1
e−τ1|ω1−ωmix|ρ
1+b2
ωmix
ω2
e−τ2|ω2−ωmix|ρ
AMTD
6, 4039–4075, 2013AATSR aerosol retrieval uncertainty
P. Kolmonen et al.
Title Page
Abstract Introduction
Conclusions References
Tables Figures
◭ ◮
◭ ◮
Back Close
Full Screen / Esc
Printer-friendly Version Interactive Discussion
Discussion
P
a
per
|
Dis
cussion
P
a
per
|
Discussion
P
a
per
|
Discussio
n
P
a
per
|
whereωis the single scattering albedo (SSA) and τis AOD. Subscripts 1 and 2 refer to two aerosol components while mix refers to their mixing ratio. Reflectance due to an aerosol component isρ, and SSA mixture is
ωmix=b1ω1+b2ω2. (4)
For the weighting coefficientsb1+b2=1. The modified linear mixing method is 5
applied to better account for the effects of mixing two aerosol components with different absorbing properties. This is done by introducing the single scattering albedo into linear mixing. If the SSAs of the aerosol components are identical, Eq. (3) simplifies to
ρaer=b1ρ1+b2ρ2. (5)
10
The needed aerosol transmittance is computed using linear mixing.
– The ratio of the surface reflectance measured in the forward and nadir views, k, is independent of wavelength (Flowerdew and Haigh, 1995):
k=ρ
f
g(µ0,µ,φ,λ)
ρng(µ0,µ,φ,λ)
, (6)
whereρfgandρ n
gare the forward and nadir surface reflectance, respectively. The 15
k ratio is evaluated for the measured reflectance in the 1.61 µm wavelength band using equation
k= ρ
f
(µ0,µ,φ, 1.61 µm)
ρn(µ
0,µ,φ, 1.61 µm)
. (7)
The aerosol contribution at this wavelength is relatively small (except in the pres-ence of coarse particles such as dust or sea spray aerosol).
AMTD
6, 4039–4075, 2013AATSR aerosol retrieval uncertainty
P. Kolmonen et al.
Title Page
Abstract Introduction
Conclusions References
Tables Figures
◭ ◮
◭ ◮
Back Close
Full Screen / Esc
Printer-friendly Version Interactive Discussion
Discussion
P
a
per
|
Dis
cussion
P
a
per
|
Discussion
P
a
per
|
Discussio
n
P
a
per
|
– The k ratio is not reliable for bright surface reflectance. For this reason, if the measured nadir reflectance at 1.61 µm is above 0.45, retrieval is not done.
– The 0.865 µm channel is excluded from the retrieval because thek ratio assump-tion is usually not valid as there is a strong reflectance by vegetaassump-tion at this wave-length (Robles Gonz ´alez et al., 2000).
5
With these assumptions Eq. (1) can be written separately for the forward and nadir views. Then, by combining these equations while keeping in mind that the multiple scattering is assumed to be angle independent, relation
ρn(µ0,µ,φ,λ)−ρ n
a(µ0,µ,φ,λ)
ρng(µ0,µ,φ,λ)Tn(µ0,µ,φ,λ)
=ρ
f
(µ0,µ,φ,λ)−ρ f
a(µ0,µ,φ,λ)
ρfg(µ0,µ,φ,λ)Tf(µ0,µ,φ,λ)
(8)
can be made formally. The key aspect of the dual-view algorithm is to introduce the
10
kratio in Eq. (8) to obtain
ρn(µ0,µ,φ,λ)−ρ n
a(µ0,µ,φ,λ)
Tn(µ
0,µ,φ,λ)
=ρ
f
(µ0,µ,φ,λ)−ρ f
a(µ0,µ,φ,λ)
kTf(µ
0,µ,φ,λ)
. (9)
Now all the needed knowledge about surface reflectance is in thek ratio.
2.2 Computational aspects of ADV
Modeled values of the atmospheric reflectanceρa and transmittance T must be
de-15
termined in order to use Eq. (9) for the retrieval of aerosol properties. These values, together with other information, can be computed using radiative transfer (RT) meth-ods. RT methods provide a way to solve the forward problem of the retrieval which for the case of atmospheric reflectance can be stated as: for given atmospheric conditions (aerosol and gas concentrations) determine the amount of incoming solar radiation that
20
AMTD
6, 4039–4075, 2013AATSR aerosol retrieval uncertainty
P. Kolmonen et al.
Title Page
Abstract Introduction
Conclusions References
Tables Figures
◭ ◮
◭ ◮
Back Close
Full Screen / Esc
Printer-friendly Version Interactive Discussion
Discussion
P
a
per
|
Dis
cussion
P
a
per
|
Discussion
P
a
per
|
Discussio
n
P
a
per
|
During a retrieval the forward problem must be solved numerous times which is time consuming. The most common technique to overcome this is to perform the radiative transfer calculations for a set of fixed variables before the retrieval. The calculated values are arranged into a multi-dimensional array that is called a look-up-table (LUT). During the retrieval the actual values for the required variables can be quickly obtained
5
by interpolation between values available from the LUT. The chosen RT algorithm that is used with ADV is DAK (Doubling Adding KNMI), Haan et al. (1987). To ensure reliable LUT values, the RT algorithm is limited to solar zenith angles smaller than 75◦.
LUTs are computed for each aerosol component. The size distribution of an aerosol component is described by a log-normal number size distributions of the form
10
dN
d lnr =
N0
lnσ√2πexp −
ln2(r/rg)
2 ln2σ
!
, (10)
wherer is the particle radius, rg is the geometric mean radius,σ is the standard
de-viationσ (Heintzenberg, 1994). The total number of aerosol particles N0 depends on
the aerosol load. Aerosol optical properties are computed by applying Mie calculations (Mie, 1908) except for non-spherical dust particles where the T-matrix method is used
15
(Mischenko and Davis, 1994). These calculations require knowledge of the aerosol par-ticle size distribution and refractive index which for the the aerosol components used here are given in Table 1.
The LUTs are computed for discrete sun zenith, viewing zenith and relative azimuth angles, for each AATSR wavelength, and for a number of reference AOD levels.
Cur-20
rently, 15 discrete values ranging from 0 to 90◦ are used for the zenith angles and 19 discrete values between 0 and 180◦are used for the azimuth angles. Typically ten AOD levels ranging from 0.05 to 4.0 atλ=0.500 µm are used. Transmittance and reflectance for Rayleigh (gas) scattering are computed in standard atmospheric conditions. To en-sure that the result of the radiation transfer computations are not influenced by
refrac-25
AMTD
6, 4039–4075, 2013AATSR aerosol retrieval uncertainty
P. Kolmonen et al.
Title Page
Abstract Introduction
Conclusions References
Tables Figures
◭ ◮
◭ ◮
Back Close
Full Screen / Esc
Printer-friendly Version Interactive Discussion
Discussion
P
a
per
|
Dis
cussion
P
a
per
|
Discussion
P
a
per
|
Discussio
n
P
a
per
|
Equation (9) shows that the computational task is to find the aerosol component mix-ture and reference AOD level that solve the equation for all three AATSR wavelengths simultaneously. Due to measurement and modeling errors this task is impossible in practice. Instead, the task can be converted to a least-squares type of problem
argb
fine,bnaf,Lmin Nλ
X
i=1 "
ρnm(λi)−ρ
n
a(bfine,bnaf,L,λi)
Tn(b
fine,bnaf,L,λi) −
ρfm(λi)−ρ
f
a(bfine,bnaf,L,λi)
kTf(b
fine,bnaf,L,λi)
#2
, (11)
5
where the subscript m now indicates the measured TOA reflectance. The fraction of the fine mode particles is bfine∈(0, 1), the non-absorbing component in fine particle
mixture isbnaf=bnaf,A±0.3 withbnaf∈(0, 1), and the reference AOD level isL∈(1, 10).
The mixturebnaf,A is the AEROCOM a priori value. Note that the dust fraction is not
retrieved but the AEROCOM climatology value is used. The angle arguments (µ0,µ,φ) 10
have been omitted for brevity. The number of wavelengthsNλ=3.
The reference AOD levelL is here used instead of AOD as it is the parameter that is applied in the actual solving of Eq. (11). This parameter is used when AOD, aerosol reflectance, and transmittance are determined from the aerosol LUTs.
Equation (11) also shows that the modeled atmospheric reflectance and
transmit-15
tance are functions of the decision arguments bfine, bnaf for aerosol component
mix-tures andLfor the reference AOD level. The task is now to find the decision arguments (bfine,bnaf,L) that minimize the least-squares sum. The modified linear mixing method
introduced in Eq. (3) is applied with all mixtures for the computation of reflectance. The minimization problem Eq. (11) can be optimized by applying mathematical
opti-20
mization methods. Here the chosen method is Levenberg-Marquardt (see for example Gill et al., 1999). It is a trust-region type method which is well-suited for least-squares problems, and is meant for unconstrained optimization. The latter feature causes ad-ditional considerations as the decision arguments are all box-constrained. This is han-dled in the evaluation of the least-squares sum where strict barrier functions are used
25
AMTD
6, 4039–4075, 2013AATSR aerosol retrieval uncertainty
P. Kolmonen et al.
Title Page
Abstract Introduction
Conclusions References
Tables Figures
◭ ◮
◭ ◮
Back Close
Full Screen / Esc
Printer-friendly Version Interactive Discussion
Discussion
P
a
per
|
Dis
cussion
P
a
per
|
Discussion
P
a
per
|
Discussio
n
P
a
per
|
Another feature of the Levenberg–Marquardt method is that it is a local optimizer. It will converge efficiently to the nearest local minimum. To increase the probability of finding the globally best solution an initial search is done in a limited discrete set of decision parameters: ten mixturesbfine,bnaf, and ten AOD levelsL. The results of the
search are then used as the initial guess for the Levenberg-Marquardt method.
5
When all decision parameters have been set during the retrieval the resulting AODτ
can be computed from the LUTs:
τ(λ)=bfine[bnafτnaf(λ,L)+(1−bnaf)τaf(λ,L)]
+(1−bfine)[bdustτdust(λ,L)+(1−bdust)τss(λ,L)], (12)
10
where the abbreviations are: naf – non-absorbing fine component, af – aborbing fine component, and ss – sea salt coarse component. Dust fractionbdustis the above
men-tioned AEROCOM a piori value.
2.3 Uncertainty estimation for ADV
The effect of AATSR measurement error on the retrieved AOD is described. First the
15
uncertainty for the retrieved aerosol model decision parameters, which include the fine mode fraction bfine, the absorbing/non-absorbing fine particle mixture bnaf, and the
AOD levelL, is determined. Then these uncertainties are used to determine the final uncertainty in the retrieved AOD.
The other possible sources for errors arise from modeling. These include uncertainty
20
in the aerosol model selection (fine mode fraction, absorbing/non-absorbing fine parti-cle mixture, dust fraction), LUT interpolation errors, and radiative transfer computation errors.
The formal treatment is based on the general equation formalism by Tarantola (1987) (pp. 77–82). First, denote the parameters in the least squares problem (11) by
25
AMTD
6, 4039–4075, 2013AATSR aerosol retrieval uncertainty
P. Kolmonen et al.
Title Page Abstract Introduction Conclusions References Tables Figures ◭ ◮ ◭ ◮ Back Close
Full Screen / Esc
Printer-friendly Version Interactive Discussion Discussion P a per | Dis cussion P a per | Discussion P a per | Discussio n P a per |
and the problem equations by
fi(x)=ρ
n
m(λi)−ρ
n
a(bfine,bnaf,L,λi)
Tn(b
fine,bnaf,L,λi) −
ρfm(λi)−ρ
f
a(bfine,bnaf,L,λi)
kTf(b
fine,bnaf,L,λi)
, (14)
where r={ρnm(λi),ρ
f
m(λi)} ∀i ∈(1, 3) is the measured nadir and forward reflectance.
Indexi refers to the wavelengths;i ={1, 2, 3}. This kind of formulation of the problem enables the determination of uncertainty in the decision parameters based on the
mea-5
surement error. The formulation could take into account the effect of a priori information forbfine,bnafandLbut this is neglected as the only error is assumed to come from the
measurement.
Equation (14) can be solved in a least-squares sense using a quasi-Newton method. The maximum likelihood point can be found using iteration
10
xn+1=CXFtn(CT+FnCXFtn)−1f(xn), (15)
where
Fn=
∂f ∂x xn . (16)
The a posteriori covariance is
CX′=
Ft∞C−T1F∞+C−X1−1, (17)
15
wherex∞is the solution of the minimized Eq. (14). Note that even though the ADV so-lution is not computed using the iteration scheme above it is still possible to determine the a posteriori covariance.
The Jacobian matrixFis of the form
AMTD
6, 4039–4075, 2013AATSR aerosol retrieval uncertainty
P. Kolmonen et al.
Title Page
Abstract Introduction
Conclusions References
Tables Figures
◭ ◮
◭ ◮
Back Close
Full Screen / Esc
Printer-friendly Version Interactive Discussion
Discussion
P
a
per
|
Dis
cussion
P
a
per
|
Discussion
P
a
per
|
Discussio
n
P
a
per
|
All the partial derivates are computed numerically as the evaluation of these values re-quires interpolation from the aerosol LUTs and analytical differentiation is not possible. The covarianceCT includes only measurement errors. For AATSR this error is taken to be 5 % of the measured signal for the whole spectrum (Thomas et al., 2009). The principal difficulty is that in Eq. (14) there are two measured values ρnm(λi) andρfm(λi).
5
The formulation in Eq. (17) takes into account the uncertainty of only one value in the covariance matrix. However, because the nadir and forward relative measurement er-rors are equal, the larger of the computed absolute measurement erer-rors is used. It would be useful to study individually the effect of the nadir and forward measurement error on the aerosol model parameters in the future. In addition, when all errors are
10
considered to be Gaussian in nature, modelling errors could be simply added to the measurement errors (Tarantola, 1987). Another simplification here is that measure-ment errors do not correlate. Thus,CT is diagonal. This assumption does not hold for the a posteriori covarianceCX′. The uncertainty in the aerosol model parameters will
be correlated and these correlations include potentially interesting knowledge of the
15
retrieval.
The a priori covariance matrix for the aerosol model defining parametersCX is ne-glected at the moment because the uncertainty contribution of the measurement error to these very parameters is the motivation of this exercise.
AOD is determined for each of the three wavelengths simultaneously, using the
20
aerosol model defined by the three optimized decision parameters:bfine, bnaf and L.
First, for all four aerosol components that are used the corresponding AOD is interpo-lated from their LUTs by using the AOD level parameterL. Then, simultaneously, the fine aerosol components are mixed based on the non-absorbing and absorbing AOD usingbnaf, and the coarse aerosol component is obtained from mixing the sea salt and 25
AMTD
6, 4039–4075, 2013AATSR aerosol retrieval uncertainty
P. Kolmonen et al.
Title Page
Abstract Introduction
Conclusions References
Tables Figures
◭ ◮
◭ ◮
Back Close
Full Screen / Esc
Printer-friendly Version Interactive Discussion
Discussion
P
a
per
|
Dis
cussion
P
a
per
|
Discussion
P
a
per
|
Discussio
n
P
a
per
|
Denote the AOD interpolation/mixing operator byp. Then for wavelengthi the AOD is
τi =pi(bfine,bnaf,L). (19)
The covariance of AOD is then (Meyer, 1975)
CAOD=PCX′Pt, (20)
5
wherePis the Jacobian of the interpolation/mixing operator:
P=
∂p1 ∂b1
∂p1 ∂b2
∂p1 ∂L ∂p2
∂b1 ∂p2 ∂b2
∂p2 ∂L ∂p3
∂b1 ∂p3 ∂b2
∂p3 ∂L
. (21)
The uncertainty qestimate for AOD can be finally found in the diagonal ofCAOD.
The uncertainty of the dust fraction, which is not a retrieved parameter, could be
10
added toCX′ if this uncertainty was assumed to be Gaussian.
3 ASV algorithm for over ocean retrieval
The basic principle of the ASV algorithm is to minimize the discrepancy between the TOA measured and modelled reflectance at wavelengths of 0.555, 0.659, 0865 and 1.61 µm. The modelled reflectance is described below. The aerosol modelling follows
15
AMTD
6, 4039–4075, 2013AATSR aerosol retrieval uncertainty
P. Kolmonen et al.
Title Page
Abstract Introduction
Conclusions References
Tables Figures
◭ ◮
◭ ◮
Back Close
Full Screen / Esc
Printer-friendly Version Interactive Discussion
Discussion
P
a
per
|
Dis
cussion
P
a
per
|
Discussion
P
a
per
|
Discussio
n
P
a
per
|
3.1 The modelled TOA reflectance over ocean
The TOA reflectanceρover ocean is given by (Veefkind and de Leeuw, 1998):
ρ=ρa+T ↓ρs,dir/(1−sρs,dir)T ↑+t↓ρs,dif↓T ↑
+T ↓ρs,dif↑t↑+t↓ρs,isot↑, (22)
5
where ρ is the top-of-the atmosphere reflectance, s is the atmospheric backscatter ratio,T is the direct transmittance and t is the diffuse transmittance upwards (↑) and downwards (↓). The termsρaandρsare the atmospheric and surface reflectance,
re-spectively, and the other terms come from the ocean surface model which is described in the next section. The multiple scattering between surface and atmosphere has been
10
included only for the direct down–direct up case as it becomes negligible when diffuse transmittance is applied. Note that geometric and wavelength dependencies in Eq. (22) are omitted for brevity. The terms in Eq. (22) from left to right describe:
– Reflectance due to scattering in the atmosphere by aerosols and molecules.
– Photons transmitted downward, reflected by the ocean surface, and transmitted
15
up.
– Photons scattered along the downward path, reflected by the ocean surface, and transmitted up.
– Photons transmitted downward, reflected by the ocean surface, and scattered towards the satellite instrument.
20
– Photons scattered along the downward path, reflected by the ocean surface, and scattered towards the satellite instrument.
AMTD
6, 4039–4075, 2013AATSR aerosol retrieval uncertainty
P. Kolmonen et al.
Title Page
Abstract Introduction
Conclusions References
Tables Figures
◭ ◮
◭ ◮
Back Close
Full Screen / Esc
Printer-friendly Version Interactive Discussion
Discussion
P
a
per
|
Dis
cussion
P
a
per
|
Discussion
P
a
per
|
Discussio
n
P
a
per
|
3.2 Ocean reflectance modelling
The ocean surface reflectance is modelled as the sum of specular (Fresnel) reflectance (Cox and Munk, 1954) and reflectance by subsurface scattering. The Fresnel part is described by the geometric situation while the subsurface scattering is a function of chlorophyll concentration. The surface reflectance is a sum of four components based
5
on atmospheric transmittance (see Eq. 22). The reflectance in these components is given by the Eqs. (23)–(26).
ρs,dir(µ0,µ,φ,λ)=ρglint(µ0,µ,φ,λ)+ρchl(C,λ), (23)
whereρglintis the sun glint andρchlis the subsurface reflectance due to chlorophyll with
concentration C, and it is assumed here to be Lambertian (Veefkind and de Leeuw,
10
1998). In practice the reflectance due to sun glint is not taken into account because pixels flagged as sun glint in the AATSR L1 data are not used in the retrieved. Geo-metric reflectance is determined by the cosine of solar zenith angle,µ0, the cosine of
viewing zenith angle,µ, and the relative azimuth angle,φ. Reflectance depends on the wavelengthλ. Subsurface reflectance is modelled after Morel (1988) for case I waters
15
as
ρs,diff↓(µ0,µ,φ,λ)=ρFresnel(µ0)+ρchl(C,λ) (24)
ρs,diff↑(µ0,µ,φ,λ)=ρFresnel(µ0)+ρchl(C,λ) (25)
ρs,iso(µ0,µ,φ,λ)=0.066+ρchl(C,λ). (26) In these equationsρFresnel is the Fresnel reflectance, and the factor 0.066 has been 20
adapted from Ivanov (1975). The possible error caused by the approximate value is minimal because the contribution of the term described by Eq. (26) to the TOA re-flectance is small. All of the above components include the contribution of the cap reflectance determined by the fraction of the ocean surface covered by white-caps. The whitecap fraction W is a function of wind speed U (m s−1) (Monahan and
AMTD
6, 4039–4075, 2013AATSR aerosol retrieval uncertainty
P. Kolmonen et al.
Title Page
Abstract Introduction
Conclusions References
Tables Figures
◭ ◮
◭ ◮
Back Close
Full Screen / Esc
Printer-friendly Version Interactive Discussion
Discussion
P
a
per
|
Dis
cussion
P
a
per
|
Discussion
P
a
per
|
Discussio
n
P
a
per
|
O’Muircheartaigh, 1980):
W =3.84×10⁻⁶×U3.41. (27)
3.3 ASV in practice
In the ASV retrieval the same aerosol look-up-tables are used as for the ADV retrieval. There is no distinction between land and ocean retrieval with respect to aerosol
com-5
ponents. AEROCOM a priori values and retrieval itself decide the aerosol composition for any given pixel.
As was mentioned above, the ASV method is based on minimizing the difference between the TOA measured and modelled reflectance at the four AATSR wavelengths simultaneously. This leads to a minimization scheme which is considerably different
10
from that for ADV (Eq. 11). The largest physical difference is that only one of the AATSR views is used. Currently the forward view is employed because it is less hindered by sun glint than the nadir view. The minimization in the ASV problem, following the ADV notation, is
argb
fine,bnaf,Lmin Nλ X
i=1 h
ρfm(λi)−ρf(bfine,bnaf,L,λi)
i2
, (28)
15
with the modifications thatNλ=4, as the 865 nm wavelength is also used, andρf from Eq. (22) is now the modelled atmospheric and ocean surface reflectance. Subscript m indicates the measured TOA reflectance.
3.4 Uncertainty estimation for ASV
The effect of AATSR measurement error on the retrieved AOD described for the ADV
20
algorithm in Sect. 2.3 can straightforwardly be applied to ASV by replacing Eq. (14) with the ASV minimization from Eq. (28):
AMTD
6, 4039–4075, 2013AATSR aerosol retrieval uncertainty
P. Kolmonen et al.
Title Page
Abstract Introduction
Conclusions References
Tables Figures
◭ ◮
◭ ◮
Back Close
Full Screen / Esc
Printer-friendly Version Interactive Discussion
Discussion
P
a
per
|
Dis
cussion
P
a
per
|
Discussion
P
a
per
|
Discussio
n
P
a
per
|
and performing the computations as described in the ADV uncertainty characterization.
3.5 Cloud screening
Clouded pixels have to be excluded from retrieval as they mask the other atmospheric contributions to the measured TOA reflectance. The tests that are described here were designed for the use with ATSR-2 data. For AATSR cloud flags are included in the
5
reflectance data (AATSR Handbook, 2007). However, these flags were found to be too restrictive because a significant amount of pixels that otherwise provide good AOD values, as determined from comparison with ground-based sun photometer data, are flagged as cloud-contaminated.
Therefore, three separate cloud detection tests are used. These tests are based
10
on the work of Saunders and Kriebel (1988) and Koelemeijer et al. (2001). To auto-mate the cloud screening, AATSR orbits are divided into scenes of 512×512 pixels. Reflectance in each of the scenes is histogrammed and the histrograms are used for the automatic determination of thresholds for the cloud tests as described by Robles Gonz ´alez (2003). The cloud tests are:
15
1. The gross cloud test. In the AATSR 12 µm brightness temperature channel clouds appear cooler than the underlying surface during day time. If the brightness tem-perature for a pixel is below threshold, the pixel is flagged as cloudy.
2. Generally, clouds are brighter than the underlying surface. If the reflectance of the 0.659 µm channel for a pixel is higher than threshold, the pixel is flagged as
20
cloudy.
3. Ratio of the 0.865 and 0.659 µm reflectance. If the ratio is around one for a pixel, the pixel is flagged as cloudy. The distance from unity that governs cloud flagging is determined by the automation.
These tests are applied for both AATSR views. If any of the tests indicates that a pixel
25
AMTD
6, 4039–4075, 2013AATSR aerosol retrieval uncertainty
P. Kolmonen et al.
Title Page
Abstract Introduction
Conclusions References
Tables Figures
◭ ◮
◭ ◮
Back Close
Full Screen / Esc
Printer-friendly Version Interactive Discussion
Discussion
P
a
per
|
Dis
cussion
P
a
per
|
Discussion
P
a
per
|
Discussio
n
P
a
per
|
4 The adaptation of ADV and ASV for global multi-year retrievals
The ADV algorithm is suitable for retrieving the optical properties of aerosols over land as was demonstrated for several different areas (Veefkind et al., 2000; Robles Gonz ´alez et al., 2000; Robles Gonz ´alez and de Leeuw, 2008; Kokhanovsky et al., 2009; Sundstr ¨om et al., 2012). However, for the application to very large data sets,
5
such as for global long-term retrieval, the time needed for retrieval computations was too long and processing of large data sets was very time consuming. The main reason was that three parameters need to be optimized during the retrieval process: the AOD reference level and the two mixtures of the aerosol components (see Eq. 11).
Where the original retrieval were made for each individual pixel (1×1 km2at nadir),
10
it was decided that larger retrieval tasks should be made for enhanced default pixels (superpixel), i.e. 0.1×0.1◦. This is the level 2 (L2) result grid. The L2 results are also available in a 10×10 km2 sinusoidal grid. The retrieved results are additionally given at level 3 (L3) which is averaged over a 1×1◦grid. L3 results include all AATSR orbits, usually 14, for each day.
15
The added advantage of using a larger area for retrieval is that some statistical mea-sures indicating the reliability of the retrieval can be computed using the ensemble of measured TOA reflectance values over the area.
In this section the methods for averaging the AATSR measured TOA reflectance over the superpixel are described. Also the choice of aerosol models is discussed.
20
4.1 Averaging of measured reflectance for ADV and ASV
The natural assumption when averaging TOA measured reflectance is that reflectance due to the atmosphere is sufficiently uniform over the averaged area. Here the term sufficient describes situations where no sharp spatial gradients in aerosol properties occur inside the area. Reflectance due to atmospheric gases is assumed to be uniform.
25
AMTD
6, 4039–4075, 2013AATSR aerosol retrieval uncertainty
P. Kolmonen et al.
Title Page
Abstract Introduction
Conclusions References
Tables Figures
◭ ◮
◭ ◮
Back Close
Full Screen / Esc
Printer-friendly Version Interactive Discussion
Discussion
P
a
per
|
Dis
cussion
P
a
per
|
Discussion
P
a
per
|
Discussio
n
P
a
per
|
the k ratio approach of the ADV. The k ratio is determined by applying Eq. (7) and using the nadir and forward view surface reflectance at 1.61 µm. It would be unrealistic to assume that surface reflectance is constant over the larger pixel area. Reformulation of Eq. (9):
h
ρf(µ0,µ,φ,λ)−ρ f
a(µ0,µ,φ,λ) i
/Tf(µ0,µ,φ,λ)
ρn(µ
0,µ,φ,λ)−ρan(µ0,µ,φ,λ)
/Tn(µ
0,µ,φ,λ)
=k (30)
5
shows that the value of k strongly affects the results of a retrieval. If the k ratio for the superpixel are is computed by simply averaging of all values within the pixel, the results may not be representative for any of the original pixels. As an example, consider an area where half of the larger area is covered with pixels having a highk ratio and the other half having a low value. When thekratios are averaged the end result would
10
be wrong for all of them. Furthermore, as both of the AATSR views are employed, in simple averaging of reflectance one cannot be certain that corresponding nadir/forward pixels are used when thek ratio is determined. This could lead to situations where, in principle, nadir and forward view reflectance come from different pixels.
The chosen approach to average measured reflectance is to find pixels which are
15
representative for an area, and at the same time occur in both the nadir and forward views. In ADV this is achieved by using the following method:
1. At least 50 % of the pixels belonging to the superpixel area must pass the cloud screening tests. This step ensures that enough information is present for the fol-lowing steps.
20
2. Produce a histogram of the measured reflectance at 1.61 µm separately for nadir and forward reflectance. Typically seven bins are used ranging from zero to the maximum of the measured reflectance. The near-infrared channel is used here because the effect of aerosols is small. That is, the measured reflectance is con-sidered in first approximation to have contributions from the surface only.
AMTD
6, 4039–4075, 2013AATSR aerosol retrieval uncertainty
P. Kolmonen et al.
Title Page
Abstract Introduction
Conclusions References
Tables Figures
◭ ◮
◭ ◮
Back Close
Full Screen / Esc
Printer-friendly Version Interactive Discussion
Discussion
P
a
per
|
Dis
cussion
P
a
per
|
Discussion
P
a
per
|
Discussio
n
P
a
per
|
3. Choose the nadir/forward bins that have the maximum number of reflectance val-ues.
4. Find out which pixels that are in the chosen bins are mutual to nadir and forward views.
5. If there are more that ten values left, average the chosen reflectance values and
5
use them in the retrieval. If less than ten values are left, the surface reflectance in the area is considered to vary too much and retrieval is not executed.
The number of bins in the histogram determination is a compromise between loss of data and degeneration towards simple averaging. If too many bins were used, there would be too few pixels for averaging of the reflectance. This situation would be
poten-10
tially poor in a statistical sense since only few pixels would represent the whole area. If too few bins were used, too wide a range of reflectance values would be accepted. This would allow pixels that could lead to a situation where the whole representative search of thekratio approach would become meaningless.
The over ocean ASV algorithm utilizes the above described reflectance averaging
15
for the sake of uniformity. A simple average could be also used for the ASV as it can be assumed that the ocean surface reflectance is quite smooth over the 0.1×0.1◦ superpixel area.
The other test for the averaged reflectance measures the uniformity of the atmo-spheric reflectance. The standard deviation of the reflectance at 0.555 µm is used as
20
a measure for the uniformity. The 0.555 µm channel is utilized here as it is sensitive to both aerosol and cloud conditions. If the standard deviation of the TOA reflectance is too large for a superpixel, results are judged to be unreliable. Retrieval is still done but the results include the standard deviation which can then be applied by the end user to exclude unreliable areas. This test can be seen also as an additional spatial cloud
25
AMTD
6, 4039–4075, 2013AATSR aerosol retrieval uncertainty
P. Kolmonen et al.
Title Page
Abstract Introduction
Conclusions References
Tables Figures
◭ ◮
◭ ◮
Back Close
Full Screen / Esc
Printer-friendly Version Interactive Discussion
Discussion
P
a
per
|
Dis
cussion
P
a
per
|
Discussion
P
a
per
|
Discussio
n
P
a
per
|
4.2 Post processing – additional cloud screening
For each pixel retrieved with ADV a cloud post-processing test is applied to deter-mine and discard the pixels that might potentially include cloud edges or residual sub-(super)pixel clouds. This processing also enables the removal of outliers that would potentially harm the assimilation of the retrieved aerosol properties in atmospheric
5
models.
Each pixel retrieved is analyzed together with the eight surrounding pixels in a 0.2× 0.2◦ area. If, in addition to the tested pixel, less than 3 pixels are retrieved in the area, the tested pixel is considered to be “contaminated” and discarded. If, besides the tested pixel, at least 3 more pixels are retrieved and the AOD for the tested pixel is smaller
10
than 0.5, the tested pixel passes the cloud processing test. If AOD>0.5, an additional standard deviation test is applied. If the standard deviation of the AOD in the area is larger than 0.25, the tested pixel is discarded.
The numbers presented above are a compromise between global coverage and ac-ceptable validation results. However, for certain areas with high AOD (e.g. India, China),
15
and for case studies of natural high AOD episodes (e.g. dust storms, volcanic erup-tions) different values can be used.
4.3 The 17 yr time series using the ATSR-2 and AATSR instruments
Global and regional changes in aerosol conditions could potentially be investigated us-ing the 17 yr (1995–2012) data record of aerosol properties provided by the combined
20
ATSR-2 (Along-Track Scanning Radiometer 2) and AATSR instruments. These two in-struments have similar characteristics. However, to detect trends the reliability of the data over this long time must be ensured. Issues which need to be taken into account include the detection and removal of bias caused by systematic instrument errors, in-strument degradation and the transition from the ATSR-2 to the AATSR inin-struments.
25
AMTD
6, 4039–4075, 2013AATSR aerosol retrieval uncertainty
P. Kolmonen et al.
Title Page
Abstract Introduction
Conclusions References
Tables Figures
◭ ◮
◭ ◮
Back Close
Full Screen / Esc
Printer-friendly Version Interactive Discussion
Discussion
P
a
per
|
Dis
cussion
P
a
per
|
Discussion
P
a
per
|
Discussio
n
P
a
per
|
reflectance data. The L1 correction has been done by the L1 data ground processing center (RAL Space at Rutherford Appleton Laboratory, UK) by correcting the so-called drift in the measured reflectance (Smith, 2008). Second, because both the nadir and forward views of the instruments are provided by the same camera (i.e. the on-board camera is tilted to produce the nadir and forward scans), it is straightforward to do the
5
formal calculus using Eq. (1) for both views and prove that the addition of systematic error, common to both views, does not affect the final results. This indicates that when the ADV algorithm is used over land, the bias caused by instrument systematic errors could be neglected. Over ocean this does not apply as only one of the views is currently used for the ASV retrieval.
10
The ATSR-2–AATSR continuation requires more research to verify that the com-bined time series produced with the ADV/ASV algorithms is reliable. Fortunately there is some overlap in the observation of the two instruments which enables to conduct the research.
5 Results
15
Results from the validation of the retrieved AOD against reference measurements in the year 2008 are presented in Sect. 5.1. Uncertainty estimates are evaluated in Sect. 5.2.
5.1 AERONET comparison
The most widely used validation reference for satellite-retrieved AOD is the ground-based sun photometer measurement network AERONET (Holben et al., 1998).
How-20
ever, the AATSR and AERONET wavelengths are not the same. Therefore, the AERONET AOD at at 0.555 µm has been obtained by interpolation from the AODs at 0.440 and 0.670 µm. Furthermore, the AOD observations need to be collocated in time and location. This was done by considering AERONET observations within±1/2 h of the AATSR overpass. Spatially, AATSR values within a 0.25×0.25◦ area around an
AMTD
6, 4039–4075, 2013AATSR aerosol retrieval uncertainty
P. Kolmonen et al.
Title Page
Abstract Introduction
Conclusions References
Tables Figures
◭ ◮
◭ ◮
Back Close
Full Screen / Esc
Printer-friendly Version Interactive Discussion
Discussion
P
a
per
|
Dis
cussion
P
a
per
|
Discussion
P
a
per
|
Discussio
n
P
a
per
|
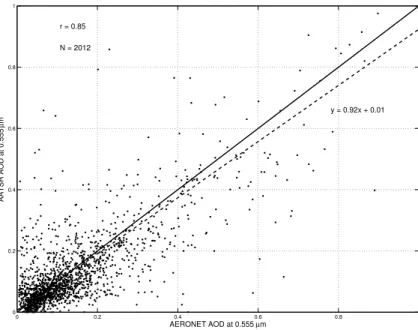
AERONET station were averaged. The validation included 198 AERONET stations. The comparison between the retrieved and reference AOD at 0.555 µm for year 2008 is shown in Fig. 1.
Despite some scatter in the comparison, the overall correlationr=0.85 is very good. Some underestimation can be seen in the linear fit (slope 0.92). This must be
com-5
firmed with multi-year validation. The mean error is 0.02 and RMSE=0.01.
To assess the regional performance of the retrieval, an analysis of the discrep-ancy between the AATSR-retrieved and AERONET AODs was made for individual AERONET stations. Here, discrepancy is defined as AERONET AOD subtracted from retrieved AATSR AOD. In the analysis at least three comparisons at a station were
re-10
quired to compute the average discrepancy. The discrepancies are shown in the map in Fig. 2 where they were averaged over areas of 1◦×1◦. Several AERONET stations may contribute to an area, especially in Europe and North America where the station network is dense.
Figure 2 shows that discrepancy is low for Europe and North America while areas
15
with bright surface and/or dust are underestimated. Coastal stations, usually based on a small island, show slight overestimation. This may require in future some adjustments in the ocean surface modeling which was described in Sect. 3.2.
5.2 Evaluation of the uncertainty estimation
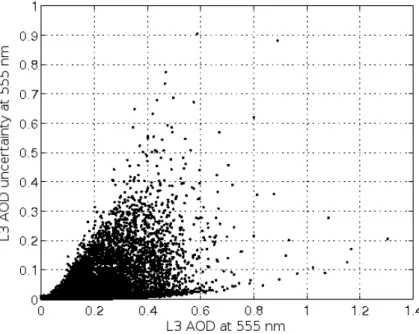
The uncertainties are shown in Fig. 3, as a plot of AATSR-retrieved AOD versus
20
AERONET AOD. For presentation clarity a small time period of two months (January and February 2008) is shown. Generally, the uncertainty seems to behave as expected. The uncertainty increases as the AOD values are higher, because the increased atmo-spheric reflectance due to aerosols results in higher values of the TOA reflectance, and thus the measurement error which is relative (5 % of the measured reflectance).
25
AMTD
6, 4039–4075, 2013AATSR aerosol retrieval uncertainty
P. Kolmonen et al.
Title Page
Abstract Introduction
Conclusions References
Tables Figures
◭ ◮
◭ ◮
Back Close
Full Screen / Esc
Printer-friendly Version Interactive Discussion
Discussion
P
a
per
|
Dis
cussion
P
a
per
|
Discussion
P
a
per
|
Discussio
n
P
a
per
|
be seen but it is overshadowed by a large amount of scatter. The scatter can be ex-plained by the fact that surface reflectance affects the determined AOD uncertainty. High surface reflectance leads to high measurement error.
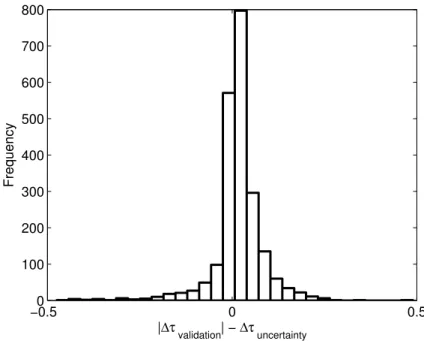
The AOD uncertainty can also be compared with the discrepancy between AATSR and AERONET AOD (seen in Fig. 1). This comparison is shown in Fig. 6 as a
his-5
togram. The uncertainty and discrepancy agree quite well in a statistical sense. 74 % of the uncertainty – discrepancy comparison is within one standard deviation. There is a small bias indicating that on average the uncertainty has values that are larger than the discrepancy. The mean of the comparison is 0.02 with standard deviation of 0.07.
6 Discussion and conclusions
10
The ADV/ASV algorithm for retrieving the properties of atmospheric aerosols was de-scribed. Emphasis was on the uncertainty characterization of the retrieved AOD as this is an important aspect for the use of the AOD data for assimilation in chemical transport models and for model evaluation.
The validation results (Figs. 1 and 2) show that the retrieved AODs compare
15
favourably with the AERONET reference data. Some areas require further study for the enhancement of the results. Large discrepancies in these areas might be due to the basic assumptions in the algorithm which do not strictly apply (e.g. thek ratio, the use of external mixtures for aerosol particles), the used aerosol modelling is not flex-ible enough, or residual cloud contamination. The validation presented here is based
20
on AERONET reference data over land. Data over ocean are available from, e.g., the marine aerosol network (MAN, see e.g. Smirnov et al., 2009), but for the chosen year 2008 there are insufficient data for statistical evaluation.
The uncertainty characterization currently takes into account the propagation of the measurement error through the retrieval process. For over land areas this works
rea-25
AMTD
6, 4039–4075, 2013AATSR aerosol retrieval uncertainty
P. Kolmonen et al.
Title Page
Abstract Introduction
Conclusions References
Tables Figures
◭ ◮
◭ ◮
Back Close
Full Screen / Esc
Printer-friendly Version Interactive Discussion
Discussion
P
a
per
|
Dis
cussion
P
a
per
|
Discussion
P
a
per
|
Discussio
n
P
a
per
|
reflectance leading to low measured TOA reflectance. A more correct uncertainty over ocean could be computed by adding a sea surface modeling error. This error has been reported to be about 10 % for a similar kind of ocean surface model as is used in the ASV algorithm (Sayer et al., 2009).
When the AOD uncertainty is compared with the discrepancies in the AERONET
5
validation (Fig. 6) a statistical similarity between the uncertainty and the discrepancy can be seen. The two entities are not, however, directly comparable. The uncertainty is affected not only by the reflectance of aerosols but also by the reflectance of the underlying surface whereas the discrepancy can have various reasons.
One of the shortcomings of the current ADV algorithm is the exclusion of bright
10
surface. It is not yet clear why thek ratio assumption does not hold for bright surface areas. One possible way to overcome this issue would be to implement the surface treatment from North et al. (1999), which has been shown to behave reliably in high surface reflectance conditions.
The ENVISAT satellite ceased to provide data in April 2012. This does not, however,
15
mean that the presented retrieval algorithms are now obsolete. On one hand, the pro-cessing of the whole 17 yr ATSR-2–AATSR data will provide a time series for studies of global changes in aerosol conditions and it will act as a valuable reference for global climate model studies. On the other hand, the developed algorithms can be applied to data from the AATSR-like Sea and Land Surface Temperature Radiometer (SLSTR)
20
instrument on the ESA/GMES Sentinel-3 mission which is planned for launch in April 2014.
The conclusion from the present study is that, although more work is still needed, re-sults of the current ADV/ASV retrieval algorithm compare favourably with independent ground-based reference data and are suitable for characterizing local or global aerosol
25
conditions and, in addition, can be used for data assimilation purposes.
Acknowledgements. This work was funded by the European Space Agency – Climate Change
AMTD
6, 4039–4075, 2013AATSR aerosol retrieval uncertainty
P. Kolmonen et al.
Title Page
Abstract Introduction
Conclusions References
Tables Figures
◭ ◮
◭ ◮
Back Close
Full Screen / Esc
Printer-friendly Version Interactive Discussion
Discussion
P
a
per
|
Dis
cussion
P
a
per
|
Discussion
P
a
per
|
Discussio
n
P
a
per
|
Implementation (MACC II) projects. The authors wish to acknowledge the AERONET project for providing the ground-based reference data.
References
AATSR Product Handbook: Issue 2.2, European Space Agency, available at: http://envisat.esa. int/handbooks/aatsr/, (last access: 12 December 2012), 2007. 4056
5
Abdou, W. A., Martonchik, J. V., Kahn, R. A., West, R. A., and Diner, D. J.: A modified linear-mixing method for calculating atmospheric path radiances of aerosol mixtures, J. Geophys. Res., 102, 16883–16888, 1997. 4044
Benedetti, A., Morcrette, J.-J., Boucher, O., Dethof, A., Engelen, R. J., Fisher, M., Flentje, H., Huneeus, N., Jones, L., Kaiser, J. W., Kinne, S., Mangold, A., Razinger, M., Simmnons, A. J.,
10
and Suttie, M.: Aerosol analysis and forecast in the European Centre for Medium-Range Weather Forecasts Integrated Forecast System: 2. data assimilation, J. Geophys. Res., 114, D13205, doi:10.1029/2008JD011115, 2009. 4041
Cox, C. and Munk, W.: Measurement of the roughness of the sea surface from photographs of the sun’s glitter, J. Opt. Soc. Am., 44, 838–850, 1954. 4054
15
Curier, L., de Leeuw, G., Kolmonen, P., Sundstr ¨om, A.-M., Sogacheva, L., and Bennouna, Y.: Aerosol retrieval over land using the (A)ATSR dual-view algorithm, in: Satellite Aerosol Re-mote Sensing over Land, edited by: Kokhanovsky, A. A. and de Leeuw, G., Springer, Berlin, 2009. 4042, 4043
de Haan, J. F., Bosma, P. B., and Hovenier, J. W.: The adding method for multiple scattering
20
computations of polarized light, Astron. Astrophys., 183, 371–381, 1987. 4047
de Leeuw, G., Holzer-Popp, T., Bevan, S., Davies, W., Descloitres, J., Grainger, R. G., Gries-feller, J., Heckel, A., Kinne, S., Kl ¨user, L., Kolmonen, P., Litvinov, P., Martynenko, D., North, P. J. R., Ovigneur, B., Pascal, N., Poulsen, C., Ramon, D., Schulz, M., Siddans, R., Sogacheva, L., Tanr ´e, D., Thomas, G. E., Virtanen, T. H., von Hoyningen-Huene, W.,
Voun-25
tas, M., and Pinnock, S.: Evaluation of seven European aerosol optical depth retrieval algo-rithms for climate analysis, Remote Sens. Environ., in press, 2013.
Flowerdew, R. J. and Haigh, J. D.: An approximation to improve accuracy in the derivation of surface reflectances from multi-look satellite radiometers, Geophys. Res. Lett., 22, 1693– 1696, 1995. 4045