AMTD
4, 33–71, 2011Remote sensing of aerosols over snow using infrared AATSR
observations
L. G. Istomina et al.
Title Page
Abstract Introduction
Conclusions References
Tables Figures
◭ ◮
◭ ◮
Back Close
Full Screen / Esc
Printer-friendly Version
Interactive Discussion
Discussion
P
a
per
|
Dis
cussion
P
a
per
|
Discussion
P
a
per
|
Discussio
n
P
a
per
|
Atmos. Meas. Tech. Discuss., 4, 33–71, 2011 www.atmos-meas-tech-discuss.net/4/33/2011/ doi:10.5194/amtd-4-33-2011
© Author(s) 2011. CC Attribution 3.0 License.
Atmospheric Measurement Techniques Discussions
This discussion paper is/has been under review for the journal Atmospheric Measure-ment Techniques (AMT). Please refer to the corresponding final paper in AMT
if available.
Remote sensing of aerosols over snow
using infrared AATSR observations
L. G. Istomina1, W. von Hoyningen-Huene1, A. A. Kokhanovsky1, E. Schultz2, and J. P. Burrows1
1
Institute of Environmental Physics, University of Bremen, Bremen, Germany 2
Institute of Mineralogy and Geochemistry, KIT Karlsruhe, Karlsruhe, Germany
Received: 22 November 2010 – Accepted: 14 December 2010 – Published: 10 January 2011 Correspondence to: L. G. Istomina ([email protected])
Published by Copernicus Publications on behalf of the European Geosciences Union.
AMTD
4, 33–71, 2011Remote sensing of aerosols over snow using infrared AATSR
observations
L. G. Istomina et al.
Title Page
Abstract Introduction
Conclusions References
Tables Figures
◭ ◮
◭ ◮
Back Close
Full Screen / Esc
Printer-friendly Version
Interactive Discussion
Discussion
P
a
per
|
Dis
cussion
P
a
per
|
Discussion
P
a
per
|
Discussio
n
P
a
per
|
Abstract
Infrared (IR) retrievals of aerosol optical thickness (AOT) are challenging because of the low reflectance of aerosol layer at longer wavelengths. In this paper we present a closer analysis of this problem, performed with radiative transfer (RT) simulations for coarse and accumulation mode of four main aerosol components. It shows the strong
5
angular dependence of aerosol IR reflectance at low solar elevations resulting from significant asymmetry of aerosol phase function at these wavelengths. This results in detectable values of aerosol IR reflectance at certain non-nadir observation angles providing the advantage of multiangle remote sensing instruments for a retrieval of AOT at longer wavelengths. Such retrievals can be of importance e.g. in case of a
10
very strong effect of the surface on the top of atmosphere (TOA) reflectance in the visible range of spectrum. In current work, a new method to retrieve AOT over snow has been developed using the measurements of Advanced Along Track Scanning Ra-diometer (AATSR) on board the ENVISAT satellite. The algorithm uses AATSR channel at 3.7 µm and utilizes its dual-viewing observation technique implying the forward view
15
with an observation zenith angle around 55 degrees and the nadir view. It includes cloud/snow discrimination, extraction of the atmospheric reflectance out of measured brightness temperature (BT) at 3.7 µm, interpolation of look-up tables (LUTs) for a given aerosol reflectance. The algorithm uses LUTs, separately simulated with RT forward calculations. The resulting AOT at 500 nm is estimated from the value at 3.7 µm using
20
a fixed Angstr ¨om parameter.
The presented method has been validated against ground-based Aerosol Robotic Network (AERONET) data for 4 high Arctic stations and shows good agreement.
A case study has been performed at W-Greenland on 5 July 2008. The day before was characterized by a noticeable dust event. The retrieved AOT maps of the region
25
AMTD
4, 33–71, 2011Remote sensing of aerosols over snow using infrared AATSR
observations
L. G. Istomina et al.
Title Page
Abstract Introduction
Conclusions References
Tables Figures
◭ ◮
◭ ◮
Back Close
Full Screen / Esc
Printer-friendly Version
Interactive Discussion
Discussion
P
a
per
|
Dis
cussion
P
a
per
|
Discussion
P
a
per
|
Discussio
n
P
a
per
|
scale atmospheric circulation transporting the mobilised mineral dust upslope, after its intrusion into the upper branch of the circulation.
The performed study of atmospheric reflectance at 3.7 µm also shows possibilities of detection and retrievals of cloud properties over snow surface.
1 Introduction
5
The large surface spectral reflectance poses significant challenges for the retrieval of AOT above snow from observations of the upwelling back scattered radiation at the top of the atmosphere in the visible spectral range. At the same time, satellite retrievals of AOT over snow are necessary to assess and understand the role of aerosol at high latitudes. Aerosols affect energy balance of the polar regions in many ways, both on
10
local and global scale (Tomasi et al., 2007). The impact of aerosol particles on climate is considered to be one of the largest uncertainties in climate modeling. One of the main reasons for this uncertainty is the lack of data on global scale, especially in the polar regions. Ground based measurements with significant temporal coverage are only available at a few locations either at the North or the South Poles. In order to
re-15
solve the uncertainty of aerosol amount, transport and influence on climate, significant temporal and spatial coverage is needed. This can only be achieved using active or passive measurements made from orbiting platforms.
The fraction of the radiation being reflected from a snow surface in the observed TOA reflectance at visible wavelengths is large due to the large spectral reflectance
20
of snow surfaces and the relatively low atmospheric reflectance. In addition a wide variety of snow types and temporal evolution of snow properties cause variation of snow bidirectional reflection function (BRDF). Attempts to remove this large unknown surface effect from the TOA reflectance by using an assumed snow model, lead to strong surface contamination of resulting AOT (Istomina et al., 2009), because the
25
assumed surface model cannot account for the existing BRDF variability. Better results can be achieved by using the advantage of multiangle observations (Istomina et al.,
AMTD
4, 33–71, 2011Remote sensing of aerosols over snow using infrared AATSR
observations
L. G. Istomina et al.
Title Page
Abstract Introduction
Conclusions References
Tables Figures
◭ ◮
◭ ◮
Back Close
Full Screen / Esc
Printer-friendly Version
Interactive Discussion
Discussion
P
a
per
|
Dis
cussion
P
a
per
|
Discussion
P
a
per
|
Discussio
n
P
a
per
|
2010a) in order to reduce at least the effect of snow surface spectral reflectance on the TOA reflectance. However, the variable BRDF shape of snow still causes offsets in AOT retrieved on global scale.
Spangenberg et al. (2001) discussed the influence of infrared atmospheric re-flectance onto AATSR brightness temperature (BT) at 3.7 µm with respect to the
prob-5
lem of cloud detection over snow. This idea has been successfully applied for cloud screening over snow using AATSR channel at 3.7 µm in combination with other AATSR channels (Istomina et al., 2010b). We use this cloud screening approach in this work, too (see Sect. 4.1). Good infrared calibration of the AATSR instrument (Smith et al., 2001) provides the possibility of applying the same approach also to aerosol layers.
10
This paper describes a new retrieval approach to determine AOT over snow. The fol-lowing sections of this work address the analysis of snow and aerosol infrared proper-ties (Sects. 2 and 3), a description of the recently developed aerosol retrieval algorithm at 3.7 µm (Sect. 4) and its validation by comparison with AERONET measurements (Sect. 5).
15
2 Infrared scattering characteristics of snow surface
Thermal properties of snow have been measured (Hori et al., 2006; English et al., 1995) and show that due to its density snow is very close to a black body which emits according its physical temperature. Wald (1994) showed that the reflection of snow is very low in the whole IR range of AATSR (at 3.7, 10.8 and 12 µm). This is also
20
confirmed by e.g. snow emissivity measurements in MODIS USCB Emissivity Library. Measured emissivity is quite stable throughout the thermal region of the spectrum (vari-ation around 2%). Hori et al. (2006) show that emissivity of snow for a given temper-ature depends on its physical parameters such as grain size and liquid water content. However, these dependencies cause a variation of snow emissivity of less than 5%.
25
AMTD
4, 33–71, 2011Remote sensing of aerosols over snow using infrared AATSR
observations
L. G. Istomina et al.
Title Page
Abstract Introduction
Conclusions References
Tables Figures
◭ ◮
◭ ◮
Back Close
Full Screen / Esc
Printer-friendly Version
Interactive Discussion
Discussion
P
a
per
|
Dis
cussion
P
a
per
|
Discussion
P
a
per
|
Discussio
n
P
a
per
|
inaccuracies of this approach, by using AATSR nadir view reflectance at 3.7 µm (see e.g., Sect. 4.2).
3 Infrared scattering characteristics of atmospheric aerosols depending on the particle size
In order to study the behavior of aerosol scattering characteristics depending on size
5
distribution and wavelength we have calculated aerosol phase functions and single scattering albedo for spherical polydisperse particles with the refractive indices cor-responding to four main aerosol components (water soluble, oceanic, soot, mineral dust) for two wavelengths – 550 nm and 3.7 µm. We used the Lorenz-Mie theory (De Rooij and Van Der Stap, 1984; Mishchenko et al., 1999) and lognormal size distribution
10
Eq. (1).
n(r)=const·r−1exp "
−
(lnr−lnrg)2
2ln2σg
#
(1)
where const is chosen in such a way thatR∞
0 n(r)dr=1.
To represent coarse and accumulation mode particles, we took the geometric stan-dard deviation which has been measured during an Arctic smoke event (Treffeisen et
15
al., 2007), 0.22, and average size parameters of 1.7 µm for the coarse mode, and 0.5 µm for the accumulation mode, with the effective radius equal to 2.9 µm for the coarse mode and 0.64 µm for the accumulation mode. Smaller particles (nucleation and Aitken modes) were not taken into account in this study.
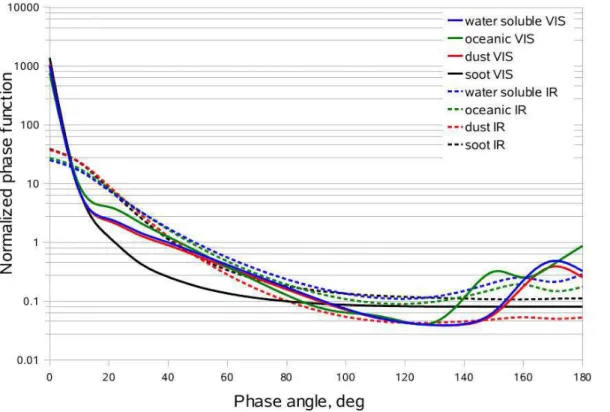
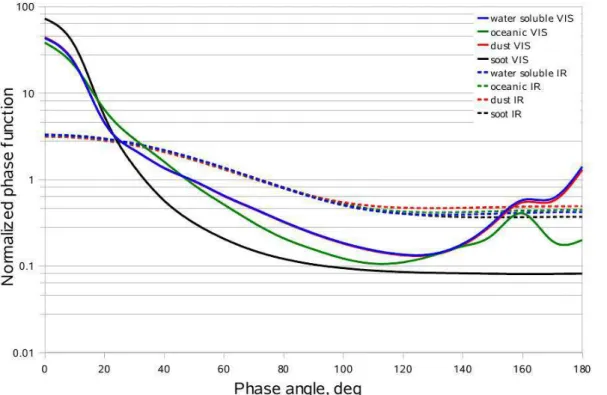
The result of the calculation is shown in Fig. 1 for the coarse mode and in Fig. 2
20
for the accumulation mode. The refractive indices (Kokhanovsky, 2004) and calculated single scattering albedo are shown in Table 1 for 550 nm and in Table 2 for 3.7 µm.
It is readily visible that phase functions of water soluble, oceanic and dust aerosol components of both sizes show significant back- and forward scattering details at
AMTD
4, 33–71, 2011Remote sensing of aerosols over snow using infrared AATSR
observations
L. G. Istomina et al.
Title Page
Abstract Introduction
Conclusions References
Tables Figures
◭ ◮
◭ ◮
Back Close
Full Screen / Esc
Printer-friendly Version
Interactive Discussion
Discussion
P
a
per
|
Dis
cussion
P
a
per
|
Discussion
P
a
per
|
Discussio
n
P
a
per
|
550 nm, but the forward scattering peak of accumulation mode is weaker than that of coarse mode by approximately one order of magnitude. The magnitude of backscat-tering details is very similar for both particle sizes. For the coarse mode, the overall asymmetry of the phase functions at 3.7 µm and 550 nm is very similar, with the ex-ception of soot component, which shows a slightly lower asymmetry at phase angles
5
larger than 20 degrees in comparison to the other components. The forward scattering peaks, however, are similar.
For the accumulation mode, the asymmetry of all the phase functions at 550 nm is clearly larger in comparison to the asymmetry at 3.7 µm.
To study the influence of these phase function details on the angular reflectance with
10
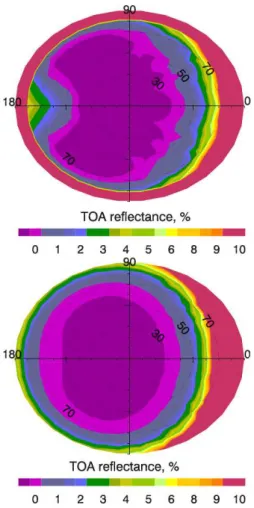
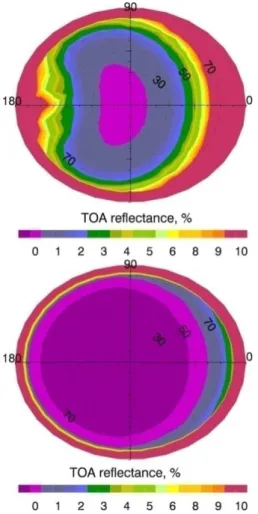
respect to wavelength change, we performed RT simulations. For this purpose we used the forward RT model SCIATRAN developed at the University of Bremen (Rozanov et al., 2005). The TOA reflectance over black surface for accumulation and coarse modes of dust aerosol component at 550 nm and 3.7 µm for aerosol optical thickness 0.1 was calculated. The result is shown in Fig. 3 for coarse mode and in Fig. 4 for accumulation
15
mode.
For the given AOT=0.1 the reflectance patterns are similar for both sizes and wave-lengths, showing decreased reflectance around nadir and corresponding increase in the forward and backscattering directions at 550 nm. The backscattering peak is absent at 3.7 µm, which corresponds to the shape of phase functions discussed above. The
20
expected extreme spectral decrease of reflectance is visible for accumulation mode, in contrast to relatively unchanged magnitudes of reflectance of the coarse mode. It is very important to notice that even for the accumulation mode the magnitude of IR reflectance in the upper forward quarter-sphere (azimuth angle less than 90 degrees) is of the same order as that at 550 nm, nadir view. This makes it possible for the IR
25
AMTD
4, 33–71, 2011Remote sensing of aerosols over snow using infrared AATSR
observations
L. G. Istomina et al.
Title Page
Abstract Introduction
Conclusions References
Tables Figures
◭ ◮
◭ ◮
Back Close
Full Screen / Esc
Printer-friendly Version
Interactive Discussion
Discussion
P
a
per
|
Dis
cussion
P
a
per
|
Discussion
P
a
per
|
Discussio
n
P
a
per
|
4 Aerosol optical thickness retrieval scheme
As it can be seen in the previous sections, the task of AOT retrieval over snow at 3.7 µm very much resembles the standard task of aerosol retrieval over dark surface in the visible range of spectrum. Some peculiarities, however, still exist. Some of them sim-plify the task, as e.g. the negligible effect of Rayleigh scattering and, correspondingly,
5
the surface elevation at 3.7 µm, while others are more challenging, e.g. the accurate extraction of atmospheric reflectance from the measured AATSR BT at 3.7 µm. The theoretical background and the details of LUT calculations are described in the further 3 subsections. Although current work is dedicated to aerosol retrieval, the discussed approach can also be used for the detection and retrieval of cloud properties over snow,
10
providing an advantageous alternative to existing cloud screening methods over snow.
4.1 Snow/cloud discrimination
The cloud/snow discrimination was performed as introduced in Istomina et al. (2010b). It uses a combination of relative thresholds in seven AATSR channels in order to discriminate the spectral behavior of clear snow scene from that of cloud, land, ocean,
15
etc. These criteria connect nadir top of atmosphere reflectances in visible Eqs. (2) and (3), near-infrared (Eq. 4) and brightness temperatures in thermal infrared (Eqs. 5 and 6) regions of spectrum.
BT(3.7 µm)−BT(10.8 µm)
BT(3.7 µm)
<3% (2)
BT(3.7 µm)−BT(12 µm)
BT(3.7 µm)
<3% (3)
20
RTOA(0.87 µm)−RTOA(1.6 µm)
RTOA(0.87 µm) >80% (4)
AMTD
4, 33–71, 2011Remote sensing of aerosols over snow using infrared AATSR
observations
L. G. Istomina et al.
Title Page
Abstract Introduction
Conclusions References
Tables Figures
◭ ◮
◭ ◮
Back Close
Full Screen / Esc
Printer-friendly Version
Interactive Discussion
Discussion
P
a
per
|
Dis
cussion
P
a
per
|
Discussion
P
a
per
|
Discussio
n
P
a
per
|
RTOA(0.87 µm)−RTOA(0.66 µm)
RTOA(0.87 µm) <10% (5)
RTOA(0.66 µm)−RTOA(0.55 µm) RTOA(0.66 µm)
<
40% (6)
While the visible (VIS) and near-infrared (NIR) criteria (Eqs. 2–4) select scenes with the spectral behavior similar to snow spectrum, the thermal infrared (TIR) thresholds (Eqs. 5 and 6) distinguish cloud free areas over surfaces with emissivity close to unity
5
(snow, open ocean). The combination of both VIS/NIR and TIR criteria makes it pos-sible to distinguish various states of the system “surface+atmosphere”. For example, cloud free case would correspond to conditions (Eqs. 5 and 6) being true, due to the ab-sence of “stray” cloud reflectance at 3.7 µm. On the contrary, if the TIR criteria (Eqs. 5 and 6) are false, there is a non black body present in the scene – either a cloud, or
10
e.g. bare soil area. True VIS (Eqs. 2 and 3) and NIR criteria (Eq. 4) mean that the observed spectrum is close to a snow spectrum, which could mean snow, ice cloud, or thin water cloud over snow as well. If at least one of VIS/NIR criteria is false, there is a possibility of either a thick water cloud with the NIR (Eq. 4) criterion failing, or surface which a spectrum different from that of snow (e.g. ocean, bare soil, vegetation, etc).
15
4.2 Theoretical basis of aerosol optical thickness retrieval in the infrared
It is known that AATSR brightness temperature (BT) product measured at 3.7 µm is contaminated by atmospheric reflectance. Spangenberg et al. (2001) suggested a way to remove this contamination and extract reflectance ρatm(3.7,µ0,µ,φ) from the BT. This approach has been initially meant to be used for cloud/snow discrimination, as
20
AMTD
4, 33–71, 2011Remote sensing of aerosols over snow using infrared AATSR
observations
L. G. Istomina et al.
Title Page
Abstract Introduction
Conclusions References
Tables Figures
◭ ◮
◭ ◮
Back Close
Full Screen / Esc
Printer-friendly Version
Interactive Discussion
Discussion
P
a
per
|
Dis
cussion
P
a
per
|
Discussion
P
a
per
|
Discussio
n
P
a
per
|
however, good calibration of IR channels of AATSR (better than 0.1 K according to Smith et al., 2001) makes it possible to use this effect for AOT retrieval.
In order to utilize lookup table approach to make the inversion and retrieve AOT, we need to express the measured top of atmosphere radiances analytically. Let us use reflectancesρrather than radiancesI:
5
ρ= πI
µ0f (7)
wheref is the solar flux at the top of the atmosphere, and θ0=arccosµ0 is the solar
zenith angle.
Assuming that the atmosphere and aerosol load are horizontally uniform and have a total optical thickness τ, and underlying surface is Lambertian, one can write the
10
well-known expression:
ρTOA(λ,µ0,µ,φ)=ρatm(λ,µ0,µ,φ)+ρsfc(λ)·T1(λ,µ0)T2(λ,µ)
1−ρsfc(λ)·s(λ)
(8)
where θ=arccosµ is the observation zenith angle, φ is the relative azimuth an-gle, ρTOA(λ,µ0,µ,φ) is the total reflectance of the system “surface+atmosphere”, ρatm(λ,µ0,µ,φ) is the atmospheric reflectance (the reflectance of the aerosol,
15
Rayleigh scattering, ozone absorption), s(λ) is the atmospheric hemispherical
albedo, T1(λ,µ0)=E(µ0)+exp(−τ/µ0) is the atmospheric transmittance from the
top-of-atmosphere to the surface,T2(λ,µ)=E(µ)+exp(−τ/µ) is the total atmospheric trans-mittance from the surface to a receiver (e.g., placed on a satellite), E(µ0) and E(µ) are diffuse transmittances from top-of-atmosphere to the surface and from the surface
20
to the receiver, respectively, exp(−τ/µ0) and exp(−τ/µ) are the direct transmittances from top-of-atmosphere to the surface and from the surface to the receiver, respec-tively,ρsfc(λ) is the Lambertian reflectance of the surface.
Of course, Eq. (8) is still valid at 3.7 µm and can be written as:
ρTOA(3.7,µ0,µ,φ)=ρaer(3.7,µ0,µ,φ)+ρsfc(3.7) (9)
25
AMTD
4, 33–71, 2011Remote sensing of aerosols over snow using infrared AATSR
observations
L. G. Istomina et al.
Title Page
Abstract Introduction
Conclusions References
Tables Figures
◭ ◮
◭ ◮
Back Close
Full Screen / Esc
Printer-friendly Version
Interactive Discussion
Discussion
P
a
per
|
Dis
cussion
P
a
per
|
Discussion
P
a
per
|
Discussio
n
P
a
per
|
where θ=arccosµ is the observation zenith angle, φ is the relative azimuth angle,
ρTOA(3.7,µ0,µ,φ) is the calculated reflectance of the system “surface+atmosphere” at
3.7 µm,ρaer(3.7,µ0,µ,φ) is the aerosol reflectance at 3.7 µm (interpolated from LUT). Here we neglect Rayleigh scattering and multiple scattering between the surface and the atmosphere, and assume that AOT is very small.
5
To estimate ρTOA(3.7,µ0,µ,φ) from BT (3.7 µm), we invert the Planck function in order to find the temperature corresponding to the radiance measurement at 3.7 µm and extract the reflectance part of it. This method used by Allen et al. (1990), Trepte et al. (1999), Spangenberg et al. (2001). The radiance measured at 3.7 µm can be expressed as following:
10
L3.7 µm=ε3.7 µm·B3.7 µm(Tsurf)+ρTOA(3.7,µ0,µ,φ)L0µ0 (10)
whereε3.7 µmis the surface emittance at 3.7 µm, B3.7 µm(Tsurf) is the Planck function at 3.7 µm for the surface temperature, which is approximated by measured BT at 12 µm.
L0is the incident solar radiance at 3.7 µm.
The first term of right hand side of Eq. (10) is the contribution to the measured
15
radiance from the thermal emission of the surface assuming the transmittance of the atmosphere to be equal to 1. The second term on the right hand side is the contribution to the measured radiance due to the solar reflection. The amount of the reflected solar radiance reaching the satellite is determined by the incident solar radianceL0weighted by the cosine of the solar zenith angleµ0and the bidirectional reflectance of the surface
20
and the atmosphereρTOA(3.7,µ0,µ,φ).
Using Eq. (10), we can write:
ρTOA(3.7,µ0,µ,φ)=B3.7 µm(T3.7 µm)−ε3.7 µm·B3.7 µm(T12 µm)
µ0·S3.7 µm
(11)
whereT3.7 µmis the measured 3.7 µm brightness temperature,T12 µmis the measured 12 µm brightness temperature,µ0is the cosine of solar zenith angle,S3.7 µmis the
so-25
lar constant at 3.7 µm (3.47 W m−2µm−1),ε3.7 µmis the clear snow emittance,B3.7 µm
AMTD
4, 33–71, 2011Remote sensing of aerosols over snow using infrared AATSR
observations
L. G. Istomina et al.
Title Page
Abstract Introduction
Conclusions References
Tables Figures
◭ ◮
◭ ◮
Back Close
Full Screen / Esc
Printer-friendly Version
Interactive Discussion
Discussion
P
a
per
|
Dis
cussion
P
a
per
|
Discussion
P
a
per
|
Discussio
n
P
a
per
|
It is important to note that in case of surface being a perfect black body, the term
ρsfc(3.7) in Eq. (9) is equal to zero. However, snow emissivityε3.7 µm may be not con-stant throughout the scene, therefore surface contamination can be still possible and is included in Eq. (9). As can be seen from Figs. 1 and 2, aerosol reflectance in the nadir direction is negligibly small. Within this assumption, relatively high nadir values of
cal-5
culatedρTOA(3.7,µ0,0,φ) would mean that emissivityε3.7 µmused in the calculation is different from the real emissivity of the scene, and ρTOA(3.7,µ0,0,φ) is nothing but the surface contamination which needs to be subtracted from the forward TOA reflectance
ρTOA(3.7,µ0,55,φ) in order to get the forward aerosol reflectanceρaer(3.7,µ0,55,φ). Within the assumption of no angular variability of snow emissivity, we can get the
10
surface-free aerosol reflectance:
ρaer(3.7,µ0,55,φ)=ρTOA(3.7,µ0,55,φ)−ρTOA(3.7,µ0,0,φ) (12) Thisρaer(3.7,µ0,55,φ) is used for the LUT interpolation (Sect. 4.3).
Our particular case of low sun angles requires careful accounting for airmasses, different from that usual to plane-parallel atmosphere model. For RT calculations of
15
LUTs, we use pseudospherical model of the atmosphere. To correct AATSR measured quantities, we use approximation described in Kasten and Young (1989). To perform the comparison of the retrieved AOTs to the ground based measurements, we bring all the AOTs at 3.7 µm to 500 nm using a fixed Angstr ¨om parameter equal to 1.0.
In order to check the performance of Eqs. (10) and (11), we performed RT
simu-20
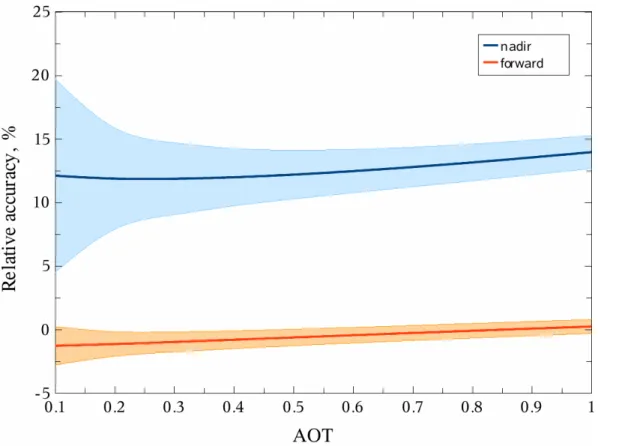
lations with the forward model SCIATRAN. For this we simulated 3.7 µm and 11 µm brightness temperatures for both nadir and forward views for a surface with the tem-perature 263 K and atmosphere with the AOT from 0 to 1 at 550 nm. The illumination angle is equal to 65◦, observation angles are 0◦ and 55◦, respectively, the relative
az-imuth angle is equal to 0◦. We also calculated the TOA reflectance at 3.7 µm for the
25
same conditions. The difference between the simulated TOA reflectance at 3.7 µm and the one reconstructed from the BT using Eq. (10) is shown in Fig. 5 for the both view-ing geometries. The color filled areas represent the error in the reconstructed TOA
AMTD
4, 33–71, 2011Remote sensing of aerosols over snow using infrared AATSR
observations
L. G. Istomina et al.
Title Page
Abstract Introduction
Conclusions References
Tables Figures
◭ ◮
◭ ◮
Back Close
Full Screen / Esc
Printer-friendly Version
Interactive Discussion
Discussion
P
a
per
|
Dis
cussion
P
a
per
|
Discussion
P
a
per
|
Discussio
n
P
a
per
|
reflectance at 3.7 µm, which occurs due to calibration error of AATSR BT product of
±0.1 K. The relative error of such a reconstruction is around 1% for the forward view
and around 12% for the nadir view, which appears to be reasonable as the nadir view reflectance has much smaller order of magnitude in comparison to the forward view reflectance.
5
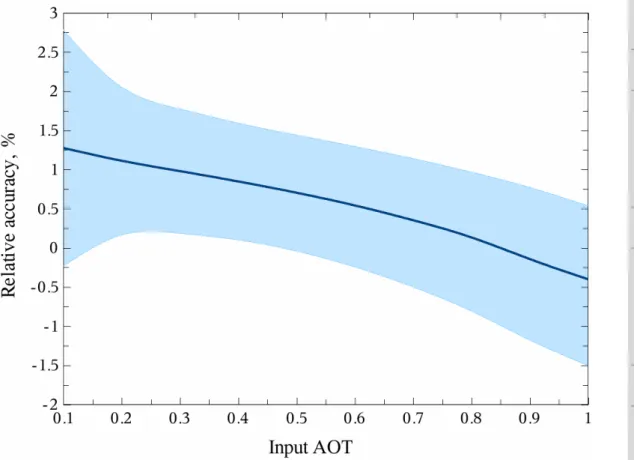
Then, these reconstructed TOA reflectances at 3.7 µm were used for the AOT re-trieval according to Eq. (10). The relative error of the retrieved AOT depending on the input AOTs is shown in Fig. 6. Again, the color filled areas represent the error in the retrieved AOT which occurs due to the calibration error in AATSR BT product of
±0.1 K. As our simulations did not include any surface, the simulated retrieval was per-10
formed without the surface correction introduced in Eq. (12). The simulation shows that the sensitivity of retrieved AOT to the AATSR BT calibration error of±0.1 K is around
several percent.
4.3 Calculation of LUTs for Arctic conditions
Unlike e.g. Rayleigh scattering, the phase function of which is well known, aerosol
re-15
flectance ρaer(λ,µ0,µ,φ) is variable due to different particle size distribution, particle shape and chemical composition, which affects single scattering albedo and extinction of aerosol layer. All this makes aerosol reflectance highly dependent on illumination-observation geometry and variable from one aerosol type to another. This makes it impossible to create one atmospheric LUT, which would represent aerosol properties
20
well on global scale. As current work is dedicated to AOT retrieval in Arctic region, we took the advantage of ground based aerosol measurements and created a LUT using phase function and single scattering albedo values measured in situ during one of the regular pollution events in Arctic (Treffeisen et al., 2007; Stohl et al., 2007). It has been measured on 23 March 2000 at Spitsbergen, Ny ˚Alesund, Svalbard, 78.923◦N 25
AMTD
4, 33–71, 2011Remote sensing of aerosols over snow using infrared AATSR
observations
L. G. Istomina et al.
Title Page
Abstract Introduction
Conclusions References
Tables Figures
◭ ◮
◭ ◮
Back Close
Full Screen / Esc
Printer-friendly Version
Interactive Discussion
Discussion
P
a
per
|
Dis
cussion
P
a
per
|
Discussion
P
a
per
|
Discussio
n
P
a
per
|
clear resemblance of this phase function to the IR phase functions in Fig. 1, despite of the much shorter wavelength. The LUT has been calculated for a variety of illumina-tion geometries (solar zenith angle from 35◦ to 85◦ with the step of 10◦), observation
geometries (viewing zenith angle from 0◦ to 90◦ with the step of 10◦) and relative az-imuth angles (from 0◦ to 180◦ with the step of 12◦). The AOT range was from 0 to 1 5
(at 500 nm). The LUT has been calculated with the single scattering albedo equal to 0.90 at 500 nm and 0.71 at 3.7 µm, which corresponds to the accumulation mode of the dust-like aerosol (see Tables 1 and 2). It is important to note that the current phase function corresponds to a certain particle size distribution (Angstr ¨om alpha value of 1.46). While this spectral slope of aerosol is quite common (as seen from AERONET
10
data for Arctic stations), larger or smaller particles can cause large scatter of the re-flectance data, which would cause similar scatter in the retrieved AOTs. This scatter can be reduced only with aerosol-type sensitive retrieval, which requires multispectral observations. Over snow this task is quite challenging and will be solved in the next versions of the retrieval.
15
5 Validation of the aerosol optical thickness retrieval
The algorithm has been validated against AERONET measurements for the four high
Arctic stations. The stations have been chosen to feature frequent AATSR
over-flights and therefore provide statistically significant amount of data. These stations are OPAL (N 79◦59′24′′N, 85◦56′20′′W, altitude 0 m), PEARL (80◦03′14′′N, 86◦25′01′′W, 20
altitude 615 m), Thule (76◦30′57′′N, 68◦46′08′′W, altitude 225 m), Kangerlussuaq
(66◦59′45′′N, 50◦37′15′′W, altitude 320 m). All these stations provide relatively con-tinuous and long datasets of ground based data, however they are located in the areas of complicated terrain. The first three stations are standing at the fjords of Queen Elis-abeth Islands and Knud Rasmussen Land, and the last one is located at W-Greenland
25
about 200 km from the coast. None of these stations are located on a permanently snow covered terrain, and depending on season they feature different surface types,
AMTD
4, 33–71, 2011Remote sensing of aerosols over snow using infrared AATSR
observations
L. G. Istomina et al.
Title Page
Abstract Introduction
Conclusions References
Tables Figures
◭ ◮
◭ ◮
Back Close
Full Screen / Esc
Printer-friendly Version
Interactive Discussion
Discussion
P
a
per
|
Dis
cussion
P
a
per
|
Discussion
P
a
per
|
Discussio
n
P
a
per
|
from clear snow in spring to bare soil and rocks in late summer and autumn. To avoid losing vast majority of the validation data, for each of the station we have chosen a posi-tion within 1 degree of longitude and 0.5 degree of latitude located on permanent snow cover (for Greenland) or on the sea ice (for Queen Elisabeth Islands). This allows us to shift from snow/bare soil/rocks mixture (which is screened out due to very little snow
5
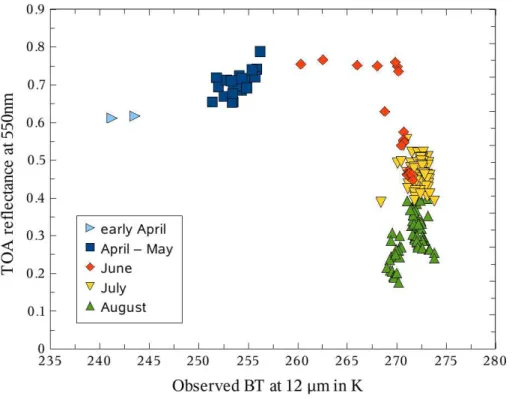
part) to melting sea ice (which is generally darker than snow but still keeps most of snow properties and is not screened out). On this basis the performance of the re-trieval for various surface types, both snow and sea ice was tested under different con-ditions. This is illustrated by an analysis of the validation dataset for e.g. station OPAL (see Fig. 8). It shows that most of the dataset points come from summer months and
10
feature quite low TOA reflectance at 550 nm together with quite high surface tempera-tures (yet below 0◦C). As these data have been cloud cleared and snow flagged, the
low TOA reflectance suggests the surface type “melting sea ice without snow cover”. Spring data, however, shows low temperatures and high TOA reflectances at 550 nm, which is an evidence of “snow covered sea ice”. AOT retrieval is possible over both of
15
these surface types.
Our validation dataset for stations PEARL contain approximately 200 points and for station OPAL 130 points from spring and summer of years 2007, 2008, 2009. Stations Thule and Kangerlussuaq gave less cloud free observations overlapping with AATSR overflights – around 40 points from years 2007 and 2008 for Thule, and 20 points from
20
years 2008 and 2009 for Kangerlussuaq.
All the data has been cloud screened and snow flagged. AERONET data with ex-treme values of Angstr ¨om coefficient for 440–870 nm (less than 0.5 and more than 2.0) were not taken into account. The maximum allowed time difference between the AATSR overflight and the AERONET measurement was equal to 15 min. We applied
25
AMTD
4, 33–71, 2011Remote sensing of aerosols over snow using infrared AATSR
observations
L. G. Istomina et al.
Title Page
Abstract Introduction
Conclusions References
Tables Figures
◭ ◮
◭ ◮
Back Close
Full Screen / Esc
Printer-friendly Version
Interactive Discussion
Discussion
P
a
per
|
Dis
cussion
P
a
per
|
Discussion
P
a
per
|
Discussio
n
P
a
per
|
500 nm, the comparison has to be performed at this wavelength. To estimate the AOT at 500 nm with the retrieval which utilizes AATSR channel at 3.7 µm, we use a fixed Angstr ¨om parameter equal to 1.0. The correlation plot for each station is showed in Fig. 9 (OPAL), Fig. 10 (PEARL), Fig. 11 (Thule), Fig. 12 (Kangerlussuaq). The dashed line represents the linear regression of the data.
5
It is visible that each of the correlation plots shows a larger scatter in the retrieved AOTs, the larger the AERONET AOT is. This is explained by a greater effect of the aerosol type and its spectral slope for larger AOT values. As the values of AERONET Angstr ¨om coefficient for 440–870 nm are ranging from 0.5 to 2.0, and our LUT has been created for 1.0 only, this large scatter is expected and will be corrected in the next
10
version of the algorithm. At AOTs less than 0.1 the retrieval works satisfactory with no significant over- or underestimation. As the vast majority of AOT values in the Arctic are below 0.1, the retrieved AOT maps can give a good estimate of the AOT distribution over snow.
6 Case study: dust formation and transport on Greenland during 4/5 July 2008
15
A noticeable dust event has been observed on 4 July 2008, in the vicinity of Kanger-lussuaq, W-Greenland. The dust event was triggered by a northeasterly wind breezing up during the morning and mobilising mineral dust from open soils along the Søndre Strømfjord (see Fig. 13). The dust cloud developed during the morning of a clear, sunny day. The maximum occurred in the early afternoon and gradually declined with
20
decreasing wind speed in late afternoon. Maximum temperature was 22◦C on this day. The relative air humidity during the day ranged below 35%. The dust cloud was ob-served about 15 km west of Kangerlussuaq reducing horizontal visibility down to about 10 km. The dust layer vertically grew during the day with increasing wind speed, reach-ing a maximal thickness of estimated 500 m above ground at early afternoon.
25
The following day, 5 July, was clear again but showed only weak winds. As expected no dust mobilisation was observed. However, a katabatic wind of a limited range was
AMTD
4, 33–71, 2011Remote sensing of aerosols over snow using infrared AATSR
observations
L. G. Istomina et al.
Title Page
Abstract Introduction
Conclusions References
Tables Figures
◭ ◮
◭ ◮
Back Close
Full Screen / Esc
Printer-friendly Version
Interactive Discussion
Discussion
P
a
per
|
Dis
cussion
P
a
per
|
Discussion
P
a
per
|
Discussio
n
P
a
per
|
experienced when approaching the ice sheet, but this wind did not reach highly erodi-ble periglacial landforms downslope the fjord. Those landforms comprising sandar, terraces, moraines, banks of braided streams or dunes act as particular source areas of coarse mineral dust.
The visible particle transport by katabatic winds in the Søndre Strømfjord can be
as-5
sumed as part of a circulation system including a downstream flow at ground level and an upstream flow at higher elevations. The downstream wind can be supposed govern-ing the particle transport near the surface away from the ice sheet. Still unknown is the question to what extent mobilized particles are able to raise up during transport pos-sibly due to turbulent mixing and thereby reaching the opposite directed flow at higher
10
elevation. In this case at least the finer fraction of windblown particles (2–3 µm) may be transported backwards towards the ice sheet. Near Kangerlussuaq, W-Greenland, the existence of such a backflow was confirmed by balloon measurements of Oerle-mans and Vugts (1993) and by investigation flights of Heinemann (1999). By these authors, the backflow was found ranging between 150 m (Oerlemans and Vugts, 1993)
15
and 1000 m a.g.l. (Heinemann, 1999).
The above mentioned dust cloud originating on 4 July was expected to significantly raise AOT. This enhanced AOT should allow us to detect the dust cloud by using a vari-ation of the Koschmieder equvari-ation suggested by B ¨aumer et al. (2008). The equvari-ation can be written as follows:
20
V =3.912zτ−1 (13)
whereV is the horizontal visibility,z is the height of the pollution layer,τis the AOT at 550 nm. For above mentioned parameters of the pollution event, AOT takes a value of approximately 0.4.
For the satellite retrieval we used the AATSR overflight on 5 July 2008, 14 h 46 min
25
AMTD
4, 33–71, 2011Remote sensing of aerosols over snow using infrared AATSR
observations
L. G. Istomina et al.
Title Page
Abstract Introduction
Conclusions References
Tables Figures
◭ ◮
◭ ◮
Back Close
Full Screen / Esc
Printer-friendly Version
Interactive Discussion
Discussion
P
a
per
|
Dis
cussion
P
a
per
|
Discussion
P
a
per
|
Discussio
n
P
a
per
|
dust mobilization is supposed. AATSR reflectances at visible wavelengths do not show any evidence of the increased aerosol load or different surface type at these points (see Fig.14, left panel for location near Kangerlussuaq and right panel for the opposite shore of Greenland). It is visible that the retrieved AOTs (Fig. 15, left panel) resemble the same pattern as calculated TOA reflectances at 3.7 µm (Fig. 15, right panel).
5
Figure 16 shows the map of retrieved AOT over Greenland after the discussed dust event, on 15 July 2008, 14 h 32 min 18 s, orbit number 33 330. No evidence of pollu-tion is visible in the Kangerlussuaq area, which proves that the increase of AOT near Kangerlussuaq on 5 July 2008 visible in the retrieved AOT map is not a surface feature, but an atmospheric pollution.
10
Despite of the obvious mineral dust cloud shown in Fig. 13, AERONET station Kangerlussuaq (66◦59′45′′N, 50◦37′15′′W) shows no evidence of a dust event nei-ther on 4 July nor on 5 July. The AOT and Angstr ¨om exponent measured at these days are 0.028 (at 500 nm) and 0.8 (440–870 nm) respectively. This discrepancy is possibly explainable by a non-uniform dust layer of very coarse particles. Due to the
inhomo-15
geneous structure and local flow dynamics, the AERONET instrument was not able to detect the higher particle concentrations at its specific location.
7 Conclusions
In current work we performed a comprehensive analysis of aerosol scattering charac-teristics at 3.7 µm using RT calculations to simulate TOA reflectance and phase
func-20
tions for coarse and accumulation modes of four main aerosol components. Strong angular dependence of aerosol IR reflectance makes it possible to retrieve AOT at 3.7 µm at some non-nadir angles. At the same time, aerosol reflectance is low for the nadir observation geometry, which allows us to use AATSR nadir observations at this wavelength for surface correction. Performed sensitivity study showed that AATSR
25
IR calibration error would affect the resulting AOT within the range of several percent. Therefore the formerly known method of inverting the Planck function in order to extract
AMTD
4, 33–71, 2011Remote sensing of aerosols over snow using infrared AATSR
observations
L. G. Istomina et al.
Title Page
Abstract Introduction
Conclusions References
Tables Figures
◭ ◮
◭ ◮
Back Close
Full Screen / Esc
Printer-friendly Version
Interactive Discussion
Discussion
P
a
per
|
Dis
cussion
P
a
per
|
Discussion
P
a
per
|
Discussio
n
P
a
per
|
the reflectance part from the BT product can be used for the AOT retrieval over snow. A simple LUT-based algorithm similar to traditional AOT retrievals over ocean is used to retrieve AOT over snow using calculated TOA reflectances at 3.7 µm. It has been validated against 4 high Arctic AERONET stations and shows good agreement with no systematic over- or underestimation for small AOT values below 0.1.
5
Therefore the presented retrieval can be used for AOT retrieval over snow in order to study the details of aerosol distribution and transport in Arctic at least at a qualitative level.
We expect the uncertainty of the retrieval to grow for the larger AOTs due to larger effect of aerosol spectral slope on such values. This can be solved with an aerosol type
10
sensitive retrieval, which should make use of several AATSR spectral channels and will be implemented in the next version of the retrieval.
A case study was performed for the dust event observed on 4 July 2008 along the Søndre Strømfjord (Kangerlussuaq) on W-Greenland. Fresh winds mobilized mineral dust from bare soil areas on that day. On 5 July the retrieved AOT map still shows an
15
obvious increase of AOT east of Kangerlussaq. The upstream position is explained by a small scale circulation transporting the mobilized dust in direction ice sheet by its upper branch. The retrieval also shows increased AOT on NE-Greenland. A similar mechanism of dust transport can be assumed to explain this so far unconfirmed dust event also occurring in the vicinity of a bare soil area. However, the assumed particle
20
transport has to be confirmed by vertical and horizontal aerosol measurement at the margin of the ice sheet in order to confirm the supposed transport of local mineral dust onto the ice sheet.
Acknowledgements. The authors are grateful to ESA for providing AATSR data, to R. Treffeisen and M. Stock for providing their aerosol phase function measurements, to V. Rozanov and 25
AMTD
4, 33–71, 2011Remote sensing of aerosols over snow using infrared AATSR
observations
L. G. Istomina et al.
Title Page
Abstract Introduction
Conclusions References
Tables Figures
◭ ◮
◭ ◮
Back Close
Full Screen / Esc
Printer-friendly Version
Interactive Discussion
Discussion
P
a
per
|
Dis
cussion
P
a
per
|
Discussion
P
a
per
|
Discussio
n
P
a
per
|
References
Allen, R. C., Durkee, P. A., and Wash, C. H.: Snow/cloud discrimination with multispectral satellite measurements, J. Appl. Meteorol., 29, 994–1004, 1990.
B ¨aumer, D., Vogel, B., Versick, S., Rinke, R., Mohler, O., and Schnaiter, M.: Relationship of visi-bility, aerosol optical thickness and aerosol size distribution in an ageing air mass over South-5
West Germany, Atmos. Environment, 42(5), 989–998, doi:10.1016/j.atmosenv.2007.10.017, 2008.
De Rooij, W. A. and Van der Stap, C. C. A. H.: Expansion of Mie scattering matrices in gener-alized spherical functions, Astron. Astrophys., 131, 237–248, 1984.
English, S. J., Jones, D. C., Hewison, T. J., Saunders, R. W., and Hallikainen, M.: Observa-10
tions of the emissivity of snow and ice surfaces from the SAAMEX and MACSI airborne campaigns, Geoscience and Remote Sensing Symposium, 1995, IGARSS’95, “Quantitative Remote sensing for Science and Applications”, International, vol. 2, 1493–1495, 1995. Heinemann, G.: The KABEG’97 field experiment: an aircraft based study of the katabatic wind
dynamics over the Greenlandic ice sheet, Bound.-Lay. Meteorol., 93, 75–116, 1999. 15
Hori, M., Aoki, T., Tanikawa, T., Motoyoshi, H., Hachikubo, A., Sugiura, K., Yasunari, T. J., Eide, H., Storvold, R., Nakajima, Y., and Takahashi, F.: In-situ measured spectral directional emissivity of snow and ice in the 8–14 µm atmospheric window, Remote Sens. Environ., 100, 486–502, 2006.
Istomina, L. G., von Hoyningen-Huene, W., Kokhanovsky, A. A., Rozanov, V. V., Schreier, M., 20
Dethloff, K., Stock, M., Treffeisen, R., Herber, A., and Burrows, J. P.: Sensitivity study of the dual-view algorithm for aerosol optical thickness retrieval over snow and ice, in: Proceedings of the 2nd MERIS/(A)ATSR user workshop, ESRIN, Frascati, Italy, 22–26 September 2008, ESA SP-666, 2009.
Istomina, L. G., von Hoyningen-Huene, W., Kokhanovsky, A. A., and Burrows, J. P.: Retrieval of 25
aerosol optical thickness in Arctic region using dual-view AATSR observations, in: Proceed-ings of ESA Atmospheric Science Conference, Barcelona, Spain, 7–11 September 2009, ESA SP-676, 2010a.
Istomina, L. G., von Hoyningen-Huene, W., Kokhanovsky, A. A., and Burrows, J. P.: The detec-tion of cloud-free snow-covered areas using AATSR measurements, Atmos. Meas. Tech., 3, 30
1005–1017, doi:10.5194/amt-3-1005-2010, 2010b.
AMTD
4, 33–71, 2011Remote sensing of aerosols over snow using infrared AATSR
observations
L. G. Istomina et al.
Title Page
Abstract Introduction
Conclusions References
Tables Figures
◭ ◮
◭ ◮
Back Close
Full Screen / Esc
Printer-friendly Version
Interactive Discussion
Discussion
P
a
per
|
Dis
cussion
P
a
per
|
Discussion
P
a
per
|
Discussio
n
P
a
per
|
Kasten, F. and Young, A. T.: Revised optical air mass tables and approximation formula, Appl. Optics, 28(22), 4735–4738, 1989.
Kokhanovsky, A. A.: Light Scattering Media Optics: Problems and Solutions, 3rd edition, Springer-Praxis Books in Environmental Sciences, Chichester, 2004.
Mishchenko, M. I., Dlugach, J. M., Yanovitskij, E. G., and Zakharova, N. T.: Bidirectional re-5
flectance of flat, optically thick particulate layers: an efficient radiative transfer solution and applications to snow and soil surfaces, J. Quant. Spectrosc. Ra., 63, 409–432, 1999. Oerlemans, J. and Vugts, H. F.: A meteorological experiment in the melting zone of the
Green-land ice sheet, B. Am. Meteorol. Soc., 74, 355–365, 1993.
Rozanov, A. V., Rozanov, V. V., Buchwitz, M., Kokhanovsky, A. A., and Burrows, J. P.: SCIA-10
TRAN 2.0 – new radiative transfer model for geophysical applications in the 175–2400 nm spectral range, Adv. Space Res., 36, 1015–1019, 2005.
Smith, D. L., Delderfield, J., Drummond, D., Edwards, T., Mutlow, C. T., Read, P. D., and Toplis, G. M.: Calibration of the AATSR instrument, Adv. Space Res., 28(1), 31–39, 2001. Spangenberg, D. A., Chakrapani, V., Doelling, D. R., Minnis, P., and Arduini, R. F.: Development 15
of an automated Arctic cloud mask using clear-sky satellite observations taken over the SHEBA and ARM NSA sites, in: Proc. 6th Conf. on Polar Meteor. and Oceanography, San Diego, CA, 14–18 May 2001, 246–249, 2001.
Stohl, A., Berg, T., Burkhart, J. F., Fjæraa, A. M., Forster, C., Herber, A., Hov, Ø., Lunder, C., McMillan, W. W., Oltmans, S., Shiobara, M., Simpson, D., Solberg, S., Stebel, K., Str ¨om, 20
J., Tørseth, K., Treffeisen, R., Virkkunen, K., and Yttri, K. E.: Arctic smoke - record high air pollution levels in the European Arctic due to agricultural fires in Eastern Europe in spring 2006, Atmos. Chem. Phys., 7, 511–534, doi:10.5194/acp-7-511-2007, 2007.
Tomasi, C., Vitale, V., Lupi, A., Di Carmine, C., Campanelli, M., Herber, A., Treffeisen, R., Stone, R. S., Andrews, E., Sharma, S., Radionov, V., von Hoyningen-Huene, W., Stebel, K., 25
Hansen, G. H., Myhre, C. L., Wehrli, C., Aaltonen, V., Lihavainen, H., Virkkula, A., Hillamo, R., Str ¨om, J., Toledano, C., Cachorro, V. E., Ortiz, P., de Frutos, A. M., Blindheim, S., Frioud, M., Gausa, M., Zielinski, T., Petelski, T., and Yamanouchi, T.: Aerosols in polar regions: a his-torical overview based on optical depth and in situ observations, J. Geophys. Res., 112, D16205, doi:10.1029/2007JD008432, 2007.
AMTD
4, 33–71, 2011Remote sensing of aerosols over snow using infrared AATSR
observations
L. G. Istomina et al.
Title Page
Abstract Introduction
Conclusions References
Tables Figures
◭ ◮
◭ ◮
Back Close
Full Screen / Esc
Printer-friendly Version
Interactive Discussion
Discussion
P
a
per
|
Dis
cussion
P
a
per
|
Discussion
P
a
per
|
Discussio
n
P
a
per
|
Treffeisen, R., Tunved, P., Str ¨om, J., Herber, A., Bareiss, J., Helbig, A., Stone, R. S., Hoyningen-Huene, W., Krejci, R., Stohl, A., and Neuber, R.: Arctic smoke - aerosol characteristics during a record smoke event in the European Arctic and its radiative impact, Atmos. Chem. Phys., 7, 3035–3053, doi:10.5194/acp-7-3035-2007, 2007.
Trepte, Q., Arduini, R. F., Chen, Y., Sun-Mack, S., Minnis, P., Spangenberg, D. A., and 5
Doelling, D. R.: Development of a daytime polar cloud mask using theoretical models of near-infrared bidirectional reflectance for ARM and CERES, in: Proc. AMS 6th Conf. Polar Meteorology and Oceanography, San Diego, CA, 4–18 May 2001, 242–245, 2001.
Wald, A. E.: Modeling thermal infrared (2–14 µm) reflectance spectra of frost and snow, J. Geophys. Res., 99(12), 24241–24250, 1994.
10
AMTD
4, 33–71, 2011Remote sensing of aerosols over snow using infrared AATSR
observations
L. G. Istomina et al.
Title Page
Abstract Introduction
Conclusions References
Tables Figures
◭ ◮
◭ ◮
Back Close
Full Screen / Esc
Printer-friendly Version
Interactive Discussion
Discussion
P
a
per
|
Dis
cussion
P
a
per
|
Discussion
P
a
per
|
Discussio
n
P
a
per
|
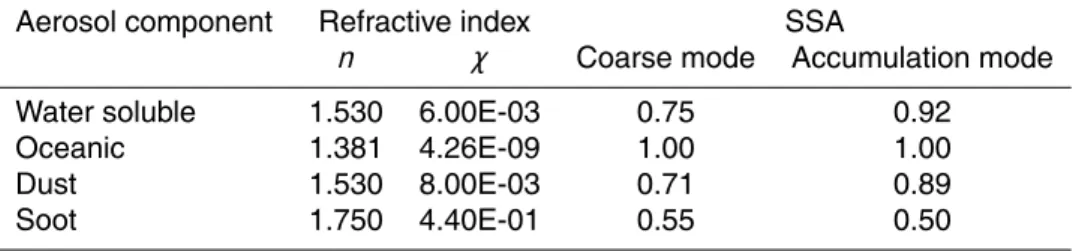
Table 1.SSA, realnand imaginaryχ part of the refractive index for coarse and accumulation mode of water soluble, oceanic, dust and soot aerosol components at 550 nm.
Aerosol component Refractive index SSA
n χ Coarse mode Accumulation mode
Water soluble 1.530 6.00E-03 0.75 0.92
Oceanic 1.381 4.26E-09 1.00 1.00
Dust 1.530 8.00E-03 0.71 0.89
AMTD
4, 33–71, 2011Remote sensing of aerosols over snow using infrared AATSR
observations
L. G. Istomina et al.
Title Page
Abstract Introduction
Conclusions References
Tables Figures
◭ ◮
◭ ◮
Back Close
Full Screen / Esc
Printer-friendly Version
Interactive Discussion
Discussion
P
a
per
|
Dis
cussion
P
a
per
|
Discussion
P
a
per
|
Discussio
n
P
a
per
|
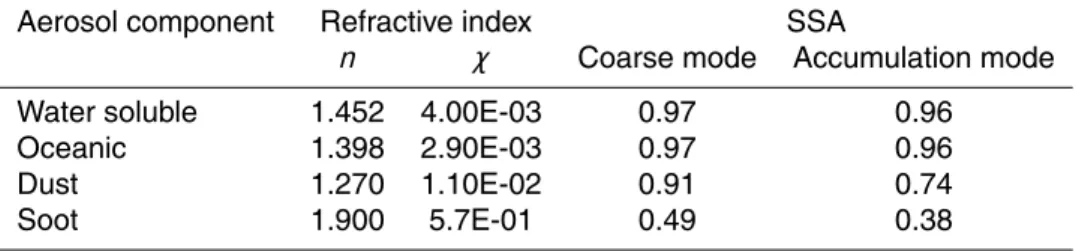
Table 2.SSA, realnand imaginaryχ part of the refractive index for coarse and accumulation mode of water soluble, oceanic, dust and soot aerosol components at 3.7 µm.
Aerosol component Refractive index SSA
n χ Coarse mode Accumulation mode
Water soluble 1.452 4.00E-03 0.97 0.96
Oceanic 1.398 2.90E-03 0.97 0.96
Dust 1.270 1.10E-02 0.91 0.74
Soot 1.900 5.7E-01 0.49 0.38
AMTD
4, 33–71, 2011Remote sensing of aerosols over snow using infrared AATSR
observations
L. G. Istomina et al.
Title Page
Abstract Introduction
Conclusions References
Tables Figures
◭ ◮
◭ ◮
Back Close
Full Screen / Esc
Printer-friendly Version
Interactive Discussion
Discussion
P
a
per
|
Dis
cussion
P
a
per
|
Discussion
P
a
per
|
Discussio
n
P
a
per
|
Fig. 2.Phase functions for accumulation mode of oceanic, water soluble, dust and soot aerosol components calculated spherical polydisperse particles at 550 nm (VIS, continuous line in the figure) and 3.7 µm (IR, dashed line in the figure). The phase functions are normalized to unity, see SSA in text.
AMTD
4, 33–71, 2011Remote sensing of aerosols over snow using infrared AATSR
observations
L. G. Istomina et al.
Title Page
Abstract Introduction
Conclusions References
Tables Figures
◭ ◮
◭ ◮
Back Close
Full Screen / Esc
Printer-friendly Version
Interactive Discussion
Discussion
P
a
per
|
Dis
cussion
P
a
per
|
Discussion
P
a
per
|
Discussio
n
P
a
per
|
Fig. 4. Angular behavior of aerosol reflectance for accumulation mode of dust aerosol com-ponent 550 nm (upper panel) and at 3.7 µm (lower panel). Sun zenith angle is equal to 65 degrees, AOT=0.1.
AMTD
4, 33–71, 2011Remote sensing of aerosols over snow using infrared AATSR
observations
L. G. Istomina et al.
Title Page
Abstract Introduction
Conclusions References
Tables Figures
◭ ◮
◭ ◮
Back Close
Full Screen / Esc
Printer-friendly Version
Interactive Discussion
Discussion
P
a
per
|
Dis
cussion
P
a
per
|
Discussion
P
a
per
|
Discussio
n
P
a
per
|
Fig. 6.The relative error of the retrieved AOT for a given input AOT (blue line). The color filled area shows the sensitivity of the retrieved AOT to the AATSR BT calibration error of±0.1 K.
AMTD
4, 33–71, 2011Remote sensing of aerosols over snow using infrared AATSR
observations
L. G. Istomina et al.
Title Page
Abstract Introduction
Conclusions References
Tables Figures
◭ ◮
◭ ◮
Back Close
Full Screen / Esc
Printer-friendly Version
Interactive Discussion
Discussion
P
a
per
|
Dis
cussion
P
a
per
|
Discussion
P
a
per
|
Discussio
n
P
a
per
|
Fig. 8. Analysis of the validation dataset for station OPAL which contains nearly 200 points spring and summer of years 2007–2009. Only cloud free snow flagged data were taken into account. The dependence of TOA reflectance at 550 nm on BT at 12 µm shows the evolution of surface type with the time of the year. Most of the dataset represents melting sea ice surface type (summer months), whereas data from April and May represent ice covered with snow.
AMTD
4, 33–71, 2011Remote sensing of aerosols over snow using infrared AATSR
observations
L. G. Istomina et al.
Title Page
Abstract Introduction
Conclusions References
Tables Figures
◭ ◮
◭ ◮
Back Close
Full Screen / Esc
Printer-friendly Version
Interactive Discussion
Discussion
P
a
per
|
Dis
cussion
P
a
per
|
Discussion
P
a
per
|
Discussio
n
P
a
per
|
2
μ
AMTD
4, 33–71, 2011Remote sensing of aerosols over snow using infrared AATSR
observations
L. G. Istomina et al.
Title Page
Abstract Introduction
Conclusions References
Tables Figures
◭ ◮
◭ ◮
Back Close
Full Screen / Esc
Printer-friendly Version
Interactive Discussion
Discussion
P
a
per
|
Dis
cussion
P
a
per
|
Discussion
P
a
per
|
Discussio
n
P
a
per
|
μ
Fig. 10. Comparison of the retrieved AOTs derived from AATSR product as 3.7 µm and AERONET AOTS for station PEARL. The dashed line represents the linear regression of the data. RMSD=0.0329,R2=0.42.
AMTD
4, 33–71, 2011Remote sensing of aerosols over snow using infrared AATSR
observations
L. G. Istomina et al.
Title Page
Abstract Introduction
Conclusions References
Tables Figures
◭ ◮
◭ ◮
Back Close
Full Screen / Esc
Printer-friendly Version
Interactive Discussion
Discussion
P
a
per
|
Dis
cussion
P
a
per
|
Discussion
P
a
per
|
Discussio
n
P
a
per
|
2
μ
AMTD
4, 33–71, 2011Remote sensing of aerosols over snow using infrared AATSR
observations
L. G. Istomina et al.
Title Page
Abstract Introduction
Conclusions References
Tables Figures
◭ ◮
◭ ◮
Back Close
Full Screen / Esc
Printer-friendly Version
Interactive Discussion
Discussion
P
a
per
|
Dis
cussion
P
a
per
|
Discussion
P
a
per
|
Discussio
n
P
a
per
|
μ Fig. 12. Comparison of the retrieved AOTs derived from AATSR product as 3.7 µm and AERONET AOTS for station Kangerlussuaq. The solid line represents the linear regression of the data. RMSD=0.0289,R2=0.45.
AMTD
4, 33–71, 2011Remote sensing of aerosols over snow using infrared AATSR
observations
L. G. Istomina et al.
Title Page
Abstract Introduction
Conclusions References
Tables Figures
◭ ◮
◭ ◮
Back Close
Full Screen / Esc
Printer-friendly Version
Interactive Discussion
Discussion
P
a
per
|
Dis
cussion
P
a
per
|
Discussion
P
a
per
|
Discussio
n
P
a
per
|
2
Fig. 14.AATSR nadir view reflectances at 550 nm for the area near Kangerlussuaq (left panel) and for the NE-Greenland (right panel). Neither of them shows signs of aerosol pollution.
AMTD
4, 33–71, 2011Remote sensing of aerosols over snow using infrared AATSR
observations
L. G. Istomina et al.
Title Page
Abstract Introduction
Conclusions References
Tables Figures
◭ ◮
◭ ◮
Back Close
Full Screen / Esc
Printer-friendly Version
Interactive Discussion
Discussion
P
a
per
|
Dis
cussion
P
a
per
|
Discussion
P
a
per
|
Discussio
n
P
a
per
|
3
AMTD
4, 33–71, 2011Remote sensing of aerosols over snow using infrared AATSR
observations
L. G. Istomina et al.
Title Page
Abstract Introduction
Conclusions References
Tables Figures
◭ ◮
◭ ◮
Back Close
Full Screen / Esc
Printer-friendly Version
Interactive Discussion
Discussion
P
a
per
|
Dis
cussion
P
a
per
|
Discussion
P
a
per
|
Discussio
n
P
a
per
|
Fig. 16. The map of retrieved AOT over Greenland after the discussed dust event, on 15 July 2008, 14 h 32 min 18 s, orbit number 33 330. No evidence of pollution is visible in the Kangerlussuaq area (shown with the arrow).