www.nat-hazards-earth-syst-sci.net/8/349/2008/ © Author(s) 2008. This work is distributed under the Creative Commons Attribution 3.0 License.
and Earth
System Sciences
Probabilistic forecasting of shallow, rainfall-triggered landslides
using real-time numerical weather predictions
J. Schmidt1, G. Turek1,*, M. P. Clark1, M. Uddstrom1, and J. R. Dymond2 1National Institute for Water and Atmospheric Research (NIWA), New Zealand 2Landcare Research, New Zealand
*now at: Alchemy Group, New Zealand
Received: 20 December 2007 – Revised: 6 March 2008 – Accepted: 26 March 2008 – Published: 14 April 2008
Abstract. A project established at the National Institute of Water and Atmospheric Research (NIWA) in New Zealand is aimed at developing a prototype of a real-time land-slide forecasting system. The objective is to predict tem-poral changes in landslide probability for shallow, rainfall-triggered landslides, based on quantitative weather forecasts from numerical weather prediction models. Global weather forecasts from the United Kingdom Met Office (MO) Nu-merical Weather Prediction model (NWP) are coupled with a regional data assimilating NWP model (New Zealand Lim-ited Area Model, NZLAM) to forecast atmospheric variables such as precipitation and temperature up to 48 h ahead for all of New Zealand. The weather forecasts are fed into a hy-drologic model to predict development of soil moisture and groundwater levels. The forecasted catchment-scale patterns in soil moisture and soil saturation are then downscaled us-ing topographic indices to predict soil moisture status at the local scale, and an infinite slope stability model is applied to determine the triggering soil water threshold at a local scale. The model uses uncertainty of soil parameters to pro-duce probabilistic forecasts of spatio-temporal landslide oc-currence 48 h ahead. The system was evaluated for a damag-ing landslide event in New Zealand. Comparison with land-slide densities estimated from satellite imagery resulted in hit rates of 70–90%.
1 Introduction
Shallow landslides triggered by intense rainstorms occur in most mountainous landscapes and can cause significant dam-age to human lives and properties (Glade, 1998). New Zealand, located at the interface between the Pacific and
Aus-Correspondence to:J. Schmidt ([email protected])
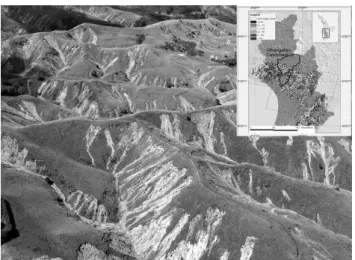
tralian crustal plates, is characterized by a dynamic active landscape – mountainous and hilly regions with steep slopes cover large areas of the country; uplifted and dissected sedi-mentary and volcanic rocks with low strength properties are widespread. New Zealand’s location in the South-western Pacific means that sub-tropical cyclones hit the land mass of New Zealand on a regular basis creating heavy rainfall over large areas (McConchie, 1992). Settlement history has seen major shifts in land use and land coverage, beginning with Maori settlement around one thousand years ago and contin-uing with European settlement. Large land areas have been cleared of indigenous forest and converted into crop land and pasture, exposing weak parent material to the actions of weather and climate (McConchie, 1992). These factors contribute to the pronounced landslide susceptibility of New Zealand landscapes (Glade, 1998; Fig. 1) causing significant damages to economy and society (McConchie, 1992).
One of the possible ways to reduce the damaging im-pact of those hazards to life, infrastructure, and livestock is to increase preparedness through landslide warning sys-tems (Wilson, 2005). Approaches in landslide warning have been based either on detailed site-specific investigations and movement monitoring programmes (Malet et al., 2005) or on statistical threshold models (Guzetti et al., 2007; Wil-son, 2005). A few recent studies showed the potentials of remote sensing data (Tralli et al., 2005) and of hydrological and slope stability models to be applied within a landslide forecasting framework (Malet et al., 2005; Qui et al., 2007). Here we aim to develop regional landslide forecasting pro-cedures based on process-based models. To simulate and to predict rainfall-triggered landslides, three fundamental pro-cesses have to be modelled (Crozier, 1999):
Fig. 1.Extensive shallow slope failures in New Zealand’s North Is-land soft rock country triggered from intense rainfall events (image from Hancox and Wright, 2005). Here shown landslide damage to pasture areas during the February 2004 storm event in the south-west of the North Island (Hancox and Wright, 2005; Dymond et al., 2006). Inset shows the extend of landslide damage as derived from satellite imagery (Dymond et al., 2006) and the Whangaheu catchment boundary used as a test site for this study.
2. Soil-hydrologic processes control which parts of the landscape are most affected by soil moisture increases and hence, most prone to landsliding. Therefore, under-standing and simulation of soil hydrology is required. Uncertainties in models of soil hydrology are also re-lated to the accuracy of soil and land cover properties.
3. Soil wetness changes geotechnical soil properties – stresses and strengths are altered and – once stresses get larger than strength – the soil becomes unstable. Ap-propriate soil mechanical formulations in slope stability models are used to model these processes.
This paper reports initial results from a project at the Na-tional Institute of Water and Atmospheric Research (NIWA) in New Zealand aiming to develop a prototype of a real-time landslide forecasting system. The objective is to pre-dict temporal changes in landslide probability for shallow, rainfall-triggered landslides, based on atmospheric forecasts as they are delivered by a numerical weather prediction (NWP) model. The atmospheric forecasts are fed through a model chain of hydrologic models and slope stability mod-els to provide probabilistic forecasts of spatio-temporal land-slide occurrence for vulnerable regions in New Zealand. This paper presents the technical implementation of that coupled forecasting system and some initial results for a regional rainfall event that triggered a large amount of landslides in the lower North Island of New Zealand (Fig. 1).
Fig. 2.Model domain of the NZLAM numerical weather prediction model for New Zealand and example of forecast output: low cloud (1000–800 hPa) and mean sea-level pressure.
2 Landslide forecasting technology
The aim of the study was to develop and to evaluate a landslide forecasting system based on physical principles, using output from an NWP model. The system consists of several components. A regional NWP model for New Zealand (NZLAM) predicts status of the atmosphere over New Zealand up to 48 h ahead. A model of catchment hydrology simulates soil moisture and groundwater levels over the forecast period of the weather forecasts. As the fundamental spatial resolution of the catchment model is quite large (i.e. small sub-catchments), and soil moisture varies significantly with topographic position (Beven and Kirkby, 1979), we used topographic indices to disaggregate sub-catchment average soil moisture conditions to local soil moisture conditions (Beven et al., 1995). A slope stability model calculates effects of soil moisture changes on stresses and strengths within a hillslope. Considering the uncertain-ties in the model parameters and forcings, uncertainty es-timates of stresses and strength are used to estimate fail-ure probabilities. The individual system components are de-scribed in the following sections.
2.1 Weather forecast components
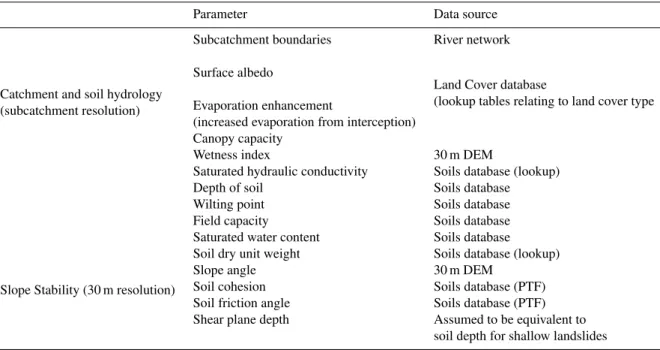
Table 1.Parameters required by the hydrological and stability model components and their data sources. Some of the soil parameters were readily available from the databases, others had to be derived using lookup tables (lookup) or pedo-transfer-functions (PTF).
Parameter Data source
Catchment and soil hydrology
Subcatchment boundaries River network
(subcatchment resolution)
Surface albedo
Land Cover database
(lookup tables relating to land cover type Evaporation enhancement
(increased evaporation from interception) Canopy capacity
Wetness index 30 m DEM
Saturated hydraulic conductivity Soils database (lookup) Depth of soil Soils database Wilting point Soils database Field capacity Soils database Saturated water content Soils database
Slope Stability (30 m resolution)
Soil dry unit weight Soils database (lookup) Slope angle 30 m DEM
Soil cohesion Soils database (PTF) Soil friction angle Soils database (PTF) Shear plane depth Assumed to be equivalent to
soil depth for shallow landslides
the global model utilise the same dynamical cores. NZLAM runs in a 6 h “warm-cycling mode”, assimilating local obser-vations, lateral boundary conditions, and initial conditions from previous runs within the model domain. NZLAM is a grid point model (324×324×38), where the distance be-tween the grid points is 12 km. NZLAM’s model structure is an implementation of the Unified Model, including three dimensional variational assimilation (Lorenc et al., 2000) of observations from land, ship, and upper air stations, drifting buoys, aircraft, and satellites. The background fields, 6 hour forecasts, are derived from the previous forecast cycle. This ensures that the model forecast is as close to reality as pos-sible. NZLAM runs twice daily at NIWA Wellington and produces hourly model output.
2.2 Hydrological model
We use the spatially-distributed, physically-based model TopNet (Bandaragoda et al., 2004) to simulate basin hydrol-ogy based on weather forecast forcings. Each river basin is represented by a number of sub-catchments (each sub-basin is approximately 5 km×5 km in area), and a stream network that connects each sub-catchment to the basin outlet. TopNet has two fundamental components: a water balance model that simulates the dominant hydrological processes in each sub-catchment (snow accumulation and melt, canopy inter-ception and throughfall, the sub-catchment water balance), and a routing model that simulates the flow of water through the river network (including reservoirs and lakes). The sub-basin water balance model has its origins in the classical
Top-model formulation (Beven and Kirkby 1979), which is a sim-plified model of topography-controlled saturated areas and baseflow from the saturated zone. TopNet extends the origi-nal Topmodel formulation to model snow accumulation and melt, and canopy interception and throughfall (Bandaragoda et al., 2004). Parameterization of the sub-basin water bal-ance model requires data on topography (elevations, distri-butions of wetness index and distance to stream), soils (soil depth, porosity, conductivity), and landcover (canopy capac-ity, overland flow velocity) (see Bandaragoda et al., 2004 for a detailed description). These data are derived by the catch-ment data delivery system as described below.
(c) Change in potential affected area over forecast period (b) Maximum failure probability
over forecast period (a) Animation of landslide probability for
forecast period in high spatial resolution Forecast output
Forecast products
Landslide probability for each timestep (hourly) in the forecast period and on high resolution grid (30m) Forecast model
Fig. 3. Landslide forecast for the Whangaheu catchment for the storm event from 15–17 February 2004 forecast products.
(a)Spatio-temporal distribution of forecasted landslide probabil-ity as animation. (b) Spatial distribution of maximum landslide probability in forecast period as map. (c)Temporal development of landslide-affected area (log-scale is used to emphasize the com-paratively large increase of areas with higher landslide probability).
Simulations from TopNet are made using frequency dis-tributions that describe subcatchment variability for the soil zone. Field observations show that areas of soil saturation tend to occur in convergent hollow areas. It has also been reported that landslides most commonly originate in areas of topographic convergence due to higher soil moisture (Mont-gomery and Dietrich, 1994). Therefore the following tech-nique was adopted to downscale simulated soil saturation onto a finer spatial resolution using topographic variability. Beven et al. (1995) showed that local relative soil saturation m can be estimated as
m=m+1/(f z)[ln(a/tanθ )−λ] (1) Wheref is a parameter describing transmissivity change with soil depth andzis local soil depth. λis the spatial av-erage of the topographic parameter ln (a/tanθ) for the area (the catchment) over which the average soil saturationmwas
estimated. This equation expresses the deviation between catchment average soil saturationmand local soil saturation m at any point in terms of the deviation of the local topo-graphic index from its mean. We calculated the topotopo-graphic parameter ln (a/tanθ) and fine-scale soil moisture using a 30m digital elevation model.
2.3 Slope stability modelling
The geotechnical calculations applied in this study are based on the infinite slope form of the Mohr-Coulomb failure law in which the downslope component of the soil just at failure – the shear stressτ, is equal to the strength of resistance caused by cohesionc(which can consist of soil cohesion and root strength c=cs+cr), and by frictional resistance due to the
effective normal stressσ on the failure plane.
τ =c+(σ−u)tanφ (2) The frictional resistance term is determined by the angle of internal frictionφ, the normal stress on the shear planeσ, and
u– the pore pressure opposing the normal load. Downslope stressτ=wsinθand normal stressσ=wcosθare determined by the soil weightwand shear geometry, i.e. slope angleθ. Soil weight at the shear surface is determined by soil depthz
and the depth to the saturated zone (z−h).
w=γb(z−h)+γsh (3)
γb,γs andγw are unit weights of moist soil, saturated soil
and water, respectively. Pore pressureu=γwhcosθis
deter-mined by slope angle and the weight of water above the shear surface ie. the height of the water table in the soil columnh. This leads to the full equation for the infinite slope model at failure.
(γb(z−h)+γsh)sinθ=cr+cs+
(γb(z−h)+γsh−γwh)cosθtanφ (4)
Root cohesion varies widely in space (land cover and land use pattern) and time (growth periods) and is hard to quan-titatively estimate by a sampling programme. In this study we neglected the effects of root cohesion and assumed the cohesive term of the slope is caused by soil particle cohe-sion only. The estimate of stability is therefore conservative – i.e. a slope considered as unstable may be stable in reality if significant amounts of root cohesion add to shear strength. However, the vulnerable pasture landscapes in New Zealand are often characterized by a lack of vegetation. Moreover, roots need to be anchored in the bedrock to have significant effect on slope stability. To find the triggering soil saturation
h/zwhich leads to failure Eq. (1) can be rearranged to
h z=
γb
γw
1−sinθ−c
zγb
cosθtanφ
!
γw
γw+γb−γs−(γb −γs)sinθ cosθtanφ
Fig. 4.Cut-out of observed landslide occurrence and predicted fail-ure probability. Black polygons indicate satellite derived landslides. Coloured background is predicted failure probability.
Assuming that the complete soil column fails,m(Eq. 1) can be set toh/z, and the soil saturations derived from the hy-drological model (Eq. 1) and from the slope stability model (Eq. 5) determine if the soil is unstable.
2.4 Model parameterisation
A critical part of the landslide forecasting system is to be able to parameterize the hydrology and slope stability model com-ponents for any catchment in New Zealand. We used nation-ally consistent databases for that purpose. Spatial informa-tion about the catchments of New Zealand’s rivers has been processed in an earlier project to produce the New Zealand River Environment Classification (REC) (Snelder and Biggs, 2002). The REC includes a network of approx. 600 000 river reaches and sub-basins for New Zealand, including their reach and surface catchment geometries and topologies. To-pographic reach and catchment properties have been derived by overlaying on a 30 m digital elevation model (DEM). Land cover, soil, and geological properties for all catchments in New Zealand have been derived by overlays on the New Zealand land cover database (LCDB) and the New Zealand Land Resource Inventory (LRI) – which are nationally con-sistent databases of land information (Newsome et al., 2000; Wilde et al., 2000). This database constitutes a large array of environmental variables for each sub-catchment in New Zealand (Table 1). Ancillary files for the individual model components (hydrology and slope stability) and for specific model domains can be extracted to generate all parameters necessary for running a forecast model for any region in New Zealand.
2.5 Uncertainty estimation
The uncertainties in landslide modelling – and especially high resolution landslide forecasting – is very high. The
fol-Fig. 5. Discrimination diagram displaying the frequency distri-bution of predicted failure probability (Fig. 4) for areas with ob-served landslides and no observations of landslides (from Dymond et al., 2006) indicate that observed landslide locations correlate with higher predicted landslide probabilities (log-scale inset emphasises the differences at lower frequencies).
lowing three sources of uncertainties can be identified in the used approach. (i) Uncertainty in the weather forecasts: the rain (and other modelled atmospheric variables) will never be exactly distributed in space and time as predicted due to the inaccuracies in the weather models, parameters, and initial conditions (Simmons and Hollingworth, 2002). (ii) Uncer-tainty in the soil hydrology models: even if we could model the atmosphere accurately, the modelled pattern of soil sat-uration will never be exactly distributed as predicted due to uncertainties in the hydrology models, parameters, and ini-tial conditions (Schaake et al., 2007). (iii) Uncertainty in the slope stability model: even if we could forecast the soil hy-drology accurately, hill slopes will never exactly fail where predicted due to inaccuracies in the geotechnical models and soil parameters. Uncertainties in weather and hydrology pre-dictions can be quantified through ensemble modelling by perturbing initial conditions and model parameters and using different model structures as ensemble members (Schaake et al., 2007). This would lead to ensembles of soil satura-tion scenarios for the forecast range. Uncertainties in the slope stability model can be quantified by running ensembles with different model structures and statistical realizations of geotechnical parameters.
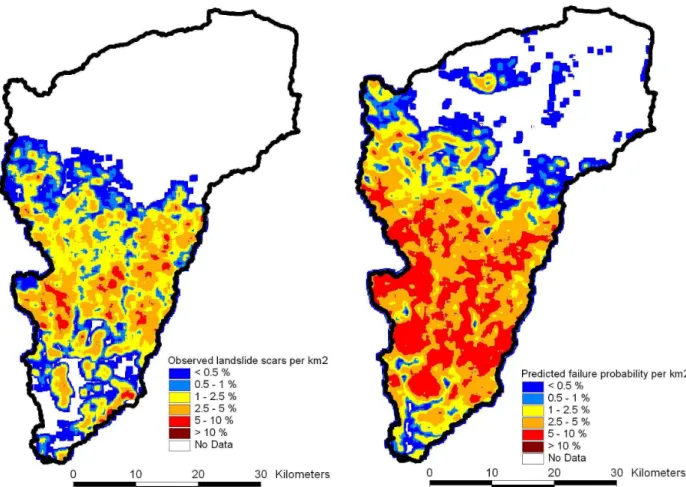
Fig. 6. Observed (satellite-derived, Dymond et al., 2006) and forecasted landslide density for the storm event from 15–17 February 2004, Whangaheu catchment, New Zealand - both calculated on a km2basis.
U with lower and upper bounds as
cs =U (cmin, cmax) (6)
tanφ=U (tmin, tmax) (7)
This leads to uncertainty boundsmmin, mmax in the
esti-mated saturation degreeh/z=mas:
mmin=
γb
γw
1−sinθ−cmin
zγb
cosθ·tmin
!
(8)
mmax=
γb
γw
1−sinθ−cmax
zγb
cosθ·tmax
!
(9)
Similarly, the uncertainties in the shear stress and shear strength can be derived and the failure probability can then be calculated by the degree the modelled shear stress ex-ceeds shear strength for each point in the model domain. It is planned to extend this uncertainty model to other types of PDFs and to explicitly quantify uncertainties in weather fore-casts and simulations of soil hydrology (as described above).
2.6 Delivering forecast information
Contingency table for 1% density obs.
>1% <=1% ∑
>1% 671 232 903
<=1% 76 1124 1200
p
re
d
.
∑ 747 1356 2103
Hit rate 0.90 False alarm ratio 0.26
Bias 1.21
Contingency table for 3% density obs.
>3% <=3% ∑
>3% 361 181 542
<=3% 170 1391 1561
p
re
d
.
∑ 531 1572 2103
Hit rate 0.68 False alarm ratio 0.33
Bias 1.01
Contingency table for 2% density obs.
>2% <=2% ∑
>2% 523 213 736
<=2% 111 1256 1367
p
re
d
.
∑ 634 1469 2103
Hit rate 0.83 False alarm ratio 0.29
Bias 1.16
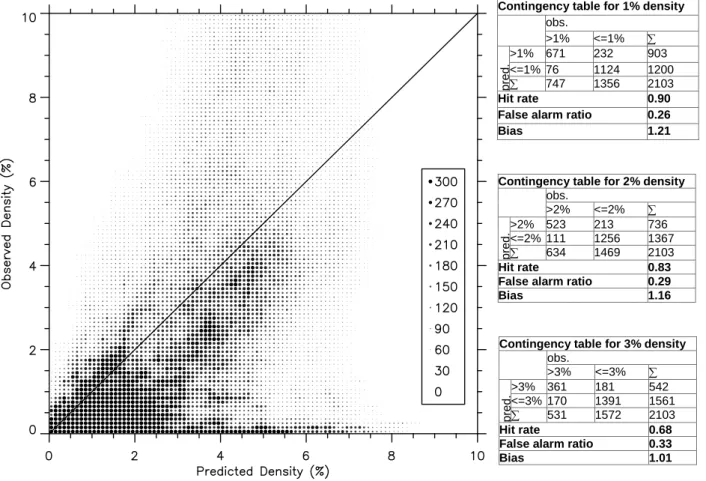
Fig. 7.Relationship between predicted landslide density and observed landslide density per km2(Fig. 6), legend indicates number of cases. Inserted are the contingency tables (numbers in thousands) derived for different thresholds of landslide density.
3 Discussion and conclusions
We presented a probabilistic modelling system for forecast-ing shallow, rainfall-triggered landslides as they frequently occur in pastoral areas. The model has yet to be extensively calibrated and validated – here we provide an initial test us-ing data from the extreme event in February 2004 (Schmidt et al., 2005), which caused more than 60 000 landslides in the lower North Island of New Zealand (Dymond et al., 2006). The system was run in hindcast mode for that event for the Whangaheu catchment. Figure 4 illustrates high resolution probabilistic forecasts of landslides, along with the actual oc-currence from post-event satellite-based landslide mapping (Dymond et al., 2006). Qualitatively, the predicted spatial landslide distribution is comparable with the spatial distri-bution from satellite imagery (Fig. 4). Comparison of the high-resolution model output against the locations of land-slides derived from satellite imagery in a discrimination di-agram (Fig. 5; Clark and Slater, 2006) showed that areas of higher predicted landslide probability coincide with ob-served landslide area. However, the high-resolution model output also predicts high failure probabilities where no land-slides occurred (high false alarm ratio) – as can be seen in
density forecasts then depends on the statistical reliability of the probabilistic forecasts, that is, the extent to which the fraction of observed landslides matches the forecast proba-bility.
Figure 6 illustrates the spatial pattern of landslide densi-ties derived using a 1 km2 kernel. As expected, the spatial aggregation improves the correspondence between forecasts and observations. Figure 7 shows the joint density of pre-dicted and observed landslide density in a scatterplot. While the scatter is quite large (42% explained variance), there is a general relationship between predictions and observations. Next we categorized the landslide densities and derived con-tingency measures. We achieved high hit rates (observed landslide densities match predicted probabilities) of about 70–90%. False alarm ratios (no landslides observed with pre-dicted landslide probability) are about 30%, indicating the over prediction observed in Figs. 4 and 6. It has to be kept in mind, however, that these results are achieved without any model calibration.
The following improvements and extensions are planned to enhance the forecasting system. Given the uncertainty in the individual model components it is important to extend the current probabilistic approach to include more uncertainties in the model chain. One of the most important uncertainties is the spatial accuracy of the rainfall forecasts. All the in-volved models can be run in ensemble mode by perturbing the initial conditions and the model parameters. This will give multiple forecasts and enable us to quantify more uncer-tainties in the forecasts. Data assimilation is needed to ensure high-quality forecasts of atmospheric and hydrologic fluxes and states (Schaake et al., 2007). Currently we are assimi-lating atmospheric satellite observations and river discharges from recorders; we are planning to include the assimilation of soil moisture observations. We also plan to extend the cast range by seamlessly merging short-range weather fore-casts to medium-term (week, month) climate forefore-casts us-ing statistical and ensemble techniques. The soil mechanical model and its parameters are based on existing (weak) data sources for New Zealand. The assumptions of the infinite slope model or “Planar Slope Model” are based on a model of a uniform, translational failure of uniform depth and slope angle. The critical failure condition is achieved only by in-creasing pore pressure of the soil water (and consequently decreasing shear strength of the soil) at the shear surface. This is a simplification of real-world conditions, where fail-ure occurs in curved slip surfaces and multiple mechanisms including fluid failure. However, new techniques emerge to deal with those issues (Qui et al., 2007).
An important question is related to the communication of model outputs – including high degrees of uncertainties – to end-users using appropriate forecast products (Fig. 3). The validation results (above) showed that aggregated landslide probability on a coarser resolution was more reliable than the immediate fine-scale forecast results. The inherent uncer-tainties in weather simulation, hydrological modelling, and
geotechnical models mean that the landslide forecast results contain high degrees of uncertainties, in particular if verified on a local scale, hence, the forecast results need to be up-scaled to regional levels to be useful for applied purposes.
Acknowledgements. Landcare Research provided the land cover and soils databases which were necessary to develop the underlying model parameters for all of New Zealand. The research and development of the modelling systems used was funded by NIWA under contract CRED075. NZLAM forecasts were provided under Contract C01X0401.
Edited by: J. L. Zezere
Reviewed by: R. Trigo and another anonymous referee
References
Bandaragoda, C., Tarboton, D., and Woods, R.: Application of TOPNET in the distributed model intercomparison project, J. Hydrol., 298, 178–201, 2004.
Beven, K. J. and Kirkby, M. J.: A physically based variable con-tributing area model of basin hydrology, Hydrol. Sci. Bull., 24(1), 43–69, 1979.
Beven, K. J., Lamb, R., Quinn, P. F., Romanowicz, R., and Freer, J.: TOPMODEL, in: Computer Models of Watershed Hydrology, edited by: Singh, V. P., Water Resources Publications, 627–668, 1995.
Blondeau, F.: The residual shear strength of some French clays: measurement and application to a natural slope landslide, Geolo-gia Applicata e IdrogeoloGeolo-gia, 8(1), 125–141, 1973.
Clark, M. P. and Slater, A. G.: Probabilistic quantitative precipita-tion estimaprecipita-tion in complex terrain, J. Hydrometeorol., 7, 3–21, 2006.
Crozier, M. J.: Prediction of rainfall-triggered landslides: a test of the antecedent water status model, Earth Surface Processes and Landforms, 24, 825–833, 1999.
Davies, T., Cullen, M. J. P., Malcolm, A. J., Mawson, M. H., Stan-iforth, A., White, A. A., and Wood, N.: A new dynamical core for the Met Office’s global and regional modelling of the atmo-sphere, Quart. J. Roy. Meteor. Soc., 131, 1759–1782, 2005. Dymond, J. R., Ausseil, A.-G., Shepherd, J. D., and Buettner, L.:
Validation of a region-wide model of landslide susceptibility in the Manawatu–Wanganui region of New Zealand, Geomorphol-ogy, 74, 70–79, 2006.
EcoConnect: http://www.niwa.co.nz/services/paid/ecoconnect, last access: 20 February 2008.
Glade, T.: Establishing the frequency and magnitude of landslide-triggering rainstorm events in New Zealand, Environmental Ge-ology, 35(2–3), 160–174, 1998.
Guzetti F., Peruccacci, S., Rossi, M., and Stark, C. P.: Rainfall thresholds for the initiation of landslides in central and southern Europe, Meteorol. Atmos. Phys., 98, 239–267, 2007.
Lorenc, A. C., Ballard, S. P., Bell, R. S., Ingleby, N. B., Andrews, P. L. F., Barker, D. M., Bray, J. R., Clayton, A. M., Dalby, T., Li, D., Payne, T. J., and Saunders, F. W.: The Met. Office global three-dimensional variational data assimilation scheme, Quart. J. Roy. Meteor. Soc., 126, 2991–3012, 2000.
Malet, J.-P., van Asch, Th., W. J., van Beek, R., and Maquairie, O.: Forecasting the behaviour of complex landslides with a spatially distributed hydrological model, Nat. Hazards Earth Syst. Sci., 5, 71–85, 2005,
http://www.nat-hazards-earth-syst-sci.net/5/71/2005/.
McConchie, J. A.: Water and slope stability. In: Waters of New Zealand, edited by: Mosley, M. P., New Zealand Hydrological Society, 381–408, 1992.
Montgomery, D. and Dietrich, W.: A physically based model for the topographic control on shallow landsliding, Water Resources Research, 30, 1153–1171, 1994.
Newsome, P. F. J., Wilde, R. H., and Willoughby, E. J.: Land Resource Information System Spatial Data Layers, Technical Report, Landcare Research NZ Ltd, Palmerston North, New Zealand, 2000.
Qui, C., Esaki, T., Xie, M., Mitani, Y., and Wang, C.: Spatio-temporal estimation of shallow landslide hazard triggered by rainfall using a three-dimensional model, Environmental Geol-ogy, 52, 1569–1579, 2007.
Schaake, J. C., Hamill, T. M., Buizza, R., and Clark, M.: HEPEX, The Hydrological Ensemble Prediction Experiment, B. Am. Me-teorol. Soc., 88(10), 1541–1547, 2007.
Schmidt, J., Ibbitt, R. P, and Woods, R. A.: The 2004 February Man-awatu storm – a hydrological analysis using measured and mod-elled rainfall and a catchment model, Proceedings of the Annual Conference of the Hydrologic Society of New Zealand, Auck-land, November 2005.
Simmons, A. J.and Hollingsworth, A.: Some aspects of the im-provement in skill of numerical weather prediction, Q. J. R. Me-teorol. Soc., 128, 647–677, 2002.
Snelder, T. H. and Biggs, B. J. F.: Multi-Scale River Environment Classification for Water Resources Management. Journal of the American Water Resources Association, 38, 1225–1240, 2002. Tralli, D. M., Blom, R. G., Zlotnicki, V., Donnellan, A., and Evans,
D. L.: Satellite remote sensing of earthquake, volcano, flood, landslide and coastal inundation hazards, Journal of Photogram-metry and Remote Sensing, 59, 185–198, 2005.
Wilde, R. H., Willoughby, E. J., Hewitt, A. E.: Data Manual for the Nationals Soils Database Spatial Extension. Technical Report, Landcare Research NZ Ltd., Palmerston North, New Zealand, 2000.