www.atmos-chem-phys.net/10/4273/2010/ doi:10.5194/acp-10-4273-2010
© Author(s) 2010. CC Attribution 3.0 License.
Chemistry
and Physics
Chemical characterisation of iron in dust and biomass burning
aerosols during AMMA-SOP0/DABEX: implication for iron
solubility
R. Paris1, K. V. Desboeufs1, P. Formenti1, S. Nava2, and C. Chou3
1LISA, Universit´es Paris 12 et Paris 7, CNRS, UMR 7583, Cr´eteil, France 2National Institute of Nuclear Physics, Florence, Italy
3ETH, Institut f¨ur Atmosph¨are und Klima, Z¨urich, Switzerland
Received: 12 October 2009 – Published in Atmos. Chem. Phys. Discuss.: 25 November 2009 Revised: 17 April 2010 – Accepted: 22 April 2010 – Published: 6 May 2010
Abstract.The chemical composition and the soluble fraction were determined in aerosol samples collected during flights of AMMA-SOP0/DABEX campaign, which were conducted in the West African Sahel during dry season (2006). Two aerosol types are encountered in this period: dust parti-cles (DUST) and biomass burning aerosol (BB). Chemical analysis and microscope observations showed that the iron (Fe) found in BB samples mainly originates from dust par-ticles mostly internally mixed in the biomass burning layer. Chemical analyses of samples showed that the Fe solubil-ity is lower in African dust samples than in biomass burning aerosols. Our data provide a first idea of the variability of iron dust solubility in the source region (0.1% and 3.4%). We found a relationship between iron solubility/clay con-tent/source which partly confirms that the variability of iron solubility in this source region is related to the character and origin of the aerosols themselves. In the biomass burning samples, no relationship were found between Fe solubility and either the concentrations of acidic species (SO24−, NO−3 or oxalate) or the content of carbon (TC, OC, BC). Therefore, we were unable to determine what processes are involved in this increase of iron solubility. In terms of supply of soluble Fe to oceanic ecosystems on a global scale, the higher solu-bility observed for Fe in biomass burning could imply an in-direct source of Fe to marine ecosystems. But these aerosols are probably not significant because the Sahara is easily the dominant source of Fe to the Atlantic Ocean.
Correspondence to:R. Paris
1 Introduction
The North Atlantic Ocean is under the influence of mineral dust plumes transported from West Africa. Consequently, African dust is the major source of iron to this open ocean region (Sarthou et al., 2003). Its deposition may influence the rate of nitrogen fixation by microorganisms, and subse-quently the global carbon cycle (Mills et al., 2004; Moore et al., 2002). Beside dust emission, the African continent is affected by strong biomass burning events all year round, due to widespread savannah fires and agricultural fires. The event of biomass burning in Africa follows a well deter-mined seasonal cycle related to the seasonal shift in the Inter-Tropical Convergence Zone (ITCZ). Thus, maximum emis-sions of anthropogenic biomass burning aerosol from the south regions of northern Africa occur during the dry season (December/January/February), with very few emissions oc-curring during August/September/November (Nwofor et al., 2007).
iron issued from biomass burning sources. In this context, the international field campaign AMMA-DABEX (Analy-sis Multidisciplinary of African Monsoon-Dust and Biomass burning Experiment), conducted in Sahelian regions during the January–February dry season (2006) offered an excel-lent framework to study the solubility of iron from biomass burning and from mineral dust. Indeed, DABEX Special Ob-servation Periods covered almost exclusively the dry season over Niamey (Niger), a period dominated by minerals dust and biomass burning particles mixing events. In this paper, we present an estimation of African dust and biomass burn-ing aerosols contribution to the supply of soluble iron to the ocean by atmospheric deposition. In order to do so, we mea-sured the water soluble fraction on aerosol samples collected onboard the aircraft FAAM Bae-146.
2 Material and method
2.1 Sampling
Instruments and samplers were operated onboard the UK Fa-cility for Airborne Atmospheric Research (FAAM) BAe-146 research aircraft (http://www.faam.ac.uk/). The region of op-eration of the aircraft during the AMMA-SOP0/DABEX ex-periments and the full description of the aircraft and onboard instrumentation are presented in Haywood et al. (2008). The aerosol sampling system for filter collection consists of two stacked-filter units (SFUs) mounted in parallel. Samples were collected only during horizontal flight legs lasting not less than 20-30 min. in order to guarantee sufficient load-ing of the filter samples. One SFU was used for the measure of water-soluble ions and major, minor, and trace elements. In this case, SFU consisted of a Nuclepore filter of nomi-nal pore size 0.4 µm, 90 mm. The second SFU was used for the measure of carbonaceous aerosols. In this case, the sam-pling medium consisted of one Whatman QMA quartz filter, 47 mm. Quartz filters were pre-baked at 600◦C for approx-imately 12 h to eliminate organic impurities. 57 filter sam-ples have been collected during the 13 research flights of the BAe-146, performed from Niamey, Niger during AMMA-SOP0/DABEX. In parallel with aerosols sampling, we esti-mated the contamination of the method with the use of “blank filters”. All details of the sampling method are described in Formenti et al., (2008). The identification and the details of the operational sampling conditions for the studied filters are summarized in Table 1.
2.2 Chemical composition
Total elemental concentrations for elements ranging from Na to Pb (Note: TFe for Total elemental Fe), for all collected samples, were measured by Particle-Induced X-ray Emis-sion (PIXE) at the 3 MV Tandetron accelerator of the Labec
were fitted using the GUPIX code and elemental concen-trations were obtained via a calibration curve from a set of thin standards (Chiari et al., 2005); it should be noted that the concentrations of light elements, such as Al, may be somewhat underestimated due to X-rays self-absorption in-side aerosol particles (Marino et al., 2008). A two-step ther-mal method was applied for the separation and the analysis of black and organic carbon aerosol contents (BC and OC, respectively). The protocol (Cachier et al., 1989) consists firstly in an acidic step to remove carbonates; secondly, in a thermal pre-treatment under pure O2and during 2 h; and finally in the coulometric analysis (Str¨ohlein COULOMAT 702C) of carbon.
2.3 Water soluble fraction
Sample handling was performed in an ultra clean laboratory (class <1000) on ultra clean laminar flow benches (Class
<10). Dissolution experiments, to measure the water-soluble fraction of collected aerosols, have been carried on 31 fil-ters (over 57 collected): 13 DUST and 18 BB samples (13 BB1 and 5 BB2) (Table 1). To prepare the sample solu-tion, one quarter of each SFU filters and blank filters was extracted using 100 mL water (of 18.2 Mcm−1resistance) during 30 min of ultrasonic agitation (Guinot et al., 2006, Karthikeyan et al., 2006, Chang et al., 2005, Wang et al., 2005). Recent works displays that ultrasonication could pro-duce H2O2by acoustic cavitations (Kanthale et al., 2008). H2O2 could induce the oxidation of soluble Fe(II) into in-soluble Fe(III) (Zhu et al., 1993) or inverse (Pehkonen et al., 1993). Consequently, the ultrasonification could impact on the values obtained for iron solubility.
The solution was filtered on a 0.2 µm Nucleopore poly-carbonate filter (Whatman). Inorganic and organic anions species (Cl−, Br−, NO−2, NO3−, SO23−, SO24−, acetate, for-mate, propionate, butyrate, MSA-, pyruvate, valerate, and oxalate) were quantified by ion chromatography. Ion chro-matography (IC) analysis have been carried out with a Dionex 4500i device, equipped with an AS11-HC column associated with an AG11 pre-column. For simultaneous sep-aration of inorganic and short-chain organic anions, gradient elution by 1–66 mM NaOH (1.5 mL/min) was used. Dis-solved iron concentration (DFe) was analysed by GFAAS (ATI-Unicam 929) (Sofikitis et al., 2004). Multi-elementary analysis of the dissolved phase was made by ICP-AES (PE Optima 3000) (Desboeufs et al., 2003).
3 Results and discussion
3.1 Characterisation of particulate iron
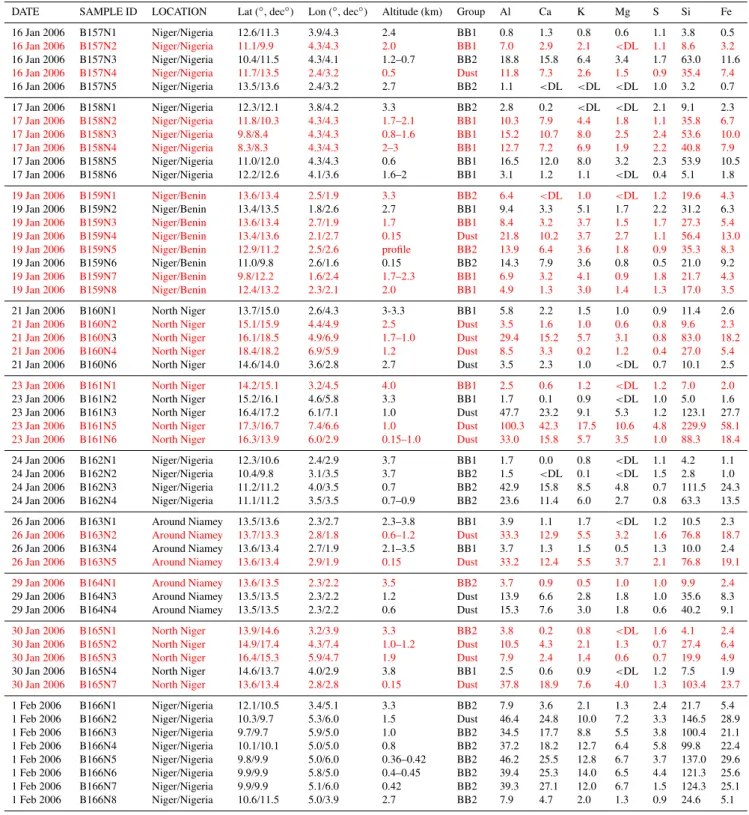
Table 1.Sample Identification and Main Operational Details for the Sampled Filter (for lon/lat: start/end sampling) (Note: PIXE measure-ment, Al, Ca, K, Mg, S, Si, and Fe in µg m−3). Red: Samples used for the determination of the WSF.
DATE SAMPLE ID LOCATION Lat (◦, dec◦) Lon (◦, dec◦) Altitude (km) Group Al Ca K Mg S Si Fe 16 Jan 2006 B157N1 Niger/Nigeria 12.6/11.3 3.9/4.3 2.4 BB1 0.8 1.3 0.8 0.6 1.1 3.8 0.5
16 Jan 2006 B157N2 Niger/Nigeria 11.1/9.9 4.3/4.3 2.0 BB1 7.0 2.9 2.1 <DL 1.1 8.6 3.2
16 Jan 2006 B157N3 Niger/Nigeria 10.4/11.5 4.3/4.1 1.2–0.7 BB2 18.8 15.8 6.4 3.4 1.7 63.0 11.6
16 Jan 2006 B157N4 Niger/Nigeria 11.7/13.5 2.4/3.2 0.5 Dust 11.8 7.3 2.6 1.5 0.9 35.4 7.4
16 Jan 2006 B157N5 Niger/Nigeria 13.5/13.6 2.4/3.2 2.7 BB2 1.1 <DL <DL <DL 1.0 3.2 0.7 17 Jan 2006 B158N1 Niger/Nigeria 12.3/12.1 3.8/4.2 3.3 BB2 2.8 0.2 <DL <DL 2.1 9.1 2.3
17 Jan 2006 B158N2 Niger/Nigeria 11.8/10.3 4.3/4.3 1.7–2.1 BB1 10.3 7.9 4.4 1.8 1.1 35.8 6.7
17 Jan 2006 B158N3 Niger/Nigeria 9.8/8.4 4.3/4.3 0.8–1.6 BB1 15.2 10.7 8.0 2.5 2.4 53.6 10.0
17 Jan 2006 B158N4 Niger/Nigeria 8.3/8.3 4.3/4.3 2–3 BB1 12.7 7.2 6.9 1.9 2.2 40.8 7.9
17 Jan 2006 B158N5 Niger/Nigeria 11.0/12.0 4.3/4.3 0.6 BB1 16.5 12.0 8.0 3.2 2.3 53.9 10.5 17 Jan 2006 B158N6 Niger/Nigeria 12.2/12.6 4.1/3.6 1.6–2 BB1 3.1 1.2 1.1 <DL 0.4 5.1 1.8
19 Jan 2006 B159N1 Niger/Benin 13.6/13.4 2.5/1.9 3.3 BB2 6.4 <DL 1.0 <DL 1.2 19.6 4.3
19 Jan 2006 B159N2 Niger/Benin 13.4/13.5 1.8/2.6 2.7 BB1 9.4 3.3 5.1 1.7 2.2 31.2 6.3
19 Jan 2006 B159N3 Niger/Benin 13.6/13.4 2.7/1.9 1.7 BB1 8.4 3.2 3.7 1.5 1.7 27.3 5.4
19 Jan 2006 B159N4 Niger/Benin 13.4/13.6 2.1/2.7 0.15 Dust 21.8 10.2 3.7 2.7 1.1 56.4 13.0
19 Jan 2006 B159N5 Niger/Benin 12.9/11.2 2.5/2.6 profile BB2 13.9 6.4 3.6 1.8 0.9 35.3 8.3
19 Jan 2006 B159N6 Niger/Benin 11.0/9.8 2.6/1.6 0.15 BB2 14.3 7.9 3.6 0.8 0.5 21.0 9.2
19 Jan 2006 B159N7 Niger/Benin 9.8/12.2 1.6/2.4 1.7–2.3 BB1 6.9 3.2 4.1 0.9 1.8 21.7 4.3
19 Jan 2006 B159N8 Niger/Benin 12.4/13.2 2.3/2.1 2.0 BB1 4.9 1.3 3.0 1.4 1.3 17.0 3.5
21 Jan 2006 B160N1 North Niger 13.7/15.0 2.6/4.3 3-3.3 BB1 5.8 2.2 1.5 1.0 0.9 11.4 2.6
21 Jan 2006 B160N2 North Niger 15.1/15.9 4.4/4.9 2.5 Dust 3.5 1.6 1.0 0.6 0.8 9.6 2.3
21 Jan 2006 B160N3 North Niger 16.1/18.5 4.9/6.9 1.7–1.0 Dust 29.4 15.2 5.7 3.1 0.8 83.0 18.2
21 Jan 2006 B160N4 North Niger 18.4/18.2 6.9/5.9 1.2 Dust 8.5 3.3 0.2 1.2 0.4 27.0 5.4
21 Jan 2006 B160N6 North Niger 14.6/14.0 3.6/2.8 2.7 Dust 3.5 2.3 1.0 <DL 0.7 10.1 2.5
23 Jan 2006 B161N1 North Niger 14.2/15.1 3.2/4.5 4.0 BB1 2.5 0.6 1.2 <DL 1.2 7.0 2.0
23 Jan 2006 B161N2 North Niger 15.2/16.1 4.6/5.8 3.3 BB1 1.7 0.1 0.9 <DL 1.0 5.0 1.6 23 Jan 2006 B161N3 North Niger 16.4/17.2 6.1/7.1 1.0 Dust 47.7 23.2 9.1 5.3 1.2 123.1 27.7
23 Jan 2006 B161N5 North Niger 17.3/16.7 7.4/6.6 1.0 Dust 100.3 42.3 17.5 10.6 4.8 229.9 58.1
23 Jan 2006 B161N6 North Niger 16.3/13.9 6.0/2.9 0.15–1.0 Dust 33.0 15.8 5.7 3.5 1.0 88.3 18.4
24 Jan 2006 B162N1 Niger/Nigeria 12.3/10.6 2.4/2.9 3.7 BB1 1.7 0.0 0.8 <DL 1.1 4.2 1.1 24 Jan 2006 B162N2 Niger/Nigeria 10.4/9.8 3.1/3.5 3.7 BB2 1.5 <DL 0.1 <DL 1.5 2.8 1.0 24 Jan 2006 B162N3 Niger/Nigeria 11.2/11.2 4.0/3.5 0.7 BB2 42.9 15.8 8.5 4.8 0.7 111.5 24.3 24 Jan 2006 B162N4 Niger/Nigeria 11.1/11.2 3.5/3.5 0.7–0.9 BB2 23.6 11.4 6.0 2.7 0.8 63.3 13.5 26 Jan 2006 B163N1 Around Niamey 13.5/13.6 2.3/2.7 2.3–3.8 BB1 3.9 1.1 1.7 <DL 1.2 10.5 2.3
26 Jan 2006 B163N2 Around Niamey 13.7/13.3 2.8/1.8 0.6–1.2 Dust 33.3 12.9 5.5 3.2 1.6 76.8 18.7
26 Jan 2006 B163N4 Around Niamey 13.6/13.4 2.7/1.9 2.1–3.5 BB1 3.7 1.3 1.5 0.5 1.3 10.0 2.4
26 Jan 2006 B163N5 Around Niamey 13.6/13.4 2.9/1.9 0.15 Dust 33.2 12.4 5.5 3.7 2.1 76.8 19.1
29 Jan 2006 B164N1 Around Niamey 13.6/13.5 2.3/2.2 3.5 BB2 3.7 0.9 0.5 1.0 1.0 9.9 2.4
29 Jan 2006 B164N3 Around Niamey 13.5/13.5 2.3/2.2 1.2 Dust 13.9 6.6 2.8 1.8 1.0 35.6 8.3 29 Jan 2006 B164N4 Around Niamey 13.5/13.5 2.3/2.2 0.6 Dust 15.3 7.6 3.0 1.8 0.6 40.2 9.1
30 Jan 2006 B165N1 North Niger 13.9/14.6 3.2/3.9 3.3 BB2 3.8 0.2 0.8 <DL 1.6 4.1 2.4
30 Jan 2006 B165N2 North Niger 14.9/17.4 4.3/7.4 1.0–1.2 Dust 10.5 4.3 2.1 1.3 0.7 27.4 6.4
30 Jan 2006 B165N3 North Niger 16.4/15.3 5.9/4.7 1.9 Dust 7.9 2.4 1.4 0.6 0.7 19.9 4.9
30 Jan 2006 B165N4 North Niger 14.6/13.7 4.0/2.9 3.8 BB1 2.5 0.6 0.9 <DL 1.2 7.5 1.9
30 Jan 2006 B165N7 North Niger 13.6/13.4 2.8/2.8 0.15 Dust 37.8 18.9 7.6 4.0 1.3 103.4 23.7
Fig. 1. Total Fe vs. Total Al for the entire DUST and BB aerosol samples.
2 km) and a persistent layer of biomass burning aerosol was observed between 2 and 5 km, often in mixing with dust (Johnson et al., 2008). Based on visual observation and anal-ysis of physical and optical measurements during flights, it was possible to distinguish the aerosol type of each layer (Formenti et al., 2008). Thus every samples collected in dust layers is noted “DUST” and in biomass burning layers is noted “BB” (Table 1). Measurements of OC/OM (Organic Compounds and Organic Matter, respectively) in BB layers show no major anthropogenic fossil fuel pollution sources (Capes et al., 2008).
The total iron concentrations show statistically lower values for samples collected in BB layers ([Fe]t ot= 7.8±8.3 µg m−3) than samples collected in DUST lay-ers which have concentrations almost twice as large ([Fe]tot= 15.9±13.4 µg m−3). (t-test: t= 2.55 with 95% of confidence). The iron concentrations show a very good cor-relation with Al whatever the type of samples be (Fig. 1). The ratio Fe/Al obtained during this study (Fe/Al = 0.58) is in agreement with the values obtained at the ground-based site in Banizoumbou (Niger) during the same period (Fe/Al = 0.56), mainly influenced by dust layer (Chou et al., 2008; Rajot et al., 2008) and in general in the Saharan dust air masses (e.g. Kandler and Schutz, 2007; Lafon et al., 2006). Chemical analysis of individual particles by electronic mi-croscope confirms the very low content of Fe in the biomass burning particles (mainly constituted of C, S and K) (Chou et al., 2008; Hand et al., 2010), indicating that even in BB lay-ers, mineral dust is the source of iron, not vegetation com-bustion. This is consistent with previous observations by Cachier et al., (1995) or Andreae et al., (1998) for African savannah fires. By approximation of the particulate mass on the filters from Al total content and the mass % of Al in the terrestrial crust (8.3%) (Mason, 1966), the mass % of various elements has been estimated. The mass % of the typical ele-ments of terrigeneous origin (Al, Fe, Si, Ti, Ca) in DUST and BB samples show that the dust present in the BB samples are chemically similar to the one in DUST samples.
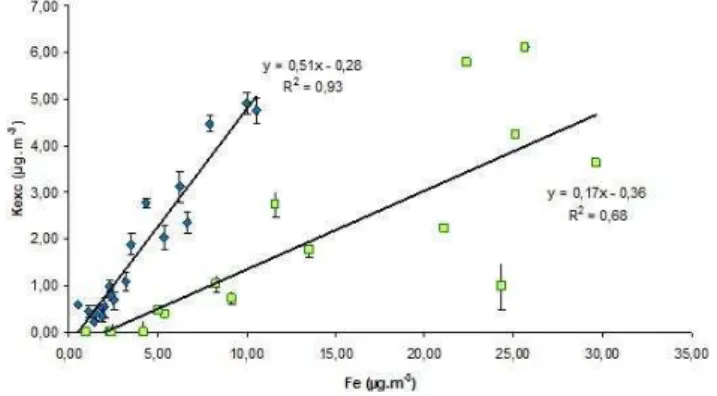
Fig. 2. Plot of Total Fe vs. Kexc in BB samples: two linear rela-tions identified as BB1 group (diamond) and BB2 group (square) are observed.
Table 2. Concentrations of dissolved species (µg m−3) in the water-soluble fraction of BB and DUST samples. (DL: Detection Limit are calculated as the minimum dissolved mass measured on a filter for a mean sampled air volume of 2 m3).
BB DUST
Element DL median min max median min max Al 0.004 0.13 <DL 0.48 0.21 <DL 0.95 Ca 0.003 4.27 <DL 12.52 5.21 0.45 16.79 Fe 0.002 0.10 <DL 0.43 0.07 0.01 0.55 K 0.026 2.16 <DL 4.28 0.83 <DL 3.2 P 0.1 0.16 <DL 0.18 0.10 <DL 0.12 S 0.65 8.65 <DL 11.94 4.11 <DL 10.52 Si 0.02 0.25 <DL 2.65 0.28 <DL 1.05 SO24− 1.9 4.12 <DL 5.41 2.08 <DL 4.09 NO23− 1 4.85 <DL 7.42 1.60 <DL 4.54 C2O24− 0.7 1.07 <DL 1.44 <DL
Table 3. Median solubility of major terrigeneous elements in BB and DUST samples.
Element BB DUST Al 2.09% 0.64% Ca 63.66% 40.35% Fe 2.19% 0.90% K 51.03% 16.85% Mg 36.80% 20.52% Ti 0.54% 0.25% Si 0.71% 0.00%
as Fe and Kexc are correlated, the mixing happened prob-ably directly in the biomass burning air masses due to the dust deposition on vegetation. The value of Kexc/Fe = 0.51 for this group is comparable to the value found by Guieu et al., (2005) (NSSK/Fe = 0.63) in Mediterranean region close to sources of summer forest fire. For the group BB2, the large part of iron concentrations could be due to the injection of new dust in the biomass burning air masses during their transport. Moreover, electronic microscope analyses have been carried out on some DUST filters (B160N3, B161N3, B161N5, B165N7) by Chou et al. (2008) and showed a low but systematic occurrence of biomass burning aerosols in ex-ternal mixing with dust in the samples. Particles imaging on BB filters (B158N6 (BB1), B159N6 and B164N1 (BB2)) showed that dusts are in part internally mixed with soot parti-cles issued from biomass combustion processes (Hand et al., 2010). Consequently, this set of samples (BB2) could repre-sent a crossover between internal aerosols mixing and an ad-dition of dust externally mixed. Another explanation could be related to the evolution of the size distribution of aerosol in the BB air mass during its transport. The dust particles, be-ing coarser than combustion particles, should be removed by
gravitational settling involving a decrease of Fe content in the air mass. We studied the number size fraction for different air masses (DUST and BB), measured by PCASP (Osborne et al., 2008). The results show no differences in the distribu-tions. This means either that dust particles are removed in the same order of magnitude than BB particles during transport or that the sampling is too close to the source to determine any difference. If we compare our samples groups BB1 and BB2 to Formenti et al. (2008), there is no correlation with the aged and fresh biomass burning samples, so the first hy-pothesis should not be the good one.
Finally, it appears that the iron is dust-bearing iron in all the samples and in the case of BB samples, dust are more or less internally mixed with biomass burning aerosols. These two points are critical to the follow-up of the results on the iron solubility values obtained by our experimental protocol. The internal mixing in BB samples, actually, enable us to guess the interaction between BB aerosols species and iron-dust within atmospheric or seawater, an aqueous phase sim-ulate by our protocol describe previously.
3.2 Water soluble fraction and iron solubility
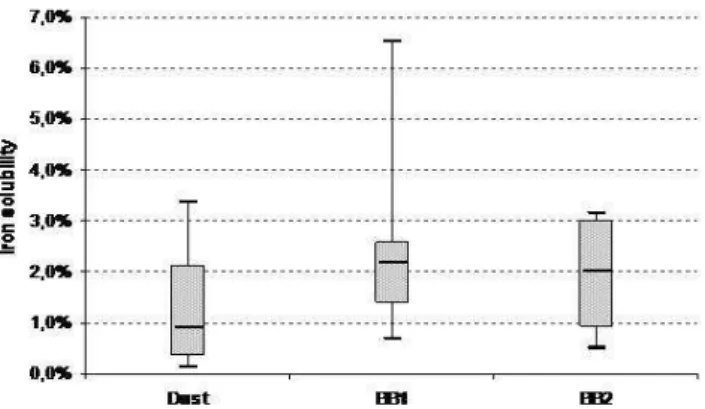
Fig. 3. Boxplot of Percentage solubility estimates of Fe for the 3 kinds of identified samples: DUST (13 Samples), BB1 (8 Samples) and BB2 (4 Samples). Whiskers are from minimum to maximum, box width represents the interquartile range and a stroke is plotted inside of the box to represent the median.
as water-soluble sulphate. It is known that near the emission, elementary K was mainly present as KCl, evolving to K2SO4 with the aging of air masses (Gaudichet et al., 1995), due to secondary processing of SO2from biomass burning sources. This means that the lower the K/S ratio the older the BB air masses. As oxalate has been only determined in biomass burning samples, this indicate that this is the primary source in our samples. Moreover, oxalate concentrations present a negative correlation with K/S ratio (R2=0.8), indicating that the oxalate is formed in the condensation mode during trans-port.
In term of ocean-atmosphere interaction, Fe, N and P are very important nutrient supplied to the ocean by at-mospheric deposition, especially the North tropical Atlantic Ocean (Baker et al., 2003). Water soluble fraction results show that biomass burning aerosols constitute a more impor-tant source of dissolved NO−3 and P than dust particles, con-firming precedent works (e.g. Baker et al., 2006) (Table 2). Due to the limit of detection of PIXE, we have little informa-tion on the contents of particulate N and P, therefore it is dif-ficult to give further explanations on dissolution process that could be at stake. The discussion should then focus on the estimation of the contribution of mixing particles on the dis-solution of iron able to reach the ocean. The median soluble fractions obtained as the ratio of dissolved over total element are presented in Table 3. Typically, the soluble fractions are lower in DUST samples than in BB samples. For elements of terrigeneous origin (Al, Fe, Si, and Ti), the median values are always inferior to 3%. The iron soluble fraction (SFe) obtained is detailed in the Fig. 3. We found median soluble fractions of 0.9%, 2.0%, and 2.2% for the group DUST, BB2 and BB1 respectively.
Fig. 4. Plot of percentage of SFe vs. SMg for all DUST samples. The two sets of points highlight the difference of mineralogy in the dust samples, characterized by different ratio. We supposed that the 2 points the closest to the origin belong to both regression equations on the assumption that there is not only one predominant mineral as SFe provider.
3.2.1 Iron solubility in mineral dust
between the total iron content and SFe. In order to observe a potential effect of mineralogy, we compare the solubility of Mg, as a proxy of the dissolution of clay-containing Mg such as illite and montmorillonite, and that of Fe (Fig. 4, dia-monds). These results emphasize on the fact that a linear re-lationship exists between soluble fraction of iron and magne-sium for several samples, suggesting that the dissolved iron could be issued from the dissolution of clay. Otherwise, the ratio SMg/SFe which is around 8, is in agreement with the ratio for pure illite or montmorillonite, extending from 3 to 8 (Journet et al., 2008). Thus, the variability of iron solu-bility could be related to the variasolu-bility of clay content. Be-sides this correlation, samples (Fig. 4, circles) did not fit with the others. There are a couple of hypotheses to explain the very high SMg/SFe ratio measured with these aerosols sam-ples. First of all, the important dissolution of Mg can be due to the contribution of other clays. For example, pure non-tronite presents a ratio of 81 (Journet et al., 2008), a value comparable to the one in this study (around 40). Neverthe-less, we cannot set aside the possibility of the presence of other non-Fe mineral containing Mg, which could lead to the increase of the soluble form of this element in the sam-ples. To confirm the role of mineralogical composition of dust, we have carried out the study of back trajectories (http: //ready.arl.noaa.gov/HYSPLIT.php) based on flight plan (Ta-ble 1). Calculating back trajectories from each vertical layer within the main dust plume enables us to identify the source regions from where collected air masses were transported. They are very various: from the Southern Algerian, Malian and Mauritanian deserts and also from Chad (Bod´el´e depres-sion) or North Niger. However, no clear correlation can be found between air masses type and their origin, since air masses can be continuously supply in new dust, from various sources along their atmospheric transport. In order to ver-ify the dust source activation during passage of air masses, we examined a time series of infrared imager SEVIRI dust index images (http://radagast.nerc-essc.ac.uk/Data.htm). It indicates that the only active source, identifiable by remote sensing on the campaign period, was the Bod´el´e region, with peaks in intensity on 21 January 2006 (B160N3), the 23 Jan-uary 2006 (B161N5) and also on 30 JanJan-uary 2006 (B165N2). This influence is confirmed by the high content in Si in these samples and by the presence of diatoms by SEM (Scan-ning Electron Microscope) observations (Washington et al., 2006). These 3 “Bod´el´e samples” present the lowest iron solubility (around 0.15%). Thus, our results seem to em-phasize on the relationship between iron solubility/clay con-tent/source and hence partly confirm that the variability of iron solubility in this source region is related to the composi-tion and origin of the aerosols themselves.
3.2.2 Iron solubility in biomass burning layers
In terms of iron deposition, the mineral aerosols are usually considered as dominating combustion sources by a factor above 30 at the global scale (Luo et al., 2008). However, the measurements performed in this study show that the dis-solved Fe concentrations are in the same order of magnitude (DFeBB= 0.13 µg m−3 vs. DFeDust= 0.16 µg m−3), with the Dust and BB source. More precisely, even though biomass burning in itself is not a direct source of soluble Fe, the en-trainment of dust deposited on vegetation makes of, biomass burning a significant indirect source of mineral Fe. More-over, our results show that the solubility of iron is enhanced by the mixing with biomass burning aerosols. The reasons for this increase are not clear. In particular, we have not been able to link it with the presence of some specific biomass burning species (such as oxalate). Beyond that, the BB air masses could constitute a significant supplier of the nutri-ents needed by the marine ecosystems. The amount of dis-solved Nitrogen and Phosphorous issued from biomass burn-ing aerosols is larger than the one in dust particles samples. Whereas the input of soluble Fe is dominated by dust depo-sition, its solubility being enhanced when dust particles are mixed with biomass burning aerosols.
Acknowledgements. Based on a French initiative, AMMA was built by an international scientific group and is currently funded by a large number of agencies, especially from France, the United King-dom, the United States, and Africa. It has been the beneficiary of a major financial contribution from the European Community’s Sixth Framework Research Programme. Detailed information on scien-tific coordination and funding is available on the AMMA Interna-tional Web site at www.amma-internaInterna-tional.org.
Financial support of the API-AMMA and the LEFE (project BIRD) national programs is acknowledged. The authors also wish to thank the BAe-146 air and ground crews, as well as the FAAM and Met Office observers. H. Cachier and K. Oikonomou (LSCE, Gif sur Yvette, France) provided the analysis of total carbon.
The authors are also grateful to the BAe-146 air and ground crews, as well as the FAAM and Met Office observers, and the AMMA-SOP0/DABEX PI J. Haywood (Met Office).
They also thank the ”Institut National des Sciences de l’Univers” (INSU/CNRS) for his support.
Edited by: C. Reeves
The publication of this article is financed by CNRS-INSU.
H., Le Canut, P., Elbert, W., Maenhaut, W., Salma, I., Wienhold, F. G., and Zenker, T.: Airborne studies of aerosol emissions from savannah fires in Southern Africa, 2, Aerosol chemical composi-tion. , J. Geophys. Res., 32, 119–128, 1998.
Baker, A. R., Kelly, S. D., Biswas, K. F., Witt, M. and Jickells, T. D.: Atmospheric deposition of nutrients to the Atlantic Ocean, Geo-phys. Res. Letter, 30(24), 2296, doi:10.1029/2003GL018518, 2003.
Baker, A. R., Jickells, T. D., Witt, M., and Linge, K. L.: Trends in the solubility of iron, aluminium, manganese and phosphorus in aerosol collected over the Atlantic Ocean, Mar. Chem., 98, 43– 58, 2006.
Bonnet, S. and Guieu, C.: Dissolution of atmospheric iron in seawater, Geophys. Res. Letter, 31, L03303, doi:10.1029/2003GL018423, 2004.
Buck, C. S., Landing, W. M. and Resing, J. A.: Particle size and aerosol iron solubility: A high-resolution analysis of Atlantic aerosols, Mar. Chem., doi:10.1016/j.marchem.2008.11.002, in press, 2010.
Cachier, H.: Isotopic characterization of carbonaceous aerosols, Aeros. Sci. and Tech. 10, 379–385, 1989.
Cachier, H. and Ducret, J.: Influence of biomass burning on equa-torial African rains, Nature, 352, 228–230, 1991.
Cachier, H., Liousse, C., and Buat-Menard, P.: Particulate Con-tent of Savannah Fire Emissions, J. Atmos. Chem., 22, 123–148, 1995.
Calzolai, G., Chiari, M., Garcıa Orellana, I., Lucarelli, F., Migliori, A., Nava, S., and Taccetti, F.: The new external beam facility for environmental studies at the Tandetron accelerator of LABEC, Nucl. Instr. & Meth., B249, 928–931, 2006.
Capes, G., Johnson, B., McFiggans, G., Williams, P. I., Haywood, J., and Coe, H.: Aging of biomass burning aerosols over west Africa: Aircraft measurements of chemical composition, mi-crophysical properties, and emission ratios, J. Geophys. Res.-Atmospheres, 113, D00C15, doi:10.1029/2008JD009845, 2008. Chang, H., Herckes, P., and Collet Jr., J. L.: On the use of an-ion exchange chromatography for the characterizatan-ion of wa-ter soluble organic carbon. Geophys. Res. Letwa-ter, 32, L01810, doi:10.1029/2004GL021322, 2005.
Chen, Y. and Siefert, R. L.: Seasonal and spatial distributions and dry deposition fluxes of atmospheric total and labile iron over the tropical and subtropical North Atlantic Ocean, J. Geophys. Res., 109, D09305, doi:10.1029/2003JD003958, 2004.
Chiari, M., Lucarelli, F., Mazzei, F., Nava, S., Paperetti, L., Prati, P., Valli, G., and Vecchi, R.: Characterization of airborne particulate matter in an industrial district near Florence by PIXE and PESA, J. X-Ray Spectrom., 34(4), 323–329, 2005.
Chou, C., Formenti, P., Maille, M., Ausset, P., Helas, G., Harri-son, M., and Osborne, S.: Size distribution, shape, and com-position of mineral dust aerosols collected during the African Monsoon Multidisciplinary Analysis Special Observation Period 0: Dust and Biomass-Burning Experiment field campaign in Niger, January 2006, J. Geophys. Res.-Atmos., 113, D00C10, doi:10.1029/2008JD009897, 2008.
doi:10.1029/2004GL021946., 2005.
Desboeufs, K. V., Losno, R., and Colin, J. L.: Figures of merit of pneumatic and ultrasonic sample introduction systems in induc-tively coupled plasma-multichannel-based emission spectrome-try in an ultra-clean environment, Anal. Bioanal. Chem., 375, 567–573, 2003.
Desboeufs, K. V., Sofikitis, A., Losno, R., Colin, J. L., and Aus-set, P.: Dissolution and solubility of trace metals from natural and anthropogenic aerosol particulate matter, Chemosphere, 58, 195–203, 2005.
Formenti, P., Rajot, J. L., Desboeufs, K., Caquineau, S., Chevail-lier, S., Nava, S., Gaudichet, A., Journet, E., Triquet, S., Al-faro, S., Chiari, M., Haywood, J., Coe, H., and Highwood, E.: Regional variability of the composition of mineral dust from western Africa: Results from the AMMA SOP0/DABEX and DODO field campaigns, J. Geophys. Res.-Atmos., 113, D00C13, doi:10.1029/2008JD009903, 2008.
Gaudichet, A., Echalar, F., Chatenet, B., Quisefit, J. P., Malingre, G., Cachier, H., Artaxo, P., Maenhaut, W., and Buat-M´enard, P.: Trace elements in tropical African savannah biomass burning aerosol, J. Atmos. Chem., 22, 19–39, 1995.
Guieu, C., Bonnet, S., Wagener, T., and Loye-Pilot, M. D.: Biomass burning as a source of dissolved iron to the open ocean?, Geo-phys. Res. Lett., 32, L19608, doi:10.1029/2005GL022962, 2005. Guinot, B., Chachier, H., and Oikonomou, K.: Geochemical per-spectives from a new aerosol chemical mass closure, Atmos. Chem. Phys. Discuss., 6, 12021–12055, 2006,
http://www.atmos-chem-phys-discuss.net/6/12021/2006/. Hand, V. L., Capes, G., Vaughan, D. J., Formenti, P., Haywood, J.
M., and Coe, H.: Evidence of internal mixing of African dust and biomass burning particles by individual particle analysis using electron beam techniques, J. Geophys. Res., accepted, 2010. Haywood, J. M., Pelon, J., Formenti, P., Bharmal, N., Brooks, M.,
Capes, G., Chazette, P., Chou, C., Christopher, S., Coe, H., Cuesta, J., Derimian, Y., Desboeufs, K., Greed, G., Harrison, M., Heese, B., Highwood, E. J., Johnson, B., Mallet, M., Marti-corena, B., Marsham, J., Milton, S., Myhre, G., Osborne, S. R., Parker, D. J., Rajot, J. L., Schulz, M., Slingo, A., Tanre, D., and Tulet, P.: Overview of the Dust and Biomass-burning Experiment and African Monsoon Multidisciplinary Analysis Special Ob-serving Period-0, J. Geophys. Res.-Atmospheres, 113, D00C17, doi:10.1029/2008JD010077, 2008.
Ito, A. and Penner, J. E.: Historical emissions of carbona-ceous aerosols from biomass and fossil fuel burning for the period 1870–2000, Global Biogeochem. Cy., 19, GB2028, doi:10.1029/2004GB002474, 2005.
Jasinski, J., Pinkerton, K. E., Kennedy, I. M., and Leppert, V. J.: Surface oxidation state of combustion-synthesized [gamma]-Fe2O3 nanoparticles determined by electron energy loss spec-troscopy in the transmission electron microscope, Sensors and Actuators B: Chemical, 109, 19–23, 2005.
Johansen, A. M., Siefert, R. L., and Hoffmann, M. R.: Chemical composition of aerosols collected over the tropical North At-lantic Ocean, J. Geophys. Res., 105, 277–215, 2000.
Johnson, B. T., Osborne, S. R., Haywood, J. M., and Harrison, M. A. J.: Aircraft measurements of biomass burning aerosol over West Africa during DABEX, J. Geophys. Res.-Atmospheres, 113, D00C06, doi:10.1029/2007JD009451, 2008.
Journet, E., Desboeufs, K. V., Caquineau, S., and Colin, J. L.:
Min-eralogy as a critical factor of dust iron solubility, Geophys. Res. Letter, 35, L07805, doi:10.1029/2007GL031589, 2008. Kandler, K. and Schutz, L.: Climatology of the average
water-soluble volume fraction of atmospheric aerosol, Atmos. Res., 83, 77–92, 2007.
Kanthale, P., Ashokkumar, M., and Grieser, F.: Somoluminescence, sonochemistry (H2O2yield) and bubble dynamics: Frequency
and power effects, Ultrason. Sonochem., 15, 143–150, 2008. Kartcikeyan, S. and Balasubramanian, R.: Determination of water
soluble inorganic and organic species in atmospheric fine partic-ulates matter, Microchem. J., 82, 49–55, 2006.
Lafon, S., Sokolik, I. N., Rajot, J. L., Caquineau, S., and Gaudichet, A.: Characterization of iron oxides in mineral dust aerosols: Im-plications for light absorption, J. Geophys. Res., 111, D21207, doi:10.1029/2005JD007016, 2006.
Luo, C., Mahowald, N., Bond, T., Chuang, P. Y., Artaxo, P., Siefert, R., Chen, Y., and Schauer, J.: Combustion iron distribu-tion and deposidistribu-tion, Global Biogeochem. Cycles, 22, GB1012, doi:10.1029/2007GB002964, 2008.
Marino, F., Calzolai, G., Caporali, S., Castellano, E., Chiari, M., Lucarelli, F., Maggi, V., Nava, S., Sala, M., and Udisti, R.: PIXE and PIGE techniques for the analysis of Antarctic ice dust and continental sediments, Nucl. Instr. Meth. B, 266, 2396–2400, 2008.
Mason, B. H.: Principles of Geochemistry, John Wiley, New York, USA, 3rd Ed., 329 pp., 1966.
Mills, M. M., Ridame, C., Davey, M., La Roche, J., and Geider, R. J.: Iron and phosphorus co limit nitrogen fixation in the eastern tropical North Atlantic, Nature, 429(6989), 292–294, 2004. Moore, J. K., Doney, S. C., Glover, D. M., and Fung, I. Y.: Iron
cycling and nutrient limitation patterns in surface waters of the World Ocean, Deep Sea Res., Part II, 49(1–3), 463–507, 2002. Nwofor, O. K., Chineke, T. C., and Pinker, R. T.: Seasonal
char-acteristics of spectral aerosol optical properties at a sub-saharan site, Atmos. Res., 85, 38–51, 2007.
Osborne, S. R., Johnson, B. T., Haywood, J. M., Baran, A. J., Harrison, M. A. J., and McConnell, C. L.: Physical and op-tical properties of mineral dust aerosol during the Dust and Biomass-burning Experiment, J. Geophys. Res., 113, D00C03, doi:10.1029/2007JD009551, 2008.
Pehkonen, S. O., Siefert, R., Erel, Y., Webb, S., and Hoffmann, M. R.: Photoreduction of iron oxyhydroxides in the presence of im-portant atmospheric organic compounds, Environ. Sci. Technol., 10, 27, 2056–2062, 1993.
Rajot, J. L., Formenti, P., Alfaro, S., Desboeufs, K., Chevaillier, S., Chatenet, B., Gaudichet, A., Journet, E., Marticorena, B., Triquet, S., Maman, A., Mouget, N., and Zakou, A.: AMMA dust experiment: An overview of measurements performed dur-ing the dry season special observation period (SOP0) at the Bani-zoumbou (Niger) supersite, J. Geophys. Res.-Atmospheres, 113, D00C14, doi:10.1029/2008JD009906, 2008.
Sarthou, G., Baker, A. R., Blain, S., Achterberg, E. P., Boye, M., Bowie, A. R., Croot, P., Laan, P., de Baar, H. J. W., Jickells, T. D., and Worsfold, P. J.: Atmospheric iron deposition and sea-surface dissolved iron concentrations in the eastern Atlantic Ocean, Deep Sea Research Part I: Oceanographic Research Papers, 50, 1339– 1352, 2003.
Wang, Y., Zhuang, G., Sun, Y., and An, Z.: Water soluble part of the aerosol in the dust storm season-evidence of the mixing be-tween mineral and pollution aerosols, Atmos. Env., 39, 7020– 7029, 2005.
Washington, R., Todd, M. C., Engelstaedter, S., Mbainayel, S., and Mitchell, F.: Dust and the low-level circulation over the Bod´el´e Depression, Chad: Observations from BoDEx 2005, J. Geophys. Res., 111(D3), D03201, doi:10.1029/2005JD006502, 2006.