AMTD
6, 261–301, 2013Observations of SO2
and NO2 by mobile
DOAS in Guangzhou Eastern Area
F. C. Wu et al.
Title Page
Abstract Introduction
Conclusions References
Tables Figures
◭ ◮
◭ ◮
Back Close
Full Screen / Esc
Printer-friendly Version Interactive Discussion
Discussion
P
a
per
|
Dis
cussion
P
a
per
|
Discussion
P
a
per
|
Discussio
n
P
a
per
|
Atmos. Meas. Tech. Discuss., 6, 261–301, 2013 www.atmos-meas-tech-discuss.net/6/261/2013/ doi:10.5194/amtd-6-261-2013
© Author(s) 2013. CC Attribution 3.0 License.
Atmospheric Measurement Techniques Discussions
This discussion paper is/has been under review for the journal Atmospheric Measurement Techniques (AMT). Please refer to the corresponding final paper in AMT if available.
Observations of SO
2
and NO
2
by mobile
DOAS in the Guangzhou Eastern Area
during the Asian Games 2010
F. C. Wu1, P. H. Xie1, A. Li1, K. L. Chan1,2, A. Hartl2, Y. Wang1, F. Q. Si1, Y. Zeng1, M. Qin1, J. Xu1, J. G. Liu1, W. Q. Liu1, and M. Wenig3
1
Key Laboratory of Environmental Optical and Technology, Anhui Institute of Optics and Fine Mechanics, Chinese Academy of Sciences, Hefei, China
2
School of Energy and Environment, City University of Hong Kong, Hong Kong, China
3
Meteorological Institute, Ludwig-Maximilians-Universit ¨at Munich, Munich, Germany Received: 7 October 2012 – Accepted: 19 December 2012 – Published: 7 January 2013 Correspondence to: P. H. Xie ([email protected])
AMTD
6, 261–301, 2013Observations of SO2
and NO2 by mobile
DOAS in Guangzhou Eastern Area
F. C. Wu et al.
Title Page
Abstract Introduction
Conclusions References
Tables Figures
◭ ◮
◭ ◮
Back Close
Full Screen / Esc
Printer-friendly Version Interactive Discussion
Discussion
P
a
per
|
Dis
cussion
P
a
per
|
Discussion
P
a
per
|
Discussio
n
P
a
per
|
Abstract
Mobile Differential Optical Absorption Spectroscopy measurements of SO2 and NO2 were performed in the Guangzhou Eastern Area (GEA) during the Guangzhou Asian Games 2010 from November 2010 to December 2010. Spatial and temporal distri-butions of SO2 and NO2 in this area were obtained and emission sources were de-5
termined by using wind field data. The NO2 vertical column densities were found to agree with OMI values. The correlation coefficient (R2) was 0.88 after cloud filtering.
During the Guangzhou Asian Games and Asian Paralympics (Para) Games, the SO2
and NO2emissions in the area were quantified using averaged wind speed and wind direction. For times outside the Games the average SO2 emission was estimated to 10
be 9.50±0.90 tons per hour and the average NO2 emission was estimated to be 3.50±1.89 tons per hour. During the phases of the Asian and Asian Para Games, the SO2and NO2emissions were reduced by 53.5 and 46 %, respectively, compared to the usual condition. We also investigated the influence of GEA on Guangzhou University Town, the main venue located northwest of the GEA, and found that SO2 concentra-15
tions here were about tripled by emissions from the GEA.
1 Introduction
NO2 is an important trace gas in the atmosphere because it readily undergoes pho-tochemical reactions with other air pollutants. High NO2 levels, however, are a health risk. For example, long-term exposure to NO2 increases the symptoms of bronchitis 20
AMTD
6, 261–301, 2013Observations of SO2
and NO2 by mobile
DOAS in Guangzhou Eastern Area
F. C. Wu et al.
Title Page
Abstract Introduction
Conclusions References
Tables Figures
◭ ◮
◭ ◮
Back Close
Full Screen / Esc
Printer-friendly Version Interactive Discussion
Discussion
P
a
per
|
Dis
cussion
P
a
per
|
Discussion
P
a
per
|
Discussio
n
P
a
per
|
generation. SO2 and NO2 tend to form sulfuric and nitric acids, respectively, which in the form of acid rain, are one of the causes of deforestation (WHO, 2006).
Population growth, industrial development, and heavy traffic lead to higher energy consumption and, therefore, an increasing in the emission of pollutants such as SO2, NO2, and Volatile Organic Compounds (VOCs) into the atmosphere. In recent years, 5
China has experienced a significant increase in atmospheric pollutant concentrations because of rapid industrial development, which has an important impact on ecosys-tems and human health. The Pearl River Delta (PRD) in the south of China is one of the three major economic areas (the other two are the Yangtze River Delta and the Beijing-Tianjin-Hebei Economic region). It includes many populated and strongly indus-10
trialized cities such as Guangzhou and Shenzhen, and has experienced an extremely fast economic development (Zhang et al., 2008a,b; Wang et al., 2008). PRD has a to-tal land area of 42 794 km2 and a population of over 38 million (Cao et al., 2004). As a result, emissions of SO2, NO2, and other pollutants have also largely increased in this area (Zhang et al., 2007).
15
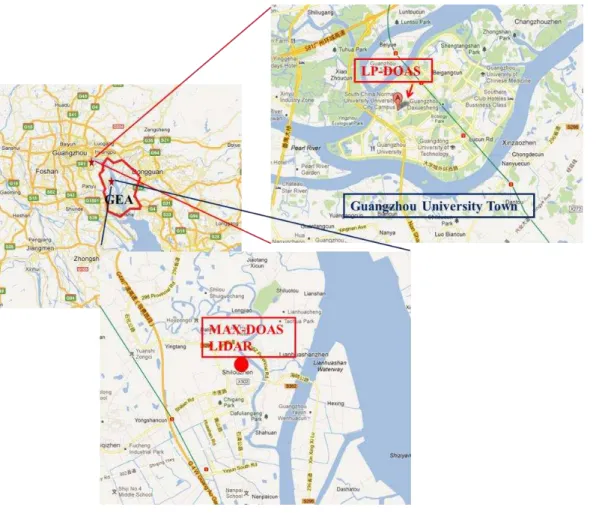
The 16th Asian Games was held in the city of Guangzhou from November 2010 to December 2010. The pollutant sources were identified in order to alleviate air pollu-tion for this occasion. In addipollu-tion, strategies including emission control for factories, vehicle limitation, and so forth were employed by the Guangzhou government to re-duce the air pollution problem during the Asian Games. The Guangzhou Eastern Area 20
(GEA) (Fig. 1) was considered the most seriously affected region of the city because of the many pollutant sources present, such as the Guangdong Yuehua Power Plant (the largest power plant in Guangzhou according to the Guangzhou Environmental Center), the Guangzhou Hengyun Thermal Power Company, and the Guangzhou Zhujiang Steel Company, where air pollutants such as SO2, NO2, VOCs, and fine particulates are emit-25
AMTD
6, 261–301, 2013Observations of SO2
and NO2 by mobile
DOAS in Guangzhou Eastern Area
F. C. Wu et al.
Title Page
Abstract Introduction
Conclusions References
Tables Figures
◭ ◮
◭ ◮
Back Close
Full Screen / Esc
Printer-friendly Version Interactive Discussion
Discussion
P
a
per
|
Dis
cussion
P
a
per
|
Discussion
P
a
per
|
Discussio
n
P
a
per
|
weeks and from a few kilometers to hundreds of kilometers. Therefore, understanding the spatial and temporal distribution as well as the emission sources of air pollutants in GEA was important for environmental management during the Guangzhou Asian Games. Air pollutants were routinely monitored by the local environmental protection agency using a network of ground-level monitors. Data from this network were insuffi -5
cient for spatial distribution and transportation processes as well as emission sourcing. Previously, regional studies in the PRD combined aircraft measurements and models to examine spatial and vertical distributions of O3, SO2, NOx, PM10, and PM2.5(Wang et al., 2008) or used a bottom-up approach to estimate emissions of NOx, SO2, CO, VOCs, and fine particulates (Zheng et al., 2009; He et al., 2011). These studies fo-10
cused on the larger area of the PRD but did not consider smaller-scale distributions of air pollutants or area sources like the GEA. In this study, Differential Optical Ab-sorption Spectroscopy (DOAS) on a mobile platform was used to detect spatial and temporal distributions and emissions of SO2 and NO2 related to the GEA. This tech-nique was first used to measure volcanic emissions (Edner et al., 1994; Galle et al., 15
2003) and subsequently applied to determine the emission of point sources (e.g. power plants, oil refineries, etc.) and area sources (e.g. cities and industrial areas). Johans-son et al. (2008, 2009) and Rivera et al. (2009) examined the outflow of SO2, NO2, and HCHO in Mexico, Beijing and the Tula industrial area. NOxemissions in Mannheim and Ludwigshafen using mobile MAX-DOAS (Multi-Axis Differential Optical Absorp-20
tion Spectroscopy, MAX-DOAS) were investigated by Ibrahim et al. (2010). The same method was used by Shaiganfar et al. (2011) to quantify emissions in Delhi. In China, several measurements based on mobile DOAS were also carried out (Li et al., 2005, 2007b; Wu et al., 2011). However, in previous field measurements that used a zenith viewing DOAS instrument on a mobile platform, emissions were estimated by first tak-25
AMTD
6, 261–301, 2013Observations of SO2
and NO2 by mobile
DOAS in Guangzhou Eastern Area
F. C. Wu et al.
Title Page
Abstract Introduction
Conclusions References
Tables Figures
◭ ◮
◭ ◮
Back Close
Full Screen / Esc
Printer-friendly Version Interactive Discussion
Discussion
P
a
per
|
Dis
cussion
P
a
per
|
Discussion
P
a
per
|
Discussio
n
P
a
per
|
location were used to obtain estimates of absolute vertical columns for NO2 and SO2, making the analysis of data from the mobile measurement relatively simple (see de-tailed description in Sect. 2.4.1).
In this paper, we present the mobile DOAS measurements carried out during the Asian Games 2010 in Guangzhou, South China, where we derived vertical columns of 5
SO2and NO2along a closed path around the GEA using MAX-DOAS data at a fixed lo-cation, to estimate emissions from this area. We study the variation of these pollutants for different wind fields and emission periods during the games, thereby identifying indi-vidual sources. Furthermore, we compare NO2vertical columns from our mobile mea-surements to those from OMI. Finally, the influence of GEA emissions on the venue of 10
the games at Guangzhou University Town is explored.
The paper is organized as follows: In Sect. 2, the measurements in GEA, our mea-surement instrument, and principle are introduced. In Sect. 3, our results and discus-sion, including the distribution of SO2and NO2around GEA, the comparison with OMI NO2, and emissions of SO2 and NO2 from GEA with their influence on the downwind 15
region are all presented. In Sect. 4, the results of our study are summarized.
2 Experiment and data analysis
2.1 Description of the measurements in GEA
GEA is located southeast of Guangzhou City and west of Dongguan City (Fig. 1). The measurement route shown in Fig. 1 starts from the Huangpu East Road clockwise to 20
Huangpu Bridge surrounding GEA. The total path is about 140 km and covers an area of about 1000 km2, and takes approximately 2.5 h to complete. Our measurements took place for seven weeks, from 9 November to 26 December, 2010, starting every odd day at 10:00 a.m. LT. The Guangzhou Municipal Government attempted to control traffic-induced air pollution for the Asian and Asian Para Games by limiting the number 25
AMTD
6, 261–301, 2013Observations of SO2
and NO2 by mobile
DOAS in Guangzhou Eastern Area
F. C. Wu et al.
Title Page
Abstract Introduction
Conclusions References
Tables Figures
◭ ◮
◭ ◮
Back Close
Full Screen / Esc
Printer-friendly Version Interactive Discussion
Discussion
P
a
per
|
Dis
cussion
P
a
per
|
Discussion
P
a
per
|
Discussio
n
P
a
per
|
only allowed to drive on odd days from 1 November to 29 November and from 5 to 21 December 2010, whereas vehicles with even number plates were allowed only on even days. Our van has an odd number plate; therefore, we had a total of 25 days of mea-surements. During the entire measurement period, the temperature varied from 22◦C to 28◦C, and the wind blew predominantly from the north/northeast (see Sect. 3.1.1 for 5
further details).
2.2 Description of the instrument
Our mobile DOAS instrument records sunlight scattered into the telescope pointing to the zenith. A schematic diagram of the mobile DOAS system developed at the Anhui Institute of Optics and Mechanics (AIOFM) is shown in Fig. 2. The components of our 10
AIOFM mobile DOAS instrument are the telescope, a UV/VIS detector spectrometer unit, a computer, and a Global Positioning System (GPS). The telescope collects scat-tered sunlight that enters the spectrometer (Ocean Optics HR2000) through an optical fiber. The spectrometer, which is stored in a miniature refrigerator that has a stable tem-perature, has a spectral resolution of about 0.6 nm and a spectral range of 290 nm to 15
420 nm. The GPS tracks the coordinates of the measurement route as well as provides the car speed and acquisition time for each spectrum. A miniature weather station is fixed on the roof of the measurement van in order to record meteorological data such as wind speed, wind direction, temperature, humidity, and pressure along the route. The entire system is automatically controlled by our AIOFM mobile DOAS software (Li 20
et al., 2005).
The Long-Path DOAS instrument used to explore the influence of GEA on the down-wind region (see Sect. 3.4) uses a Xenon lamp as light source and a UV/VIS spec-trometer (QE65000, Ocean Optics). The detailed setup of the Long-Path DOAS instru-ment has been provided by Qin et al. (2006). The instruinstru-ment is mounted on the third 25
AMTD
6, 261–301, 2013Observations of SO2
and NO2 by mobile
DOAS in Guangzhou Eastern Area
F. C. Wu et al.
Title Page
Abstract Introduction
Conclusions References
Tables Figures
◭ ◮
◭ ◮
Back Close
Full Screen / Esc
Printer-friendly Version Interactive Discussion
Discussion
P
a
per
|
Dis
cussion
P
a
per
|
Discussion
P
a
per
|
Discussio
n
P
a
per
|
260 nm to 369 nm, allows the monitoring of SO2, HCHO, NO2, and O3among others. During this campaign, the instrument is mainly used to monitor SO2, NO2, and O3.
In this study, the MAX-DOAS instrument is used to obtain the vertical columns for NO2and SO2. This system is also from the AIOFM, with parts such as a stepper mo-tor used to rotate a telescope, a miniature spectrometer (Ocean Optics HR2000) with 5
a spectral resolution of 0.6 nm and a miniature refrigerator to maintain a stable tem-perature. Scattered sunlight is collected and focused by the telescope and is led into the spectrometer unit through an optical fiber. This MAX-DOAS system is designed to adjust different viewing directions into a desired elevation angle sequentially observed at 5◦, 10◦, 20◦, 30◦, and 90◦ by a stepper motor. The detailed description of our MAX-10
DOAS system is given in Li et al. (2007b).
2.3 Description of OMI
The Ozone Monitoring Instrument (OMI) (Levelt et al., 2006) onboard the NASA Earth Observation System (EOS)–Aura satellite was launched on 15 June 2004. It is capa-ble of monitoring global atmospheric NO2 via observation of backscattered sunlight 15
in the wavelength range of 270 to 500 nm. The crossing time for OMI is 13:45 LT (local time) on the ascending node. Compared with NO2 satellite observations from GOME, GOME-2, and SCHIAMACHY, OMI can provide a dataset with higher spa-tial (13×24 km) and temporal resolution (daily global coverage). The OMI retrieval of NO2 vertical columns based on the DOAS method and consists of three steps: deter-20
mination of slant column densities, conversion to vertical column densities using the so-called air mass factor (AMF), and estimation of the stratospheric contribution. The detailed description of this retrieval process can be found in Bucsela et al. (2006).
Ground-based (Louisa et al., 2008) or airborne (Dix et al., 2009; Heue et al., 2011; Sluis et al., 2010) measurements cover a limited spatial area, where vertical column 25
AMTD
6, 261–301, 2013Observations of SO2
and NO2 by mobile
DOAS in Guangzhou Eastern Area
F. C. Wu et al.
Title Page
Abstract Introduction
Conclusions References
Tables Figures
◭ ◮
◭ ◮
Back Close
Full Screen / Esc
Printer-friendly Version Interactive Discussion
Discussion
P
a
per
|
Dis
cussion
P
a
per
|
Discussion
P
a
per
|
Discussio
n
P
a
per
|
(Wagner et al., 2010). In the current study, the OMI tropospheric NO2data product of NASA is used (Bucsela et al., 2006). To achieve a better comparison between OMI NO2 and mobile DOAS data, the OMI tropospheric NO2VCDs are gridded onto a 0.1◦
×0.1◦
grid (Wenig et al., 2008; Chan et al., 2012). The NO2 VCDs are then compared with the corresponding OMI grid cell (113.50◦E–113.75◦E, 22.75◦N–23.00◦N).
5
2.4 Principle of mobile DOAS
2.4.1 Retrieval of vertical columns for tropospheric trace gases
The DOAS technique has been employed in numerous applications that use artificial light sources or sunlight with instruments mounted on various fixed or mobile platforms (see Platt and Stutz, 2008 for a comprehensive overview). The DOAS evaluation pro-10
cedure is described in this section in relation to our mobile observation of sunlight intensities in a zenith viewing direction, and the retrieval of tropospheric SO2and NO2 from these intensity spectra. Details of the DOAS analysis are presented in Platt and Stutz (2008).
The spectral evaluation applied to each recorded spectrum while the van moves 15
along the measurement route starts with a dark current correction, followed by the divi-sion with a Frauenhofer reference spectrum. Subsequently, a high pass filter is applied to the logarithm of this ratio to separate the broad and narrow band spectral structures. Differential slant column densities (SCD, defined as the concentration integrated along the light path), i.e. amounts of trace gas relative to the reference, are then obtained 20
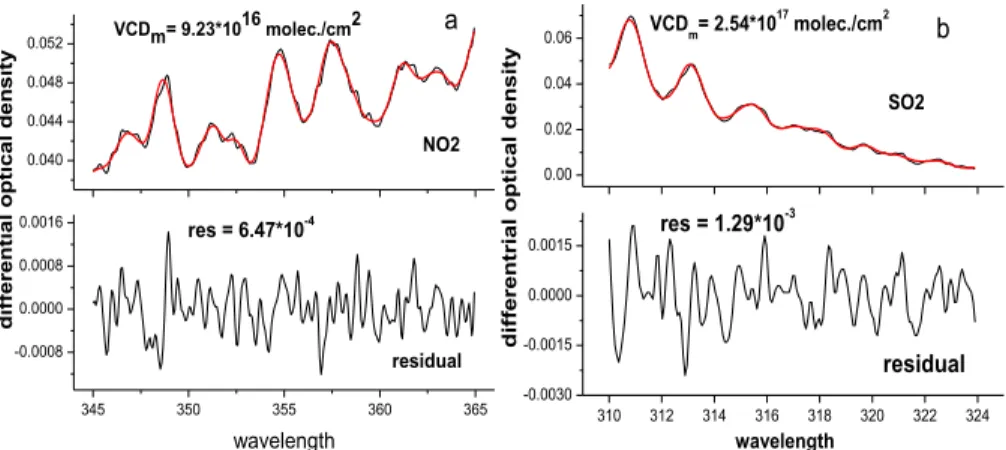
by fitting narrow band spectral absorption cross sections to the processed measure-ment spectra. Figure 3 illustrates such a DOAS fit for NO2and SO2using the Windoas software package (Van Roozendael et al., 2001) for mobile DOAS measurement.
During our retrieval process, a spectrum is first selected arbitrarily on the upwind path as the reference spectrum to obtain the concentration distribution trends along 25
AMTD
6, 261–301, 2013Observations of SO2
and NO2 by mobile
DOAS in Guangzhou Eastern Area
F. C. Wu et al.
Title Page
Abstract Introduction
Conclusions References
Tables Figures
◭ ◮
◭ ◮
Back Close
Full Screen / Esc
Printer-friendly Version Interactive Discussion
Discussion
P
a
per
|
Dis
cussion
P
a
per
|
Discussion
P
a
per
|
Discussio
n
P
a
per
|
spectrum with the lowest measurement value for each day is then chosen as the Frauenhofer reference to minimize the effect of potential instrumental changes on dif-ferent days.
The wavelength range of 310 to 324 nm with three strong absorption peaks is se-lected for the SO2fit. Absorption cross sections of SO2, NO2, and O3at 293 K are taken 5
from Bogumil et al. (2003). Apart from the Frauenhofer reference spectrum, a Ring spectrum is also included in the fit as described in Honninger et al. (2004). The syn-thetic Ring spectrum is generated from the measured Frauenhofer reference spectrum using the DOASIS software (Kraus, 2006). For the analysis of NO2, the spectral win-dow of 345 to 365 nm is selected and the cross section of O4 at 298 K (Greenblatt, 10
1990) is also included. The wavelength calibration is performed using a highly resolved solar spectrum (Kurucz et al., 1984). An example for such spectral fitting is shown in Fig. 3, where the fit residual of NO2 (Fig. 3a) and SO2 (Fig. 3b) are 6.47×10⁻⁴ and 1.29×10⁻³, respectively, due to the unknown structure and system noise. The fit
uncertainties of retrieved VCDs from these two spectra for NO2 and SO2 are about 15
1.70 and 2.10 %, respectively. For all measured spectra, these fit uncertainties are less than 15 % for NO2and 20 % for SO2.
The procedure described so far yields differential slant column densities relative to the reference spectrum. The assumption by Johansson et al. (2008) and Rivera et al. (2009) that around noon the slant column densities for the zenith viewing direc-20
tion approximate those of the vertical columns is now adopted. The tropospheric ver-tical columns obtained from the MAX-DOAS observation at the time the mobile DOAS passes its location (Fig. 1) is used in order to eliminate the reference. The difference
between the MAX-DOAS VCD and the mobile DOAS differential VCD is considered
as the “clean-air” background (This difference is called “offset”). The mobile DOAS dif-25
ferential VCDs are then converted into absolute columns by adding this “offset” to all values along the path.
AMTD
6, 261–301, 2013Observations of SO2
and NO2 by mobile
DOAS in Guangzhou Eastern Area
F. C. Wu et al.
Title Page
Abstract Introduction
Conclusions References
Tables Figures
◭ ◮
◭ ◮
Back Close
Full Screen / Esc
Printer-friendly Version Interactive Discussion
Discussion
P
a
per
|
Dis
cussion
P
a
per
|
Discussion
P
a
per
|
Discussio
n
P
a
per
|
VCDs using tropospheric differential air mass factors (DAMFs) according to the follow-ing formula:
VCDtrop=DSCDs
DAMF . (1)
The radiative transfer model SCIATRAN (Rozanov et al., 2002) is used to calculate DAMFs under the assumption that aerosol and trace gas profiles are given by constant 5
values below the boundary layer height and the exponential profiles above. The height of the boundary layer is deduced from LIDAR observations (Fig. 1) carried out by the AIOFM and was on average about 1.5 km during our measurements. For the radiative transfer calculations, aerosol extinction coefficients within the layer are taken from the LIDAR, while the NO2 and SO2 mixing ratios are obtained from the Long-path DOAS 10
measurements. Aerosol and trace gas profiles above the boundary layer are sourced from the LOWTRAN database (Kneizys et al., 1988) and the US standard atmosphere (US Government Printing Office, 1976), respectively.
2.4.2 Emission calculation
The mobile DOAS measurement allows the emission from pollutant sources to be fur-15
ther quantified for known wind direction, wind speed, and car speed. The total SO2and NO2emissions from a source are determined using the following equation (Johansson et al., 2009; Ibrahim et al., 2010):
Fluxgas=XVCDgas·Vm·Vw
⊥·∆t (2)
where VCDgasis the vertical column density,Vmis the car speed,Vw
⊥ is the component 20
AMTD
6, 261–301, 2013Observations of SO2
and NO2 by mobile
DOAS in Guangzhou Eastern Area
F. C. Wu et al.
Title Page
Abstract Introduction
Conclusions References
Tables Figures
◭ ◮
◭ ◮
Back Close
Full Screen / Esc
Printer-friendly Version Interactive Discussion
Discussion
P
a
per
|
Dis
cussion
P
a
per
|
Discussion
P
a
per
|
Discussio
n
P
a
per
|
Wind direction and speed are taken from the miniature mobile weather station in-stalled on the van. The car speed, location, and direction of each segment are from the GPS.
3 Results and discussion
3.1 Distribution of SO2and NO2around GEA
5
3.1.1 Identification of emission sources
In this section, the distributions of SO2and NO2 vertical columns along the measure-ment path are analyzed following the results of the mobile DOAS data described in Sect. 2. The possible emission sources are discussed further using these distributions for different wind fields.
10
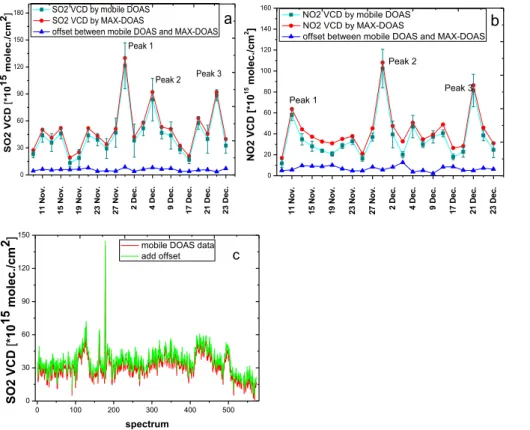
Figure 4 shows the resulting MAX-DOAS VCDs during the measurement period. Fig-ure 4a, b also illustrates the mobile DOAS VCDs and the offsets between the two in-struments. The average offsets of SO2and NO2are 5.72±1.49×10¹⁵molecules cm−2 and 6.85±2.49×10¹⁵molecules cm−2, respectively. An example result of SO
2 after SO2offset correction on 25 November is shown in Fig. 4c. Three peaks are also found 15
in Fig. 4a and b. The peaks of SO2 (peak1, peak2, peak3) are related to the strong emissions of pollutant sources under the northeasterly wind. The peaks of NO2(peak1 and peak2) on 11 and 29 November are presumably caused by the same pollutant source, but the peak on 21 December (peak3) may be related to the transport from other regions by the northwesterly wind.
20
AMTD
6, 261–301, 2013Observations of SO2
and NO2 by mobile
DOAS in Guangzhou Eastern Area
F. C. Wu et al.
Title Page
Abstract Introduction
Conclusions References
Tables Figures
◭ ◮
◭ ◮
Back Close
Full Screen / Esc
Printer-friendly Version Interactive Discussion
Discussion
P
a
per
|
Dis
cussion
P
a
per
|
Discussion
P
a
per
|
Discussio
n
P
a
per
|
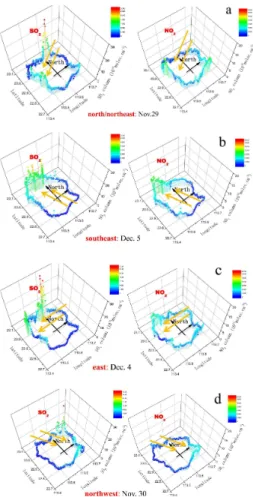
the path, four types of wind fields are distinguished in our study: north or northeast, southeast, east, and northwest.
Typical spatial distributions of SO2 and NO2 vertical columns around GEA for these four different wind fields are shown in Fig. 6. The maps for SO2in Fig. 6 show a peak in the north irrespective of wind direction, suggesting an additional emission source out-5
side the GEA and north from it. The comparison for wind direction from north/northeast and east versus west further suggested that it is located in the northeast rather than the northwest. No such peak exists for NO2in the north if the wind is coming from the north, so that we infer an SO2source indeed lies in the northeast of GEA (source 1 in Fig. 7).
10
For the southeast wind, downwind peaks are found simultaneously for SO2and NO2 in the northwest corner of our route (Fig. 6b). The corresponding downwind peaks for the reverse wind direction from the northwest are less pronounced, and thus sources of NO2 and SO2 within the encircled measurement area, but closer to the northern measurement route, can be identified (source 2 in Fig. 7). The location of peaks in the 15
downwind region for the north and northeast wind (Fig. 6a and c) is consistent with this conjecture.
Increased values of NO2appeared for all wind directions in the southeast/south of the measurement route, especially on 29 November and 4 December. These high column densities can most likely be attributed to traffic emissions from Humen Bridge in the 20
south of GEA (Fig. 7), the main channel from Shenzhen and Dongguan to Guangzhou. During the Asian Games, the Guangzhou government set up a security checkpoint here, which occasionally caused traffic jams that enhanced high NO2concentration.
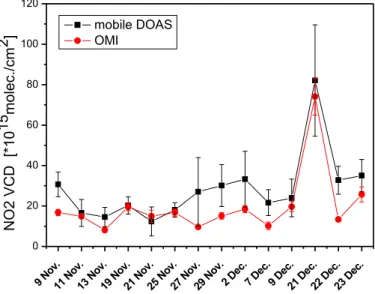
3.1.2 Comparison with OMI NO2
The comparison between NO2VCDs of the mobile DOAS and OMI for the ground pixel 25
AMTD
6, 261–301, 2013Observations of SO2
and NO2 by mobile
DOAS in Guangzhou Eastern Area
F. C. Wu et al.
Title Page
Abstract Introduction
Conclusions References
Tables Figures
◭ ◮
◭ ◮
Back Close
Full Screen / Esc
Printer-friendly Version Interactive Discussion
Discussion
P
a
per
|
Dis
cussion
P
a
per
|
Discussion
P
a
per
|
Discussio
n
P
a
per
|
Aside from the averaged value of OMI for large areas and its insensitivity to the near-surface pollutant sources, the influence of clouds was also considered and treated as a dominant factor for the OMI and mobile DOAS observations.
Cloud fractions for our 14 days of measurement (Table 1) varied considerably during the measurement period. A cloud fraction of 0.4 was used as threshold to filter both 5
data for comparison. This fraction was exceeded on 21, 27, 29 November as well as 7, 9 December. Figure 9 shows the correlation between the two measurements for cloud fractions smaller than 0.4. The correlation coefficient (R2) is 0.88, indicating that the relative changes observed in OMI and mobile DOAS were coincident.
Although both instruments agree in general, high NO2 VCDs were likely underesti-10
mated by OMI while low NO2 VCDs were likely overestimated. These discrepancies, however, cannot be simply attributed to clouds. For example, the 22 and 23 December cloud coverage was lower yet the discrepancies were higher with respect to those of the 11, 19, and 25 November cloud coverage. The disagreement between both data sets could also be caused by the different assumptions on the calculation of their air 15
mass factors including different aerosol and trace gas profiles, ground albedo, etc. Furthermore, mobile and satellite measurements refer to slightly different times. The dependency on the NO2profile assumed for the AMF calculation is discussed by Chan et al. (2012) and Wang et al. (2012). In Fig. 10, the NO2surface concentrations were significantly enhanced on 22 and 23 December. The NO2VCDs from OMI were under-20
estimated on 22 and 23 December. The comparison of spatial patterns in the two data sets in Fig. 11 shows that both mobile DOAS and OMI captured the high NO2 VCDs in the northern and southern part of the mobile DOAS route (in the northern part due to industrial emissions, in the southern part due to vehicle emissions from the Humen Bridge) as well as low VCDs in the western part (white circles in Fig. 11).
AMTD
6, 261–301, 2013Observations of SO2
and NO2 by mobile
DOAS in Guangzhou Eastern Area
F. C. Wu et al.
Title Page
Abstract Introduction
Conclusions References
Tables Figures
◭ ◮
◭ ◮
Back Close
Full Screen / Esc
Printer-friendly Version Interactive Discussion
Discussion
P
a
per
|
Dis
cussion
P
a
per
|
Discussion
P
a
per
|
Discussio
n
P
a
per
|
3.2 Estimation of SO2and NO2emissions
3.2.1 Emission of SO2and NO2from GEA
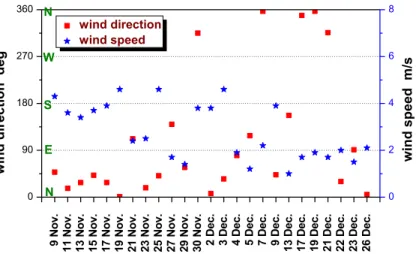
As a key component in the estimation of SO2 and NO2 emissions, wind fields can be the source of large errors. Wind fields are generally used to estimate emissions about 400 m a.g.l. (according to the stack height of power plant and height of elevated plume 5
as discussed by Mellqvist et al., 2007). A wind profile radar would provide highly ac-curate data. Such data, however, are not available for our measurements. Wind data from our mobile weather station are used instead. To minimize the error caused by the influence of surface processes on the wind field, the measurement days with rel-atively stable and constant vertical wind from ground to 400 m height are selected to 10
estimate emissions. Figure 12 compares the wind direction (Fig. 12a) and wind speed (Fig. 12b) at 400 m height to the surface once every 14 days from 9 November to 22 December. The wind field at 400 m is taken from observations at Kings Park (station number: 45004, 114.16◦E, 22.31◦N) in Hong Kong, about 80 km southeast of GEA (http://weather.uwyo.edu/upperair/sounding.html). With few exceptions, the wind fields 15
at both altitudes and locations generally agree.
The total emissions of SO2 and NO2 from the encircled area are estimated using Eq. (2). The estimated emissions of SO2 and NO2from GEA for 14 days are shown in Fig. 13, with a fractional cloud cover lower than 0.4 and a stable wind field. The entire measurement period is divided into five phases: before the Asian Games (9 and 11 20
November, phase 1), during the Asian Games (15, 17, 19, and 23 November, phase 2), the time between the Asian Games and the Asian Para Games (2, 3, and 4 December, phase 3), during the Asian Para Games (13, 17, and 19 December, phase 4), and after the Games (21 and 22 December, phase 5). SO2 emissions varied strongly between the different phases (by a factor of 5), where the lower and lowest emissions occurred 25
AMTD
6, 261–301, 2013Observations of SO2
and NO2 by mobile
DOAS in Guangzhou Eastern Area
F. C. Wu et al.
Title Page
Abstract Introduction
Conclusions References
Tables Figures
◭ ◮
◭ ◮
Back Close
Full Screen / Esc
Printer-friendly Version Interactive Discussion
Discussion
P
a
per
|
Dis
cussion
P
a
per
|
Discussion
P
a
per
|
Discussio
n
P
a
per
|
The reduced emission of SO2during the Asian Games and Asian Para Games could be caused mainly by the pollution control strategy of the local environmental protection agency. Meteorological conditions also play an important role for emissions from GEA. Persistent rainfall from 10 to 12 December and again from 14 to 16 December helped to remove air pollutants, thereby decreasing emissions from GEA during the Asian Para 5
Games. Table 2 summarizes the average SO2emission for the different phases of the measurement period. For times outside the Games (phases 1, 3, and 5), SO2emission was estimated to be 9.50 tons per hour (approximately 83.2 ×10³tons per year), which
is consistent with the value of 84.60 ×10³tons per year from the Guangzhou emission inventory (Guangzhou Municipality State of the Environment, 2010). On the other hand, 10
the average NO2emission for this time was estimated to be 3.5 tons per hour. During the Games (including phases 2 and 4) the emissions of SO2 and NO2 were reduced by 53.5 and 46 %, respectively, compared with the time outside the Games (including phases 1, 3, and 5).
Errors in the calculation of emissions can be due to errors in the column retrieval, 15
wind field, and car speed. The fitting error in the column retrieval was estimated to be less than 15 % for NO2 and 20 % for SO2 (Fig. 3). The error of car speed was about 1 % according to the GPS. In our study, the errors caused by uncertainties in the wind field were not determined. Mellqvist et al. (2007) estimated the errors to be as large as 30 %, and thus the error of total emissions is estimated to be about 33 % for NO2and 20
36 % for SO2.
3.2.2 Influence of SO2emissions from the GEA on the downwind region
Knowledge of emissions and transportation from large area sources is crucial for the control and management of local environment problems. Guangzhou University Town (113.37◦E, 23.05◦N) hosed numerous events during the Asian Games, which raised is-25
AMTD
6, 261–301, 2013Observations of SO2
and NO2 by mobile
DOAS in Guangzhou Eastern Area
F. C. Wu et al.
Title Page
Abstract Introduction
Conclusions References
Tables Figures
◭ ◮
◭ ◮
Back Close
Full Screen / Esc
Printer-friendly Version Interactive Discussion
Discussion
P
a
per
|
Dis
cussion
P
a
per
|
Discussion
P
a
per
|
Discussio
n
P
a
per
|
concentration in Guangzhou University Town is expected to increase due to the contri-bution of GEA emission. SO2is selected as the tracer gas because it originates from industrial emissions, unlike NO2 which is still affected by local vehicle emissions. To investigate how emissions from GEA affect Guangzhou University Town for southeast-erly winds, a long-path DOAS instrument is set up there to monitor possible downwind 5
transport of SO2.
The paths of air masses for southeasterly wind on 21 and 27 November, and 5 and 13 December are shown in Fig. 14. On these days, the wind traversed GEA and the SO2concentrations measured downwind at the University Town monitoring site based on our Long-path instrument, which were significantly higher as illustrated in Fig. 15 10
(shaded box). This is consistent with the observation by our mobile DOAS in Fig. 6b for the southeasterly wind. Wind from the southeast also occurred on 24 and 28 November and 10 (Fig. 16a) and 12 (Fig. 16b) December when we could not carry out mobile measurements due to traffic limitations. The SO2 concentrations were also enhanced at the University Town monitoring site on these four days (Fig. 15).
15
Considering all these days, the average SO2 concentrations for southeasterly and non-southeasterly winds measured by the Long-path DOAS at the downwind loca-tion are shown in Fig. 17. Daily averages of SO2 are enhanced by a factor 3 when air masses traversed GEA, compared to days when the wind came from other direc-tions. Therefore, GEA is concluded to be a major contributor to SO2 pollution in the 20
Guangzhou University Town area.
4 Conclusions
In this paper, mobile DOAS observations carried out in GEA during the Guangzhou Asian Games from November to December 2010 are reported. These measurements were used to investigate the spatial and temporal distributions of SO2and NO2around 25
AMTD
6, 261–301, 2013Observations of SO2
and NO2 by mobile
DOAS in Guangzhou Eastern Area
F. C. Wu et al.
Title Page
Abstract Introduction
Conclusions References
Tables Figures
◭ ◮
◭ ◮
Back Close
Full Screen / Esc
Printer-friendly Version Interactive Discussion
Discussion
P
a
per
|
Dis
cussion
P
a
per
|
Discussion
P
a
per
|
Discussio
n
P
a
per
|
A MAX-DOAS instrument at a fixed location concurrently measured estimates
of absolute vertical columns for NO2 and SO2 of the mobile DOAS
measure-ments. The average offsets of SO2 and NO2 between the mobile DOAS and MAX-DOAS were 5.72±1.49×10¹⁵molecules cm−2and 6.85
±2.49×10¹⁵molecules cm−2,
respectively. 5
Distributions of SO2and NO2vertical columns were obtained with help of the mobile DOAS system. High SO2values appeared in the northeast and northwest of our mea-surement path under north and southeast wind fields, respectively. High NO2 values were found in the north and southeast of the measurement path with higher variability due to varying traffic emissions. Possible emission sources were determined to explain 10
these distributions using the information from different wind fields. Pollutant sources in the northeast of GEA, outside the closed measurement route and sources in the north, within the area encircled were also identified. Our NO2 vertical columns were com-pared with OMI data and were found to be similar in spatial patterns. The correlation coefficient (R2) of the vertical columns after cloud filtering was 0.88, but the absolute 15
values measured by our mobile DOAS were mostly higher than the OMI data. SO2and NO2 emissions from the GEA during the Asian Games period were also calculated. Lower and lowest emissions of SO2were found to occur during the Asian Games and Asian Para Games, respectively. Outside the Asian Games period, the average emis-sion of SO2 was estimated to be 9.50±0.90 tons per hour (83.2 thousand tons per
20
year), which is consistent with the value of 84.6 thousand tons per year from a local emission inventory. In comparison, the average emission of NO2was estimated to be 3.50±1.89 tons per hour. During the Games, the emissions of SO2 and NO2 were reduced by 53.50 and 46 %, respectively. The error of total emissions was estimated to be about 33 % for NO2 and 36 % for SO2. Using LP-DOAS measurements at the 25
AMTD
6, 261–301, 2013Observations of SO2
and NO2 by mobile
DOAS in Guangzhou Eastern Area
F. C. Wu et al.
Title Page
Abstract Introduction
Conclusions References
Tables Figures
◭ ◮
◭ ◮
Back Close
Full Screen / Esc
Printer-friendly Version Interactive Discussion
Discussion
P
a
per
|
Dis
cussion
P
a
per
|
Discussion
P
a
per
|
Discussio
n
P
a
per
|
Acknowledgements. The authors would like to thank the Guangzhou Environmental Center for
supporting the experiment. We also want to thank our two drivers, Shaoli Wang and Zongmao Xu, whose skillful driving ensured that the experiment could be carried out successfully and safely. This work was also made possible by the support of Special research funding for the pub-lic industry sponsored by Ministry of Environmental Protection of PRC (Grant No: 201109007)
5
and the National Natural Science Foundation of China 40905010, 41275038.
References
Bogumil, K., Orphal, J., Homann, T., Voigt, S., Spietz, P., Fleischmann, O. C., Vogel, A., Hart-mann, M., Kromminga, H., BovensHart-mann, H., Frerick, J., and Burrows, J. P.: Measurements of molecular absorption spectra with the SCIAMACHY pre-flight model: instrument
charac-10
terization and reference data for atmospheric remote-sensing in the 230–2380 nm region, J. Photoch. Photobio. A, 157, 167–184, 2003.
Bucsela, E., Celarier, E., Wenig, M., Gleason, J., Veefkind, P., Boersma, K., and Brinksma, E.: Algorithm for NO2 vertical column retrieval from the Ozone Monitoring Instrument, IEEE T.
Geosci. Remote, 44, 1245–1258, 2006.
15
Cao, J. J., Lee, S. C., Ho, K. F., Zou, S. C., Fung, K., Li, Y., Watson, J. G., and Chow, J. C.: Spatial and seasonal variations of atmospheric organic carbon and elemental carbon in Pearl River Delta Region, China, Atmos. Environ., 38, 4447–4456, 2004.
Chan, K. L., P ¨ohler, D., Kuhlmann, G., Hartl, A., Platt, U., and Wenig, M. O.: NO2measurements
in Hong Kong using LED based long path differential optical absorption spectroscopy, Atmos.
20
Meas. Tech., 5, 901–912, doi:10.5194/amt-5-901-2012, 2012.
Dix, B., Brenninkmeijer, C. A. M., Frieß, U., Wagner, T., and Platt, U.: Airborne multi-axis DOAS measurements of atmospheric trace gases on CARIBIC long-distance flights, Atmos. Meas. Tech., 2, 639–652, doi:10.5194/amt-2-639-2009, 2009.
Edner, H., Ragnarson, P., Svanberg, S., Wallinder, E., Ferrara, R., Cioni, R., Raco, B., and
25
Taddeucci, G.: Total fluxes of sulfur dioxide from the Italian volcanoes Etna, Stromboli, and Vulcano measured by differential absorption lidar and passive differential optical absorption spectroscopy, J. Geophys. Res., 99, 18827–18838, 1994.
Finlayson-Pitts, B. J. and Pitts, J. N.: Chemistry of the Upper and Lower Atmosphere: Theory, Experiments, and Applications, Academic Press, San Diego, USA, 1999.
AMTD
6, 261–301, 2013Observations of SO2
and NO2 by mobile
DOAS in Guangzhou Eastern Area
F. C. Wu et al.
Title Page
Abstract Introduction
Conclusions References
Tables Figures
◭ ◮
◭ ◮
Back Close
Full Screen / Esc
Printer-friendly Version Interactive Discussion
Discussion
P
a
per
|
Dis
cussion
P
a
per
|
Discussion
P
a
per
|
Discussio
n
P
a
per
|
Galle, B., Oppenheimer, C., Geyer, A., McGonigle, A. J. S., Edmonds, M., and Horrocks, L.: A miniaturised ultraviolet spectrometer for remote sensing of SO2fluxes: a new tool for
vol-cano surveillance, J. Volvol-canol. Geoth. Res., 119, 241–254, 2003.
Greenblatt, G. D., Orlando, J. J., Burkholder, J. B., and Ravishankara, A. R.: Absorption-measurements of oxygen between 330 nm and 1140 nm, J. Geophys. Res.-Atmos., 95,
5
18577–18582, doi:10.1029/JD095iD11p18577, 1990.
Guangzhou Environmental Protection, Guangzhou Municipality State of the Environment, avail-able at: http://www.gzepb.gov.cn/zwgk/hjgb/201106/t20110607 66789.htm (last access: Jan-uary 2013), 2010.
He, M., Zheng, J. Y., Yin, S. S., and Zhang, Y. Y.: Trends, temporal and spatial
characteris-10
tics, and uncertainties in biomass burning emissions in the Pearl River Delta, China, Atmos. Environ., 45, 4051–4059, 2011.
Heue, K.-P., Brenninkmeijer, C. A. M., Baker, A. K., Rauthe-Sch ¨och, A., Walter, D., Wagner, T., H ¨ormann, C., Sihler, H., Dix, B., Frieß, U., Platt, U., Martinsson, B. G., van Velthoven, P. F. J., Zahn, A., and Ebinghaus, R.: SO2 and BrO observation in the plume of the Eyjafjallaj ¨okull 15
volcano 2010: CARIBIC and GOME-2 retrievals, Atmos. Chem. Phys., 11, 2973–2989, doi:10.5194/acp-11-2973-2011, 2011.
H ¨onninger, G., von Friedeburg, C., and Platt, U.: Multi axis differential optical absorption spectroscopy (MAX-DOAS), Atmos. Chem. Phys., 4, 231–254, doi:10.5194/acp-4-231-2004, 2004.
20
Ibrahim, O., Shaiganfar, R., Sinreich, R., Stein, T., Platt, U., and Wagner, T.: Car MAX-DOAS measurements around entire cities: quantification of NOxemissions from the cities of
Mannheim and Ludwigshafen (Germany), Atmos. Meas. Tech., 3, 709–721, doi:10.5194/amt-3-709-2010, 2010.
Johansson, M., Galle, B., Yu, T., Tang, L., Chen, D. L., Li, H. J., Li, J. X., and Zhang, Y.:
Quan-25
tification of total emission of air pollutants from Beijing using mobile mini-DOAS, Atmos. Environ., 42, 6926–6933, 2008.
Johansson, M., Rivera, C., de Foy, B., Lei, W., Song, J., Zhang, Y., Galle, B., and Molina, L.: Mobile mini-DOAS measurement of the outflow of NO2and HCHO from Mexico City, Atmos.
Chem. Phys., 9, 5647–5653, doi:10.5194/acp-9-5647-2009, 2009.
30
AMTD
6, 261–301, 2013Observations of SO2
and NO2 by mobile
DOAS in Guangzhou Eastern Area
F. C. Wu et al.
Title Page
Abstract Introduction
Conclusions References
Tables Figures
◭ ◮
◭ ◮
Back Close
Full Screen / Esc
Printer-friendly Version Interactive Discussion
Discussion
P
a
per
|
Dis
cussion
P
a
per
|
Discussion
P
a
per
|
Discussio
n
P
a
per
|
Kraus, S.: DOASIS, A Framework Design for DOAS, PhD-thesis, University of Mannheim, Shaker Verlag, Heidelberg, Germany, 2006.
Kurucz, R. L., Furenlid, I., Brault, J., and Testerman, L.: Solar flux atlas from 296 nm to 1300 nm, National Solar Observatory Atlas No. 1, Office of University publisher, Harvard University, Cambridge, 1984.
5
Levelt, P. F., van den Oord, G. H. J., and Dobber, M. R.: The ozone monitoring instrument, IEEE Trans. Geosci. Remote, 44, 1093–1101, 2006.
Li, A., Liu, C., Xie, P. H., Liu, J. G., Qin, M., Dou, K., Fang, W., and Liu, W. Q.: Monitoring of SO2 emissions from industry by passive DOAS, Proc. SPIE, 5832, 0277-786X/05/$15,
doi:10.1117/12.619651, 2005.
10
Li, A., Xie, P. H., and Liu, W. Q.: Monitoring of total emission volume from pollution sources based on passive differential optical absorption spectroscopy, Acta Opt. Sin., 27, 1537–1542, 2007a.
Li, A., Xie P. H., Liu, C., Liu J. G., and Liu W. Q.: A scanning multi-axis differential optical absorption spectroscopy system for measurement of tropospheric NO2in Beijing, Chin. Phys. 15
Lett., 24, 2859–2862, 2007b.
Louisa, J. K., Roland, J. L., John, J. R., and Paul, S. M.: Comparison of OMI and ground-based in situ and MAX-DOAS measurements of tropospheric nitrogen dioxide in an urban area, J. Geophys. Res., 113, D16S39, doi:10.1029/2007JD009168, 2008.
Melamed, M. L., Basaldud, R., Steinbrecher, R., Emeis, S., Ru´ız-Su ´arez, L. G., and Grutter, M.:
20
Detection of pollution transport events southeast of Mexico City using ground-based visi-ble spectroscopy measurements of nitrogen dioxide, Atmos. Chem. Phys., 9, 4827–4840, doi:10.5194/acp-9-4827-2009, 2009.
Mellqvist, J., Samuelsson, J., and Rivera, C.: Measurements of industrial emissions of VOCs, NH3, SO2and NO2in Texas using the solar occultation flux method and mobile DOAS, Final 25
Report HARC Project H-53, Radio and Space Science Chalmers University of Technology, G ¨oteborg, Sweden, 2007.
Platt, U. and Stutz, J.: Differential Optical Absorption Spectroscopy: Principles and Applications, Springer, Heidelberg, Germany, 2008.
Qin, M., Xie, P. H., Liu, W. Q., Li, A., Dou, K., Fang, W., Liu, H. G., and Zhang, W. J.: Observation
30
AMTD
6, 261–301, 2013Observations of SO2
and NO2 by mobile
DOAS in Guangzhou Eastern Area
F. C. Wu et al.
Title Page
Abstract Introduction
Conclusions References
Tables Figures
◭ ◮
◭ ◮
Back Close
Full Screen / Esc
Printer-friendly Version Interactive Discussion
Discussion
P
a
per
|
Dis
cussion
P
a
per
|
Discussion
P
a
per
|
Discussio
n
P
a
per
|
Rivera, C., Sosa, G., W ¨ohrnschimmel, H., de Foy, B., Johansson, M., and Galle, B.: Tula in-dustrial complex (Mexico) emissions of SO2and NO2during the MCMA 2006 field campaign
using a mobile mini-DOAS system, Atmos. Chem. Phys., 9, 6351–6361, doi:10.5194/acp-9-6351-2009, 2009.
Rozanov, V. V., Buchwitz, M., Eichmann, K. U., de Beek, R., and Burrows, J. P.: Sciatran – a new
5
radiative transfer model for geophysical applications in the 240–2400 nm spectral region: the pseudo-spherical version, Adv. Space Res., 29, 1831–1835, 2002.
Shaiganfar, R., Beirle, S., Sharma, M., Chauhan, A., Singh, R. P., and Wagner, T.: Estima-tion of NOx emissions from Delhi using Car MAX-DOAS observations and comparison with
OMI satellite data, Atmos. Chem. Phys., 11, 10871–10887, doi:10.5194/acp-11-10871-2011,
10
2011.
Sluis, W. W., Allaart, M. A. F., Piters, A. J. M., and Gast, L. F. L.: The development of a nitrogen dioxide sonde, Atmos. Meas. Tech., 3, 1753–1762, doi:10.5194/amt-3-1753-2010, 2010. Takashima, H., Irie, H., Kanaya, Y., and Akimoto, H.: Enhanced NO2at Okinawa Island, Japan
caused by rapid air-mass transport from China as observed by MAX-DOAS, Atmos. Environ.,
15
45, 2593–2597, 2011.
US government printing office: US Standard Atmosphere, 1976, Washington, DC, Octo-ber 1976.
Van Roozendael, C. F.: WinDOAS 2.1 Software User Manual, IASB/BIRA, Brussel, Belgium, 2001.
20
Wagner, T., Ibrahim, O., Shaiganfar, R., and Platt, U.: Mobile MAX-DOAS observations of tropo-spheric trace gases, Atmos. Meas. Tech., 3, 129–140, doi:10.5194/amt-3-129-2010, 2010. Wang, W., Ren, L. H., Zhang, Y. H., Chen, J. H., Liu, H. J., Bao, L. F., Fan, S. J., and Tang, D.:
Aircraft measurements of gaseous pollutants and particulate matter over Pearl River Delta in China, Atmos. Environ., 42, 6187–6202, 2008.
25
Wenig, M. O., Cede, A. M., Bucsela, E. J., Celarier, E. A., Boersma, K. F., Veefkind, J. P., Brinksma, E. J., Gleason, J. F., and Herman, J. R.: Validation of OMI tropospheric NO2
column densities using direct-sun mode Brewer measurements at NASA Goddard Space Flight Center, J. Geophys. Res., 133, D16S45, doi:10.1029/2007JD008988, 2008.
World Health Organization: WHO Air quality guidelines for particulate matter, ozone,
nitro-30
AMTD
6, 261–301, 2013Observations of SO2
and NO2 by mobile
DOAS in Guangzhou Eastern Area
F. C. Wu et al.
Title Page
Abstract Introduction
Conclusions References
Tables Figures
◭ ◮
◭ ◮
Back Close
Full Screen / Esc
Printer-friendly Version Interactive Discussion
Discussion
P
a
per
|
Dis
cussion
P
a
per
|
Discussion
P
a
per
|
Discussio
n
P
a
per
|
Wu, F. C., Xie, P. H., Li, A., Si, F. Q., Wang, Y., and Liu, W. Q.: Correction of the impact of multi scattering on NO2 emission flux during the pollutants source measurement by
mo-bile differential optical absorption spectroscopy, Acta Opt. Sin., 31, 1101003-1–1101003-6, doi:10.3788/AOS201131.1101003, 2011.
Xu, J., Xie, P. H., Si, F. Q., Dou, K., Li, A., Liu, Y., and Liu, W. Q.: Retrieval of tropospheric
5
NO2 by multi axis differential optical absorption spectroscopy, Spectrosc. Spect. Anal., 30, 2464–2469, 2010.
Zhang, Q., David, G. S., He, K. B., Wang, Y. X., Richter, A., Burrows, J. P., Uno, I., Jang, C. J., Chen, D., Yao, Z. L., and Lei, Y.: NOx emission trends for China, 1995–
2004: the view from the ground and the view from space, J. Geophys. Res., 112, D22306,
10
doi:10.1029/2007JD008684, 2007.
Zhang, Y. H., Hu, M., Zhong, L. J., Wiedensohler, A., Liu, S. C., Andreae, M. O., Wang, W., and Fang, S. J.: Regional integrated experiments on air quality over Pearl River Delta 2004 (PRIDE-PRD2004): overview, Atmos. Environ., 42, 6157–6173, 2008a.
Zhang, Y. H., Hu, M., and Wiedensohler, A.: The special issue on PRIDE-PRD 2004 campaign,
15
Atmos. Environ., 42, 6155–6156, 2008b.
AMTD
6, 261–301, 2013Observations of SO2
and NO2 by mobile
DOAS in Guangzhou Eastern Area
F. C. Wu et al.
Title Page
Abstract Introduction
Conclusions References
Tables Figures
◭ ◮
◭ ◮
Back Close
Full Screen / Esc
Printer-friendly Version Interactive Discussion
Discussion
P
a
per
|
Dis
cussion
P
a
per
|
Discussion
P
a
per
|
Discussio
n
P
a
per
|
Table 1.Cloud fraction for the 14 days of measurement. Italic text represents the cloud fraction <0.4. Bold text represents the cloud fraction>0.4. Cloud fractions are taken from the OMI data product.
Date Cloud fraction
9 Nov 0.24
11 Nov 0.20
13 Nov 0.37
19 Nov 0.11
25 Nov 0.15
2 Dec 0.25
21 Dec 0.18
22 Dec 0.06
23 Dec 0.01
21 Nov 0.66
27 Nov 0.56
29 Nov 0.41
7 Dec 0.63
AMTD
6, 261–301, 2013Observations of SO2
and NO2 by mobile
DOAS in Guangzhou Eastern Area
F. C. Wu et al.
Title Page
Abstract Introduction
Conclusions References
Tables Figures
◭ ◮
◭ ◮
Back Close
Full Screen / Esc
Printer-friendly Version Interactive Discussion
Discussion
P
a
per
|
Dis
cussion
P
a
per
|
Discussion
P
a
per
|
Discussio
n
P
a
per
|
Table 2.SO2and NO2 emissions as measured by our mobile DOAS for the different phases
described in the text.
Emission [t h−1
]
Phase 1 Phase 2 Phase 3 Phase 4 Phase 5 Phase 1+3+5 SO2 9.39±1.06 6.38±0.72 9.93±0.15 2.45±0.15 8.97±1.58 9.50±0.90
AMTD
6, 261–301, 2013Observations of SO2
and NO2 by mobile
DOAS in Guangzhou Eastern Area
F. C. Wu et al.
Title Page
Abstract Introduction
Conclusions References
Tables Figures
◭ ◮
◭ ◮
Back Close
Full Screen / Esc
Printer-friendly Version Interactive Discussion
Discussion
P
a
per
|
Dis
cussion
P
a
per
|
Discussion
P
a
per
|
Discussio
n
P
a
per
|
Lens
Filter
Fiber
Hr2000 spectrometer Telescope
GPS antenna
GPS Circuit
Board Incoming
Sunlight
PC
Miniature Weather station Sensor
Miniature Weather
station
AMTD
6, 261–301, 2013Observations of SO2
and NO2 by mobile
DOAS in Guangzhou Eastern Area
F. C. Wu et al.
Title Page
Abstract Introduction
Conclusions References
Tables Figures
◭ ◮
◭ ◮
Back Close
Full Screen / Esc
Printer-friendly Version Interactive Discussion
Discussion
P
a
per
|
Dis
cussion
P
a
per
|
Discussion
P
a
per
|
Discussio
n
P
a
per
|
0.040 0.044 0.048 0.052
345 350 355 360 365 -0.0008
0.0000 0.0008 0.0016
VCDm= 9.23*1016 molec./cm2
NO2
a
res = 6.47*10-4
d
if
fe
re
n
tial op
tica
l
d
e
n
s
it
y
wavelength
residual
0.00 0.02 0.04 0.06
310 312 314 316 318 320 322 324 -0.0030
-0.0015 0.0000 0.0015
SO2 VCD
m= 2.54*10 17
molec./cm2 b
residual
res = 1.29*10-3
wavelength
d
if
fe
re
n
tr
ial op
tica
l
d
e
n
s
it
y
Fig. 3.Example fit for NO2 (a)and SO2 (b)recorded at 10:42 LT on 27 November 2010 and
10:35 LT on 29 November 2010 by our mobile DOAS instrument. Black lines denote the diff er-ential optical densities (DODs) of processed measurement spectra. Red lines show the result of the fit. The number given by VCDmis the differential VCD with respect to the Frauenhofer
AMTD
6, 261–301, 2013Observations of SO2
and NO2 by mobile
DOAS in Guangzhou Eastern Area
F. C. Wu et al.
Title Page Abstract Introduction Conclusions References Tables Figures ◭ ◮ ◭ ◮ Back Close
Full Screen / Esc
Printer-friendly Version Interactive Discussion Discussion P a per | Dis cussion P a per | Discussion P a per | Discussio n P a per | 1 1 N o v . 1 5 N o v . 1 9 N o v . 2 3 N o v . 2 7 N o v . 2 D e c . 4 D e c . 9 D e c . 1 7 D e c . 2 1 D e c . 2 3 D e c . 0 30 60 90 120 150 180 Peak 3 Peak 2 SO2 V C D [ *1 0 15 m ol ec ./ cm
2] SO2 VCD by mobile DOAS SO2 VCD by MAX-DOAS
offset between mobile DOAS and MAX-DOAS Peak 1 a 1 1 N o v . 1 5 N o v . 1 9 N o v . 2 3 N o v . 2 7 N o v . 2 D e c . 4 D e c . 9 D e c . 1 7 D e c . 2 1 D e c . 2 3 D e c . 0 20 40 60 80 100 120 140 160 Peak 3 Peak 2 Peak 1 NO2 VCD [ *10
15 m
o
lec
./c
m
2]
NO2 VCD by mobile DOAS NO2 VCD by MAX-DOAS
offset between mobile DOAS and MAX-DOAS b
0 100 200 300 400 500 0 30 60 90 120 150 SO 2 VC D [ *10 15 molec ./ cm 2 ] spectrum mobile DOAS data add offset c
Fig. 4.Offset between MAX-DOAS and mobile DOAS values defined as the difference between these values for the measurement period for SO2 (a) and NO2 (b). The panel(c) shows the
example for SO2 on 25 November 2010. Red line: Original value from mobile DOAS, green
AMTD
6, 261–301, 2013Observations of SO2
and NO2 by mobile
DOAS in Guangzhou Eastern Area
F. C. Wu et al.
Title Page Abstract Introduction Conclusions References Tables Figures ◭ ◮ ◭ ◮ Back Close
Full Screen / Esc
Printer-friendly Version Interactive Discussion Discussion P a per | Dis cussion P a per | Discussion P a per | Discussio n P a per | 9 N o v . 1 1 N o v . 1 3 N o v . 1 5 N o v . 1 7 N o v . 1 9 N o v . 2 1 N o v . 2 3 N o v . 2 5 N o v . 2 7 N o v . 2 9 N o v . 3 0 N o v . 2 D e c . 3 D e c . 4 D e c . 5 D e c . 7 D e c . 9 D e c . 1 3 D e c . 1 7 D e c . 1 9 D e c . 2 1 D e c . 2 2 D e c . 2 3 D e c . 2 6 D e c . 0 90 180 270 360 N W E S wi nd sp e e
d m/s
wind direction wind speed wi nd dire c ti on de g N 0 2 4 6 8
AMTD
6, 261–301, 2013Observations of SO2
and NO2 by mobile
DOAS in Guangzhou Eastern Area
F. C. Wu et al.
Title Page
Abstract Introduction
Conclusions References
Tables Figures
◭ ◮
◭ ◮
Back Close
Full Screen / Esc
Printer-friendly Version Interactive Discussion
Discussion
P
a
per
|
Dis
cussion
P
a
per
|
Discussion
P
a
per
|
Discussio
n
P
a
per
|
Fig. 6.Examples of SO2and NO2vertical columns (units: 1016molecules cm−2) along the
AMTD
6, 261–301, 2013Observations of SO2
and NO2 by mobile
DOAS in Guangzhou Eastern Area
F. C. Wu et al.
Title Page
Abstract Introduction
Conclusions References
Tables Figures
◭ ◮
◭ ◮
Back Close
Full Screen / Esc
Printer-friendly Version Interactive Discussion
Discussion
P
a
per
|
Dis
cussion
P
a
per
|
Discussion
P
a
per
|
Discussio
n
P
a
per
|
Pollutants sources 2
Pollutants sources 1 Guangzhou
Dongguan
Humen Bridge
AMTD
6, 261–301, 2013Observations of SO2
and NO2 by mobile
DOAS in Guangzhou Eastern Area
F. C. Wu et al.
Title Page
Abstract Introduction
Conclusions References
Tables Figures
◭ ◮
◭ ◮
Back Close
Full Screen / Esc
Printer-friendly Version Interactive Discussion
Discussion
P
a
per
|
Dis
cussion
P
a
per
|
Discussion
P
a
per
|
Discussio
n
P
a
per
|
9 N ov.
11 N ov.
13 N ov.
19 N ov.
21 N ov.
25 N ov.
27 N ov.
29 N ov.
2 D ec.
7 D ec.
9 D ec.
21 D ec.
22 D ec.
23 D ec.
0 20 40 60 80 100 120
mobile DOAS OMI
NO2 VCD
[*
10
15
m
olec./
cm
2 ]
Fig. 8.Time series of NO2 VCDs measured by mobile DOAS (black symbols) and OMI (red
symbols). The bars show the standard deviations of OMI and mobile DOAS for NO2