Neural Network-Based Modeling of PEM fuel cell and
Controller Synthesis of a stand-alone system for residential
application
Khaled MAMMAR1, Abdelkader CHAKER2
1
Departement of Electrical and Computer Engineering, University of Bechar Bp 417, Algeria
2
Department of Computers and Informatics, Faculty of Electrical Engineering and Informatics, Laboratory of Electrical network, E.N.S.E.T
B.P 1742 EL M’nouar, Oran, Algeria
Abstract
The paper is focused especially on presenting possibilities of applying artificial neural networks at creating the optimal model PEM fuel cell. Various ANN approaches have been tested; the back-propagation feed-forward networks show satisfactory performance with regard to cell voltage prediction. The model is then used in a power system for residential application. This models include an ANN fuel cell stack model, reformer model and DC/AC inverter model. Furthermore a neural network (NNTC) and fuzzy logic (FLC) controllers are used to control active power of PEM fuel cell system. The controllers modifies the hydrogen flow feedback from the terminal load. The validity of the controller is verified when the fuel cell system model is used in conjunction with the NNT controller to predict the response of the active power to: (a) computer-simulated step changes in the load active and reactive power demand, and (b) actual active and reactive load demand of a single family residence. Simulation results confirmed the high performance capability of the neural network (NNTC) to control power generation.
Keywords: Fuel Cell; Polymer-electrolyte fuel cell PEMFC; Electrochemical model; Modelling and Simulation; Fuzzy Logic Controller (FLC); Neural Network controller (NNTC)
1. Introduction
Proton exchange membrane (PEM) fuel cell is one of the promising technologies for alternative power source of residential power generation in future. However, a fuel cell system is large, complex and expensive Designing and building prototypes is difficult and expensive. The alternative is modelling the fuel cell system for the simulation. The modelling of fuel cell is very important for power system, because it facilitates the understanding of the involved phenomena. Many models have been proposed to simulate fuel cells in the literature [1]-[8], which have generally each the own specificities and
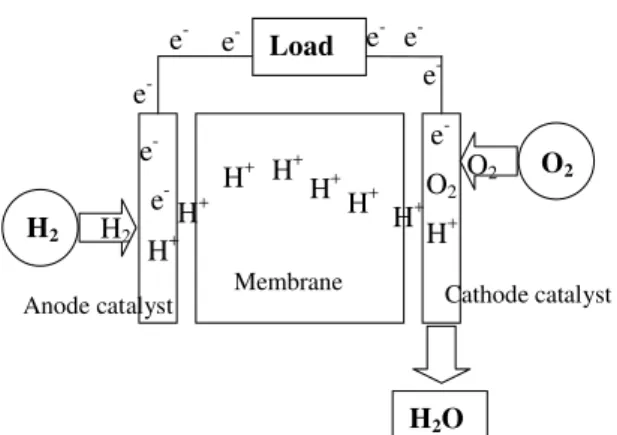
utilities, following the studied phenomena. A PEMFC converts the chemical energy of a fuel O2, in electrical energy. The outline of a typical PEMFC is illustrated in Figure 1 On one side of the cell, referred to as the anode, the fuel is supplied under certain pressure. The fuel for this model is the pure gas H2, although other compositions of gases can be used. In these cases, the hydrogen concentration should be determined in the mixture. The fuel spreads through the electrode until it reaches the catalytic layer of the anode where it reacts to form protons and electrons, as shown below in the reaction given in Eq. (1.1) [1]-[9]:
anode e H
H2→2 ++2 − (1) The protons are transferred through the electrolyte (solid membrane) to the catalytic layer of the cathode. On the other side of the cell, the oxydizer flows through the channels of the plate and it spreads through the electrode until it reaches the catalytic layer of the cathode. The oxydizer used in this model is air or O2. The oxygen is consumed with the protons and electrons and the product, liquid water, is produced with residual heat on the surface of the catalytic particles. The electrochemical reaction that happens in the cathode is
catode O
e
O2+4 −→+2 2− (2) Then, the full physical–chemical FC reaction is:
energy electrical heat
O H O
H2+ 2→+ 2 + +
2 1
O2
H2
H+
H+ H+ H+
H+ H+
H+ e-
e- e-
e- e- e-
e- e- H+ O2 O2 H2
H2O
e- Load e-
Anode catalyst Cathode catalyst Membrane
Figure 1. Basic Fell Cell Operation
2. Fuel Cell Model Formulation
In [1], [2] and [3] a performance model for a proton exchange membrane (PEM) fuel cell stack was previously developed . The model incorporated both the mechanistic and empirical properties to describe the electrochemical phenomena of combining oxygen and hydrogen over a platinum catalyst to produce an electrical current and water. The previous model predicted the cell voltage in terms of inlet partial pressures of hydrogen and oxygen, stack temperature, and operating current. The cell voltage was defined as:
act ohm act Nerst
Fc E V V V
V = − − −
(4)
In (2.1), ENenst is the thermodynamic potential of the cell
and its represents reversible voltage; Vact is the voltage drop due to the activation of the anode and of the cathode;
ohm
V is the ohmic voltage drop, a measure of the ohmic voltage drop associated with the conduction of the protons through the solid electrolyte and electrons through the internal electronic resistances; Vconc represents the voltage drop resulting from the concentration or mass transportation of the reacting gases [5]. The first term of (2) represents the FC open circuit voltage, while the three last terms represent reductions in this voltage to supply the useful voltage of the cell, for a certain operating condition. Each one of the terms in (2) can be calculated by the following equations [6]:
3 5
2 2
= 1, 229 0.85.10 ( 298,15) 1
4, 31.10 . . ( ) ( )
2
nerst
H O
E T
T ln P ln P
− − − − + +
(5)
Where
PH2and
PO2while and are the partial
pressures
of
hydrogen
and
oxygen
(atm),
respectively,
T
the cell operation temperature (K)
)] ( ) .( . . [
= 1 2 3 2 4 stack
act T T Co ln I
V −ξ +ξ +ξ +ξ
(6)
Where
Istackis the cell operating current (A), and the
ξ i
's represent parametric coefficients for each cell
model, whose values are defined based on theoretical
equations
with
kinetic,
thermodynamic,
and
electrochemical foundations [6].
CO2is the
concentration of oxygen in the catalytic interface of
the cathode mol/cm, determined by
) 498/ ( 6 2 2 . 5,08.10 = T e Po
Co −
(7)
) .(
= stack m c
ohmic I R R
V +
(8)
Where Rcrepresents the resistance to the transfer of protons through the membrane, usually considered
constant and:
A l
Rm = ρM. with:
− − − + + T T exp A I A I A I T A I stack stack stack stack M 303 4,18. 3. 0,634 . . 303 0,062. 0.03. 1 181,6. = 2,5 2 ψ
ρ : is
the specific resistivity of the membrane for the electron flowΩ/cm , A is the cell active area cm and l is the thickness of the membrane (cm), which serves as the ectrolyte of the cell. Where181,6/(ψ−0,634) the term is the specific resistivity Ω/cm at no current and at 30oC
[6]; − − max con J J ln B
V = . 1
(9)
Where B (V) is a parametric coefficient, which depends on the cell and its operation state, and J represents the actual current density of the cell (A/cm) .
2.1 Artificial Neural Network (ANN) Model
training [14] was utilized in this study. The structure of the feedforward is three-layer. The network consists of an input layer, a hidden layer and an output layer. The transfer function for the hidden layer is a sigmoid function, whose form is defined by [17]:
) . ( 1
1 = ) (
u d
e u
f −
+
(10)
where d is the slope parameter. The input of the hidden layer can be described by the following equation:
) (
= 1 =
i i ij n
j
b x w
u
∑
+(11)
where wij is the weight from the jth input xj to the ith
neuron in the hidden layer, and bi is the bias. If the function in the output layer is linear, the model equation for the entire network can be expressed as follows[17]:
)) (
( =
= ) (
=
1 = 1 = 1
=
i i ij N
j o ij N
j i
i o ij N
j
ku wu b u w f w x b
y
∑
+∑
∑
+(12)
where ykis the output signal from the kthoutput neuron, and wkio is the weight from the ith output uito the kth
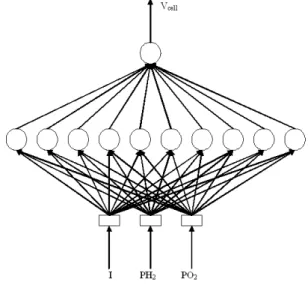
neuron in the output layer. In this study, the weights and bias values of ANN are updated according to the gradient descent momentum algorithm, which is considered to be one of the best training algorithms for the ANN [16]. Fig 2 shows the architecture of the developed neural network model. The ANN network has an input layer with 3 inputs (partial pressures of hydrogen PH2, partial of oxygen PO2 and cell operating current Istack ) , 1 hidden layer with 10 neurons and an output layer with 1 outputs (PEMFC cell voltage). MATLAB§ (The MathWorks Inc.) Neural Networks Toolbox was used to build ANN models. The hyperbolic tangent sigmoid transfer function (``tansig'') was used in the hidden layer and linear transfer function (``purelin'') was applied in the output layer. The two-layer sigmoid/linear network usually can represent any functional relationship between inputs and outputs if the sigmoid layer has enough neurons [16].
The nonlinear transfer function in the hidden layer allows the network to learn nonlinear and linear relationships between input and output vectors and the linear output layer lets the network produce values outside the range -1 to + 1. The weights and biases were initialized using ``init'' function which calculates the weight and bias values using the Nguyen--Widrow initialization method. The data from the semi-empirical model was used for training the
network. Lavenberg--Marquart backpropagation training algorithms (``trainlm'') was used as a training function to update weight and bias values, as it is the fastest training algorithm for networks of moderate size although it can require additional memory. Memory problems did not occur during the simulations for all developed ANN models. Neural network simulation blocks for use in Simulink can be automatically generated with the (gensim ) command [18].
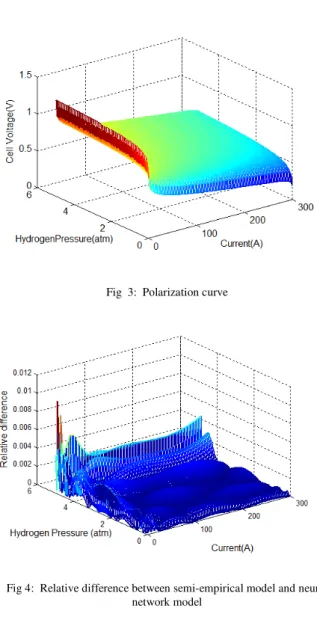
Fig 3 show A typical PEMFC (NNT model) cell voltage response surface. With simultaneous changes in the inlet partial pressure of hydrogen and current at a constant stack temperature of 70 o
Fig 4 show the relative difference between semi-empirical model and neural network model. The simulation results show good agreement with the empirical and experimental ones. The absolute error was less than 0.4%. This result prove the ability of NNT model to replace the analytical model for simulink
Fig 2: PEMFC NNT model
Fig 3: Polarization curve
Fig 4: Relative difference between semi-empirical model and neural network model
3. Fuel Cell System Model
3.1 Fuel Cell Dynamic Model
Choose the partial pressure of hydrogen and oxygen on the cathode side as three states; hydrogen inlet flow rate, oxygen inlet flow rate and output current density as three inputs as well. Using the ideal gas law, the state equations become[9]: ) ( = ) ( 2 2 2 2 r H out H in H an
H q q q
V RT P dt d −
−
(13)
) ( = ) ( 2 2 2 2 r O out O in O an
O q q q
V RT P dt d −
−
(14)
) ( = ) ( 2 2 2 r O H out O H an O
H q q
V RT P
dt
d − −
(15)
Where: PH2,PO2 and PH2O : the partial pressures of each gas inside cell;qinH2,
in O
q 2: the inlet flow rates of hydrogen and oxygen of the cathode and anode; qoutH2, qOout2 and
out O H
q 2 : the outlet flow rates of each gas and water vapor;
r H
q 2,qOr2 andqHr2O: usage and production of the gases and water.
Based on the electrochemical relationships, we have[6]:
stack r stack r O H r O r
H K I
F I N q
q
q =2. .
2. . = = 2
= 2 2 0
2
(16)
O H O H out O H O O out O H H out
H K P q K P q K P
q 2= 2 2; 2 = 2 2; 2 = 2 2
(17)
Where: 2
H
K : hydrogen valve molar constant [kmol/(atm s)]; 2
O
K : oxygen valve molar constant (kmol/(atm s)); :
0
N number of series fuel cells in the stack; Istack: stack
current (A); Kr : constant =
F N
4
0 Kmol/ (s.A) and F : Farady constant 9684600 C/Kmol.
By substituting equations (16) and (17) into equation (15), applying the Laplace transform, and isolating the partial pressure term, the following equation can be written as:
) 2 ( 1 1/ = 2 2 2
2 H r stack
H H
H q K I
s K
P −
+τ
(18)
whereτH2 : the system pole associated with the hydrogen flow. and for partial pressure of oxygen:) ( 1 1/ = 2 2 2
2 O r stack
O O
O q K I
s K
P −
+τ
(19)
This model is based on simulating the relationship
between output voltage and partial pressure of
hydrogen and oxygen.
3.2 Reformer Model
In [9]and[10] the authors introduced a simple model of a reformer that generates hydrogen through reforming methane. The model is a second-order transfer function. The mathematical form of the model can be written as follows: 1 ). ( . = 2 1 2 2 1 2 + + + s s CV q q methane H τ τ τ
τ
(20)
Were:
3.3 DC/AC inverter Model
In this paper, only a simple model of a DC/AC inverter is considered for the following reasons: the dynamic time constant of inverters is of the order of microseconds or at the most milliseconds. The time constants for the reformer and stack are of the order of seconds model of the inverter is given in [11], where output voltage and output power are controlled using the inverter modulation index and the phase angle of the AC voltage.
Considering the fuel cell as a source, the output voltage and the output power as a function of the modulation index and the phase angle can be written
as:
δ ∠
cell
ac mV
V = .
(21)
) ( .
= sinδ
X V m
Pac cell
(22)
) ( .
= sinδ
X V m Pac cell
(23)
X cos V V m V mQac= . cell . cell. s ( )
2 − δ
(24)
) ( . = θ cos V P I s LL
(25)
) ( .
=mI cosθ+δ
Istack L
(26)
Where the model parameter are as follows:
ac
V :AC output voltage of the inverter ; m : inverter modulation index; δ :phase angle of the AC voltage [rad] ; P ac : AC output power from the inverter;
ac
Q :reactive output power from the inverter;Vs :load terminal voltage; X : reactance of the line connecting the fuel cell to the load IL:load current ; θ :load
phase
angle [
rad]; PL :load power; Istack:stack current.PI controllers are used to control the modulation index. The transfer function of the modulation index can be expressed as:
) (
= 5 6
ac r V V s s k k
m + − (27) Were :
5
k ,and k6: are the PI gain, and Vr is the reference voltage signal.
In traditional synchronous generators, the amount of steam input to the turbine controls the power angle, which controls the active output power from the generator. In synchronous machines, the power angle is not measured but the adjustment of the power angle occurs following changes in steam input and rotor speed. In the fuel cell system, there is no speed control but a similar relationship between the output voltage phase angle and the flow of
hydrogen can be adopted as follows. Given that the load voltage is constant and the AC source voltage out of the inverter is as given in [11] , the angle controls the power flow from the fuel cell to the load, as in [10]. The phase angle can be controlled using the input flow of hydrogen. The expression for, therefore, provides the relationship between the power output as a regulated quantity, and the amount of flow of fuel input. This relationship is described by the following equations:
stack cell dc
ac P V I
P = = . (28) Assuming a lossless inverter, we get According to electrochemical relationships, a relationship between the stack current and the molar flow of hydrogen can be written as
U F
I N
qH stack
. 2
.
= 0
2 (29) Were U is a utilization factor
From equation (21), (22) and (29)
2 0 . . . 2 = ) ( H s q N V m X U F
sinδ (30) Assuming a small phase angle
2 0 . . . 2. = H s s q N V m X U F
δ (31) The equation (31) describes the relationship between output voltage phase angle and hydrogen flow. Equations (21) and (31) indicate that the active power as a function of the voltage phase angle can be controlled by controlling the amount of hydrogen flow.
3.4
Fuzzy Logic Controller
The active power flow from the PEMFC to the load is controlled thought controlling the flow hydrogen. The proposed fuzzy logic controller controls the active power by controlling the hydrogen flow.
The fuzzy controller consists of five different steps [12] , [11]
Step 1) definition of input-output variables of controller Step 2) design of fuzzy control rule
Step 3) fuzzification Step4) inference Step 5) defuzzification
b H ref meth
H q q
q k
e( )= 2+ − 2 (32)
Were qH2is the flow hydrogen from the current feedback signal were is proportional to the terminal load, qmethane is the methane reference signal and qH2bis the hydrogen flow feedback signal.
1) ( ) ( = )
(k e k −ek−
ce (33) )
( . 1) ( u = ) (
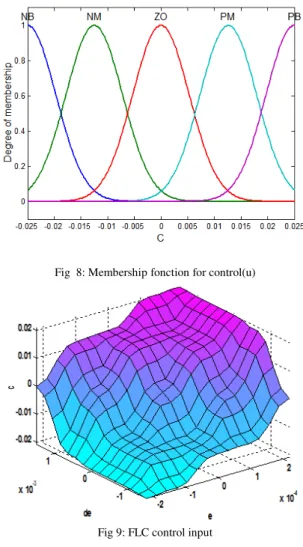
uH2 k H2 k− +ρ∆uH2 k (34) Were ∆uH2(k)is the inferred change of duty ratio by fuzzy controller and ρ is the gain factor of the controller[13],[11]. Fig 6, 7 and 8 shows the basic fuzzy partition of membership function for error, change of error, and change of control action. And fuzzy variables are expressed by linguistic variables such as''positive big(PB)'',positive medium(PM)'',''zero(ZO)'',''negative medium(NM)'' ,''negative big(NB)''. Table 1 shows the fuzzy model based on fuzzy rules[9].
Exemple fuzzy rules are:
Ruel 1 `` If e(k) is PM and ce(k) ZO then u(k)is PM Ruel 2 `` If e(k) is NB and ce(k) NM then u(k)is NB The inference methode used is basic and simple, it is developed from the minimum operation function rule as a fuzzy implementing function. The membership function of
e, ce and uH2are given by µEi , µCEi, i
H
U 2
µ µCi . The
commonly use Min-Max method is given as: )]
( ), ( [ min = ) ,
(e ce e ce
i ce i e i
R µ µ
µ i=1.. n (34)
)] ( ), , ( [ = )
( H2 Ri uH2i H2
i
C u maxµ e ce µ u
µ (35)
(35)
Table 1. Linguistic Rule.
CHANGE OF ERROR(ce)
E R R O R
U NB NM ZO PM PB
NB NB NB NM NM ZO
NM NB NM NM ZO PM
ZO NM NM ZO PM PM
PM NM ZO PM PM PB
PB ZO PM PM PB PB
The centroid defuzzification method determines the output value from center of gravity of the output membership function and is given by the expression[12].
) (
) ( =
2 n
0 = i
2 2 n
0 = i 2 H
i H i C
i H i H i C
u u u
u
µ µ
∑
∑
∆ (36)
Based on table 1 and fig9, the 3-dimensinal representation of control input (uH2) for fuzzy variables (e,ce) is shown in figure 7
Fig 6: Membership fonction for error(e)
Fig 8: Membership fonction for control(u)
Fig 9: FLC control input
3.4 Neural Network Controler
The structure of the Neural Network Controller (NNTC) is similar to one of the Neural Network Identifier. The objective of NNTC is to develop a back-propagation algorithm such that the output of the plant can track the output of fuzzy logic controller FLC (fig 10) .
Fig 10: Block diagram of the proposed controller.
The 3-dimensional representation of control input for NNTC uH2 (e, ce) is shown in Fig11
Fig11: NNT control input
4. Simulation Results
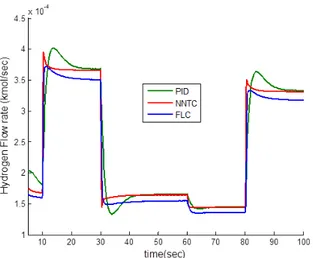
The model parameter are given in Table 2. The model of Fuel cell system for residential power generations shown in Fig 12 is tested with step change in the load as shown in Fig13. These abrupt changes in the active and reactive power are for testing the dynamic response of the system and do not necessarily represent change in residential load. In a practical system, the response time of the reformer can be longer than tens second [8], [9]. Therefore the reformer controller parameters have significant effect on the active power control. In this simulation the Neural Network controller (NNTC) was able to modify hydrogen flow for controlling active power to the load change fig13. The Neural Network controller (NNTC) is characterized by faster time response compared to the fuzzy logic controller and PID controllers used in fig14
Fig15 and Fig 16 shows the change of hydrogen flow and phase angle. we note that this change is similar to the change of active power because the active power flow from the PEMFC to the load is controlled thought controlling the flow hydrogen.
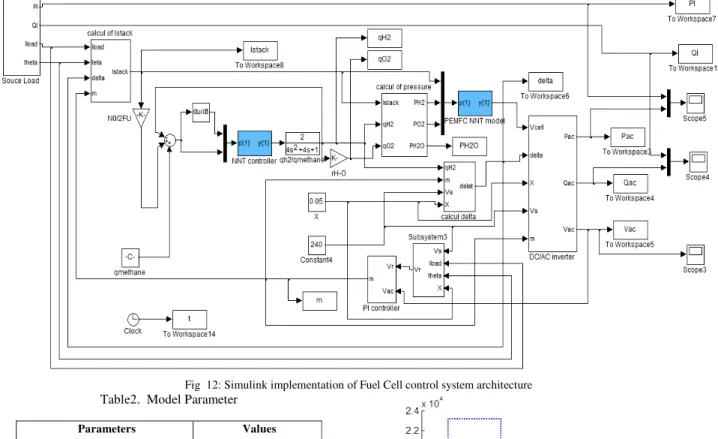
Fig 12: Simulink implementation of Fuel Cell control system architecture Table2. Model Parameter
Parameters Values
Facteur de conversion CV 2 farady,s Constant, F 9684600 C/Kmol Universal gas Constant R 8314.47 j/Kmol.K
Number of cells N0 333
Hydrogen valve constant KH2 4.22*10-5 Kmol/(s.A)
Oxygen valve constant KO2 2.11*10-5 Kmol/ (s.atm)
Hydrogen time constant, τH2 3.37 (s)
Oxygen time constant, τO2 6.74 (s)
Utilization factor, U 0.8 PI gain constants K5,K6 10
Hydrogen –Oxygen flow ratio rH-O 1.168
Methane reference signal, qref 0.000015 Kmol/ s
Reformer time constants τ1 , τ2 2, 2
Line reactance, X 0.05Ω
Voltage reference signal Vr 240 V
Kr constant = 0
4 N
F 0.996*10
-6
Kmol/ (s.A)
Fig 14: Active output power change ( with,PID, FLC,and NNTC)
Fig 15: Hydrogen flow rate change( with,PID, FLC,and NNTC)
Fig 16: Output voltage phase angle change change( with,PID, FLC,and NNTC)
Fig17: Reactive output power change
Fig 18: Modulation index change
Conclusions
neural netowrk controller (NNTC) and fuzzy logic controller (FLC) are very effective to control hydrogen flow for active power load variation.
References
[1] J. C. Amphlett, R. F. Mann, B. A. Peppley, P. R. Roberge, and A. Rodrigues:” A model predicting transient responses of proton exchange membrane fuel cells”. J. Power Sources, vol. 61, pp. 183--188, 1996.
[2] J. J. Baschuck and X. Li” Modelling of polymer electrolyte membrane fuel cells with variable degrees of water flooding”. J. Power Sources, vol. 86, pp. 181--196, 2000. [3] G. Naga Srinivasulu, T. Subrahmanyam, V.Dharma Rao:
“Parametric sensitivity analysis of PEM fuel cell electrochemical Model”. International Journal of Hydrogen Energy’ Science Direct’ (2011), article in press I-7
[4] G. Naga Srinivasulu, T. Subrahmanyam, V.Dharma Rao “Parametric sensitivity analysis of PEM fuel cell electrochemical Model”. International Journal of Hydrogen Energy’ Science Direct’ (2011), article in press I-7
[5] Jeferson M. Corra, Student Member, IEEE, Felix A. Farret, Luciane N. Canha, and Marcelo G. Simes “An Electrochemical-Based Fuel-Cell Model Suitable for Electrical Engineering Automation Approach”. IEEE Transactios on Industrial Electronics, vol .51, No 5, Octobr 2004
[6] Jeferson M. Corra, Student Member, IEEE, Felix A. Farret, Jonas R. Gomes, and, Marcelo Godoy Simes, Senior Member, IEEE”Simulation of Fuel-Cell Stacks Using a Computer- Controlled Power Rectifier With the Purposes of Actual High- Power Injection Applications”. IEEE Transactios on Industrial ,Applications, vol 39, N04, July/August 2003 .
[7] Jia Y . Wang S.D. Lian. “Matlab / Simulink Based-study on PEM Fuel Cell and Battery Hybrid System”. 10th Intl. Conf. on Control, Automation, Robotics and Vision Hanoi, Vietnam, 17–20 December 2008.
[8] M. Y. El-Sharkh, Member, IEEE, A. Rahman, Life Senior Member, IEEE, M. S. Alam, Senior Member, IEEE, A. A. Sakla, Senior Member, IEEE, P. C. Byrne, Member, IEEE, and T. Thomas, Member, IEEE” Analysis of Active and Reactive Power Control of a Stand-Alone PEM Fuel Cell Power Plant”. IEEE Transactios on Power Ssystems , vol .19, N04, November 2004
[9] M. Y. El-Sharkh and M..placeS Alam”A dynamic model for a stand-alone PEM fuel cell power plant for residential application”. J. Power Sources, June 2004.
[10] M. Y. El-Sharkh, Member, IEEE, A. Rahman, Life Senior Member, IEEE, M. S. Alam, Senior Member, IEEE, A. A. Sakla, Senior Member, IEEE, P. C. Byrne, Member, IEEE, and T. Thomas, Member, IEEE “Analysis of Active and Reactive Power Control of a Stand-Alone PEM Fuel Cell Power Plant”. IEEE Transactios on Power Ssystems , vol .19, N04, November 2004
[11] B Sharmila and N Devarajan, “Performance of Networked DC Motor with Fuzzy Logic Controller”, IJCSI International Journal of Computer Science Issues, Vol. 7, Issue 4, No 9, July 2010.
[12] Khaled Mammar, Abdelkader Chaker “Fuzzy Logic Control of Fuel Cell System for Residential Power Generation'', Journal of ELECTRICAL ENGINEERING, Vol. 60, 328--334, No. 6, 2009
[13] Abhishek Sakhare, Asad Davari and Ali Feliachi”Fuzzy logic control of fuel cell for stand-alone and grid connection”. Journal of Power Sources, Volume 135, Issues 1-2, 3 September 2004, Pages 165-176
[14] Kisacikoglu, M.C.; Uzunoglu, M.; Alam, M.S”Fuzzy Logic Control of a Fuel Cell/Battery/Ultra-capacitor Hybrid Vehicular Power System”. Vehicle Power and Propulsion. Conference, 2007. VPPC 2007. IEEE Volume , Issue , 9-12 Sept. 2007 Page(s):591 – 596
[15] Ramesh Babu H.S.1, Gowrishankar2, Satyanarayana P.S3. “A QoS Provisioning Recurrent Neural Network based Call Admission Control for beyond 3G Networks” IJCSI International Journal of Computer Science Issues, Vol. 7, Issue 2, No 5, March 2010
[16] Laurene V. Fausett , “Fundamentals of Neural Networks: Architectures, Algorithms, and Applications”. Book Editeur : Prentice-Hall; dition : country-regionplaceUS ed (1 janvier 1994)
[17] Howard Demuth, Mark Beale, Martin Hagan “Neural Network Toolbox For Use with MATLAB § Neural Network Toolbox. User's Guide” copyright 1992-2006 by The MathWorks, Inc.
Bibliography of Authors
Khaled Mammar: is an assistant Professor of Electrical and
Computer Engineering at the University of Bechar, Algeria He received his B.S degree in Electrical Engineering from the University of Sciences and Technology of Oran, Algeria, in1997, the M.S degree from the same University of Sciences and Technology of Oran, in 2002. And the PhD degree in 2011 from, E.N.S.E.T Oran Algeria. His research activities include Fuel cell systems, Power Control, Power Electronics, and Intelligence Artificial
Abdelkader Chaker: is a Professor in the Department of