Advances in Radio Science (2003) 1: 53–56 c
Copernicus GmbH 2003
Advances in
Radio Science
Achievable field strength in reverberation chambers
N. Eulig1, A. Enders1, H. G. Krauth¨auser2, and J. Nitsch2
1Technische Universitt Braunschweig, Institut fr EMV, Schleinitzstr. 23, D-38106 Braunschweig, Germany
2Universitt Magdeburg, Institut f¨ur Grundlagen der Elektrotechnik und Elektromagnetische Vertr¨aglichkeit, P.O. Box 4120,
D-39016 Magdeburg, Germany
Abstract. Feldvariable Kammern (FVK, engl.:
mode-stirred-chamber) werden unter anderem f¨ur EMV-St¨orfes-tigkeitspr¨ufungen verwendet. Ein h¨aufig genanntes Argu-ment, das die Einf¨uhrung dieser Kammern als normgerechte Pr¨ufumgebung vorantreiben soll, ist eine hohe Feldst¨arke, die im Vergleich zu anderen Testumgebungen mit relativ moderaten HF-Leistungen erreicht werden kann. Beson-ders f¨ur sicherheitskritische Ger¨ate, wie Komponenten aus der Avionik- oder KFZ-Industrie, sind heutzutage Test-feldst¨arken von mehreren 100 V/m notwendig. Derart hohe Feldst¨arken k¨onnen in Umgebungen, die ein ebenes Wellenfeld erzeugen oder nachbilden, nur mit großen HF-Leistungen generiert werden. Durch die Resonanzeigen-schaften einer FVK k¨onnen demgegen¨uber mit sehr viel weniger Leistung und damit Verst¨arkeraufwand vergleich-bare Werte der Feldst¨arke erzeugt werden. Allerdings sinkt mit zunehmendem Volumen die erreichbare Feldst¨arke bei gleicher Speiseleistung. Idealerweise sollen Feldvariable Kammern bei m¨oglichst niedrigen Frequenzen f¨ur EMV-Tests nutzbar sein, was jedoch ein großes Kammervolu-men erfordert. Das Problem, bei niedrigen Frequenzen hohe Feldst¨arken erzeugen zu k¨onnen, relativiert deshalb den Vorteil von FVKn gegen¨uber bekannten Testumgebungen bei niedrigen Testfrequenzen.
Der Posterbeitrag erl¨autert, welche Feldst¨arken in ver-schieden großen Feldvariablen Kammern beim Einspeisen einer bestimmten hochfrequenten Leistung erreicht werden k¨onnen. Anhand dieser Ergebnisse wird aufgezeigt, ober-halb welcher Grenzfrequenz eine Anwendung von FVKn nur sinnvoll erscheint.
Mode-stirred chambers (MSCs) can be used for radiated immunity tests in EMC testing. Advantageous compared to conventional test methods is the high field strength which can here be generated with less RF-Power. This point is often the main argument for pushing the standardization of Correspondence to:N. Eulig
MSCs as an other EMC testing environment. Especially for safety-critical electronic equipment like avionic or automo-tive systems, immunity tests with field strengths of several 100 V/m are necessary. Such high field strengths can only be generated with substantial RF power and therefore expen-sive amplifiers if the test is performed in an environment with plane waves. Due to resonance effects in mode-stirred cham-bers, comparable values of the field strength can there be ob-tained with significantly less power. In these chambers the field strength declines with increasing volume for a constant input power. As an ideal testing environment a mode-stirred chamber should also work at low frequencies which requires a large volume, however. Hence there is a contradiction be-tween generating high level field strengths on the one hand and obtaining a lowest usable frequency of several 10 MHz on the other. This relativizes the advantage of generating high field strengths with less power if the chamber is sup-posed to work down to low frequencies.
This article deals with the field strengths that can be ob-tained in mode-stirred chambers with a certain size. Data of different mode-stirred chambers are compared. From this a frequency limit can be derived, above which the use a mode-stirred chamber for achieving high field strengths seems meaningful only.
1 Mode of operation
Reverberation chambers are often regarded as cost-effective facilities for EMC testing. A strong point seems to be the high field strength which can be generated by significantly less power compared to anechoic rooms. In this poster the limit of this effect due to intrinsic loss mechanisms of rever-beration chambers will be shown.
54 N. Eulig et al.: Achievable field strength in reverberation chambers
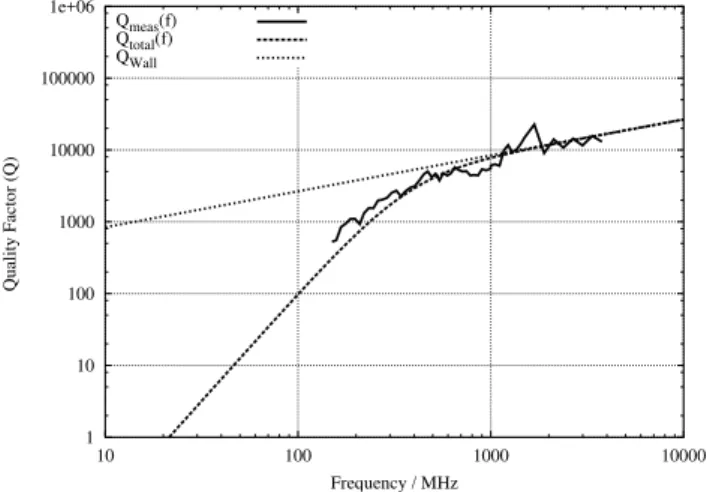
Fig. 1.View inside a mode-stirred chamber. The rotatable tuner to the top has a diameter of approx. 5 m.
the frequency remains constant. As a consequence, the max-ima of the cavities resonant modes change their spatial po-sition. In this way the equipment under test (EUT) is ex-posed to a field which has the same maximum value within approximately 2–4 dB at every point of the EUT within one complete revolution of the tuner. Because of the low num-ber of eigenmodes in the cavity directly above the first res-onance frequency the effect of moving the maxima by the tuner works well only if a certain frequency is exceeded. This frequency is called LUF (lowest usable frequency). It is de-pendent on the shape and size of the cavity and wellness of the tuner. Therefore, it is an individual characteristic of ev-ery reverberation chamber and can be estimated only prior to the construction of any chamber. A more accurate value can be determined on the basis of different measurements in the chamber as an empirical value.
2 Loss mechanisms, cavity quality factorQand
cham-ber gainG
The loss mechanism of an ideal empty chamber is mainly determined by the wall material. Especially if the frequency is high compared to the LUF the loss induced by a matched transmitting or receiving antenna can be neglected and the power transmitted into the chamber will be converted into
1 10 100 1000 10000 100000 1e+06
10 100 1000 10000
Quality Factor (Q)
Frequency / MHz Qmeas(f)
Qtotal(f) QWall
Fig. 2. Typical distribution ofQin a reverberation chamber with a dimension of 8 m×6 m×3.5 m. The wall material is assumed to have a conductivity ofσw =106S/m. Considered are losses in
the walls and in one matched antenna as well as a factor of 0.1 for fitting the curves to the measured data.
heat in the walls. The diagram in Fig. 2 shows the behaviour ofQversus f under consideration of the antenna loss for one antenna and the contribution of the walls Qw. This
clari-fies that at high frequencies the quality factorQof an ideal chamber is mainly determined by the material properties of the walls. It can be shown thatQis a function of the cham-bers volumeV, the surfaceSand the square root of the used frequency f. For the diagram in Fig. 2 a conductivity of
σw = 106S/m and a chamber size of 8 m x 6 m x 3.5 m is
assumed. For fitting the curve of the total quality factor to the measured values, a factor of 0.1 was multiplied toQt ot al.
If a reverberation chamber is used as a testing environment there will be additional losses caused by the absorption of the EUT placed into the chamber. This effect will decreaseQ
and consequently the electrical field strength if the transmit-ted power remains constant. Therefore this effect has to be compensated for by increasing the transmitted power into the chamber. However, in this consideration an empty chamber is regarded.
3 Distribution of the electrical field strength
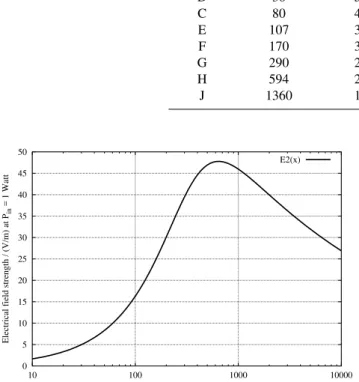
In general the field strength depends on frequency. This is due to the variation of the absorption with frequency or chamber quality Q, respectively. Remember that with in-creasing frequency the power dissipated in the walls raises, too. In the lower frequency range the dominant absorption mechanism is caused by the antenna. The diagram in Fig. 3 shows the distribution ofEof an ideal chamber with the pa-rameters given above. With increasing frequency the electri-cal field rises at first and then declines steadily due to higher absorption of the walls at higher frequencies.
N. Eulig et al.: Achievable field strength in reverberation chambers 55
Table 1.Different chambers and their surface area compared with the associated lowest usable frequency
Chamber Volume / m3 f110/ MHz LUF / MHz (empirical value)
A 17 71 300
B 29 69 300
D 38 58 300
C 80 43 150
E 107 38 150
F 170 31 150
G 290 24 100
H 594 24 80
J 1360 15 30...50
0 5 10 15 20 25 30 35 40 45 50
10 100 1000 10000
Electrical field strength / (V/m) at P
in
= 1 Watt
Frequency / MHz
E2(x)
Fig. 3. Typical distribution of the electrical field strength in a re-verberation chamber. The data shown are based on theQ-values shown in Fig. 2.
mind that in this investigation the estimated field strength for a specific surface area is given only at a frequency of 1 GHz. At higher frequencies lower values ofEare expected.
4 Electrical field strength as a function of surface area
The ratio between the electrical field strength squaredE2and transmitted powerPnet is proportional to the chamber gain
G. This gain is physically determined by the wall material and the surface areaS as well as the used frequency. From that we can get a relationship betweenEandS. Provided that the conductivity of the wall material is constant this results in the expression:
E∝ √1 S
For comparing different chambers it is important that the wall materials have the same conductivity and therefore the skin depth is nearly the same. Otherwise the compared field strengths may show greater variations than expected.
The data presented here is based on a frequency of 1 GHz since that at this frequency data were available for most of
0 20 40 60 80 100
0 200 400 600 800 1000
E / (V/m) at P
in
= 1 Watt
surface area / m2 A
B C D
E F
G
H
J ~ sqrt(1/x)
Fig. 4.Dependency of the electrical field strength vs. surface area in a reverberation chamber at a frequency of 1 GHz.
the chambers. Figure 4 shows that the electrical field declines with increasing surface area of a chamber if the input power remains constant. The curve is a fit based on the measured data and has a distribution proportional to√1/S.
5 Error sources
The investigated chambers may have different wall conduc-tivities. Therefore the generated field strength will differ even if the chamber size is nearly the same.
Sometimes it was not explicitly mentioned ifPnet orPin
was used to normalize the electrical field strength. For
Pnet 6= Pin this could result in slightly different field
56 N. Eulig et al.: Achievable field strength in reverberation chambers
6 Discussion
A large reverberation chamber is needed to achieve a low LUF. Opposed is the effect that with increasing surface area the obtained field strength for a constant input power at a fixed frequency declines due to higher overall losses in the walls. This leads to a contradiction of generating high field strengths with less power and simultaneously desiring a low LUF.
For the construction of a reverberation chamber it is nec-essary to make a trade off between a low start frequency and generating high field strengths. Therefore it may be more
cost-effective to use an anechoic chamber for the low fre-quency range especially if the needed measurement time is taken into consideration. The time required for measure-ments in reverberation chambers near by the LUF takes much more time compared to measurements conducted in anechoic rooms, as described in the reference.
References