www.atmos-chem-phys.net/6/1003/2006/ © Author(s) 2006. This work is licensed under a Creative Commons License.
Chemistry
and Physics
Functional group analysis by H NMR/chemical derivatization for
the characterization of organic aerosol from the SMOCC field
campaign
E. Tagliavini1,2, F. Moretti1, S. Decesari3, M. C. Facchini3, S. Fuzzi3, and W. Maenhaut4 1Dipartimento di Chimica “G. Ciamician”, Universit`a di Bologna, Bologna, Italy
2Centro di Ricerche per le Scienze Ambientali, Universit`a di Bologna, Ravenna, Italy 3Istituto di Scienze dell’Atmosfera e del Clima – C. N. R., Bologna, Italy
4Department of Analytical Chemistry, Institute for Nuclear Sciences, Ghent University, Gent, Belgium Received: 22 June 2005 – Published in Atmos. Chem. Phys. Discuss.: 29 September 2005
Revised: 24 January 2006 – Accepted: 7 February 2006 – Published: 29 March 2006
Abstract. Water soluble organic compounds (WSOC) in aerosol samples collected in the Amazon Basin in a pe-riod encompassing the middle/late dry season and the begin-ning of the wet season, were investigated by H NMR spec-troscopy. HiVol filter samples (PM2.5 and PM>2.5) and size-segregated samples from multistage impactor were sub-jected to H NMR characterization. The H NMR methodol-ogy, recently developed for the analysis of organic aerosol samples, has been improved by exploiting chemical methy-lation of carboxylic groups with diazomethane, which al-lows the direct determination of the carboxylic acid content of WSOC. The content of carboxylic carbons for the dif-ferent periods and sizes ranged from 12% to 20% of total measured carbon depending on the season and aerosol size, with higher contents for the fine particles in the transition and wet periods with respect to the dry period. A compre-hensive picture is presented of WSOC functional groups in aerosol samples representative of the biomass burning pe-riod, as well as of transition and semi-clean atmospheric con-ditions. A difference in composition between fine (PM2.5) and coarse (PM>2.5) size fractions emerged from the NMR data, the former showing higher alkylic content, the latter being largely dominated by R-O-H (or R-O-R’) functional groups. Very small particles (<0.14µm), however, present higher alkyl-chain content and less oxygenated carbons than larger fine particles (0.42–1.2µm). More limited variations were found between the average compositions in the differ-ent periods of the campaign.
Correspondence to:E. Tagliavini ([email protected])
1 Introduction
The LBA-SMOCC (Large-Scale Biosphere/Atmosphere Ex-periment in Amazonia – Smoke Aerosols, Clouds, Rainfall and Climate) experiment (Andreae et al., 2004) was set up to estimate the effects of smoke particles produced by biomass burning activity in the Amazon Basin on the development of precipitating clouds, and to evaluate the resulting pertur-bations on the climate system. The project is part of the Large-Scale Atmosphere-Biosphere Experiment in Amazo-nia (LBA). The SMOCC field campaign was held at a pas-ture site in a rural area in Rondˆonia, Brazil in the period September–November 2002, during the transition from the dry to the wet season. During the experiment, extensive measurements were made of the physical, hygroscopic and chemical aerosol properties, and samples were collected by means of filter units and impactor-based techniques for sub-sequent laboratory analyses (Fuzzi et al., 2006). As part of this experiment attention was focused on the characterization of water-soluble organic compounds (WSOC) extracted from filters and impactor samples and analyzed by proton nuclear magnetic resonance (H NMR) spectroscopy.
linked to the very high complexity of the organic aerosol fraction, both in terms of structural diversity and the huge number of different compounds present.
The present authors have recently introduced a conceptu-ally new approach to the problem of characterizing atmo-spheric aerosol: the investigation of the structural features, i.e., the presence and amount of organic functional groups. Functional group analysis provides information on the av-erage composition of aerosol organic carbon (OC), such as the mean state of oxidation (Matta et al., 2003; Decesari et al., 2005), the surface-active character (Decesari et al., 2005) and the general structures which can be linked to primary and secondary sources of aerosol (Maria et al., 2003). In the case of biomass burning aerosol, the functional group composi-tion was shown to change markedly during the various stages of combustion, with an enrichment of aromatic and alkylic moieties in the char residue, while most of the complex oxygen-rich molecules like cellulose decompose to volatile organic compounds (Knicker et al., 1996). At the same time, biomass burning particles contain many oxygenated func-tional groups, like hydroxyls, carbonyls and carboxyls (Gra-ham et al., 2002), indicating that volatile organic compounds produced during the combustion recondense onto particles during the cooling of the plume (Gao et al., 2003; Reid et al., 2004). Further changes in the functional group compo-sition of the water-soluble fraction of aerosol OC may also occur following oxidation in the aerosol phase promoted by sunlight (Hoffer et al., 2005).
In this study, functional group analysis was performed by H NMR spectroscopy (Decesari et al., 2000). Our group has already applied this methodology, often coupled to liq-uid chromatography, to aerosol samples collected in urban (Matta et al., 2003) and remote sites (Cavalli et al., 2005), as well as in rural areas in the Amazon Basin impacted by biomass burning activities (Graham et al., 2002). Other au-thors have recently followed a similar methodology (Suzuki et al., 2001) for the study of organic aerosol.
Some important drawbacks were encountered, however, in the use of H NMR for the speciation of the aerosol. The main one is intrinsic to the nature of H NMR, i.e. it is a spec-troscopy of hydrogens. Furthermore, since D2O is the sol-vent, acidic hydrogens (like those of OH and CO2H groups) undergo chemical exchange with D2O and elude detection.
A solution is now presented to overcome the above men-tioned drawback, i.e., the chemical transformation of some organic functional groups, previously not detected by direct H NMR, into other groups that can be revealed by H NMR. A special interest was taken in the determination of carboxylic acid groups, since they represent the most abundant func-tional groups in the aerosol which affect the CCN ability of organic particles. To address this problem, a derivatization procedure has been developed that converts carboxylic acids (RCO2H) into the corresponding methyl esters (RCO2CH3) which exhibit a well-defined band in the H NMR spectrum. The overall protocol presented here provides WSOC
func-tional group composition expressed as concentrations of OC divided in aromatic, alkylic, hydroxyl/alkoxyl and carboxyl moieties. Average aerosol compositions were derived for the different periods of the campaign and for the different size intervals. WSOC chemical classes isolated on ion-exchange stationary phases were also subjected to H NMR analysis and methylation for the determination of the CO2H groups. The overall set of data was used for the elaboration of a chem-ical model as a synthetic representation of the aerosol OC composition during the SMOCC experiment (Decesari et al., 2005).
2 Experimental
2.1 Sampling
The aerosol samples used for this study were collected at the Fazenda Nossa Senora (FNS) in Rondˆonia, Brazil, during the SMOCC field campaign from 9 September 2002 to 14 November 2002 using a High Volume Dichotomous Sampler (HVDS) equipped with pre-baked quartz-fiber filters. Size-segregated samples were collected with a 5-stage Berner im-pactor with lower cut-offs at 0.05, 0.14, 0.42, 1.2 and 3.5µm. Sampling details are given elsewhere (Decesari et al., 2006). The sampling campaign was divided into three periods ac-cording to the meteorological conditions: 1) a first period corresponding to the middle–late dry season lasting until 7 October, 2) a transition phase from 8 to 31 October, and 3) the on-set of the wet season during the first two weeks of November. Aerosol concentrations followed the intensity of the biomass burning activities, which peaked during the dry period and decreased afterwards. Only sparse fires were ob-served during the wet period, and the aerosol loadings ap-proached the natural background of the Amazon Basin (Fuzzi et al., 2006). Throughout the campaign the aerosol concen-trations were different during day and night conditions, due to the diurnal evolution of the boundary layer and to possi-ble differences in the sources and transformation processes of the aerosol particles (Artaxo et al., 2002; Rissler et al., 2005). For this reason, sampling was conducted differentiat-ing between daytime and nighttime.
For the purpose of the present paper, samples are labeled as follows: for HVDS samples: HVDS-day of samplingD/N(HVDS-day/night)F/C(fine/coarse). Thus HVDS43NF means the fine fraction collected with the HiVol sampler present on the field during Fthe night of the 43rd day of sampling starting from 9 September 2002; if the D/N indication is missing the sampling refers to the whole day.
the 5-stage Berner impactor are: 0.05–0.14, 0.14–0.42, 0.42–1.2, 1.2–3.5, 3.5–10µm.
The HVDS filters and Berner impactor samples were stored in a freezer or refrigerator until the analysis.
2.2 Sample preparation
A known fraction of the filter was extracted with 30 ml of ultrapure (milliQ) water for 60 min with stirring. The aqueous solution was filtered on 0.45µm mixed-cellulose-esters membrane (MCE) (Millipore Millex®HA) and diluted with deionized water before Total Organic Carbon (TOC) analysis. A second set of samples underwent filtration on hydrophobic 0.45µm PTFE-membrane (Sartorius Minisart SRP 15) filters instead of the MCE filters allowing the attain-ment of better blank levels.
An aliquot of the filtered solution was evaporated to dry-ness under vacuum, collected with 0.7 mL of D2O con-taining sodium 3-trimethylsilyl-2,2,3,3-d4-propanoate (TSP, 0.24 mM), and used for H NMR analysis (NMR-A). Tedlar foils used to collect aerosol samples with the Berner impactor were extracted in 6 ml deionized water in an ultrasonic bath for 30 min. Aliquots were employed for TOC analysis, ion chromatography and HPLC. The residual volume of extract was dried under vacuum and redissolved in D2O for H NMR analysis.
2.3 Methylation procedure
Diazomethane solution in ether (about 0.5 M) was prepared from N-methyl-N-nitroso-p-toluensulfonamide (de Boer et al., 1963) and stored for short times over KOH pellets in a refrigerator.
To an aliquot of the aerosol extract, 2 mL of 0.1 M HCl were added and the resulting clear solution was evaporated to dryness. The residue was suspended in CH2Cl2(5 mL) in a 25 mL flask, cooled at 0◦C with an ice bath; 2 mL of ethereal CH2N2 solution were added and the suspension was sonicated in an ultrasonic bath at 0◦C for 30 min. After filtration on 0.2µm PTFE
fil-ter, and washing with CH2Cl2(15 mL), the resulting clear CH2Cl2solution was evaporated under vacuum; the residue was collected with 0.7 ml of CDCl3containing 0.02% of tetrakis(trimethylsilyl)silane (TKS), and was used for H NMR analysis (NMR-B). The PTFE filter was then rinsed with 10 mL of pure water and the solution was transferred back to the 25 mL flask. After evaporation the flask was stored in a desiccator overnight. The residue was finally collected with TSP-containing D2O and subjected to HNMR analysis (NMR-C).
2.4 TOC measurement
TOC in aqueous solution was measured with a Shimadzu 5000A TOC-analyser. The aliquots of aerosol extracts had to be diluted to 4 ml for the TOC analysis. Blank levels were
1 ppmC and 0.25 ppmC, when filtering the extracts of the HVDS filters with hydrophilic cellulose filters and PTFE hy-drophobic filters, respectively. Blank levels for the extracts of the Berner impactor tedlar foils were around 0.2 ppmC (Decesari et al., 2005).
2.5 H NMR analysis
H NMR spectra were obtained with Varian Inova 600 or Mercury 400 instruments at 600 MHz or 400 MHz, respec-tively. For spectra in D2O solution (NMR-A and NMR-C), the residue HOD peak was suppressed by presaturation using a PRESAT pulse sequence. From 200 to 1000 scans were ac-quired depending on the concentration. A 0.5 Hz line broad-ening (LB) weighting function and baseline correction were generally applied.
Area integration of the spectra was cut in the following regions, which have been attributed to specific functional groups: −0.05–0.30 ppm (Standard); 0.60–1.80 (aliphatic hydrogens, R-H ); 1.80–3.20 (hydrogens inα-position to un-saturated carbons, =C-C-H ); 3.20–4.40 (hydrogens bound to alcoholic, ethereal or estereal carbons, O-C-H ); 5.00–5.50 (acetalic and vinylic hydrogens, O-CH-O and =C-H ); 6.50– 8.20 (arylic hydrogens, Ar-H ). The actual sensitivity of the H NMR analysis depends on many factors, the most impor-tant being the magnet field strength, the number of scans accumulated in the spectrum (therefore the overall time of scanning) and the quantity of sample available. In particular, signal to noise ratio increases proportionally to the square root of the number of scans and approximately to the third power of the magnetic field strength. To give a rough esti-mation of the sensitivity we have calculated that the sensi-tivity achieved in the NMR spectrum of sample HVDS45NF, a rather unfavourable case, would be sufficient to detect lev-oglucosan at a concentration in the air of 0.04µg/m3. For this sample we used14of the collected filter and we acquired 800 scans corresponding to about 55 min with a 600 MHz in-strument.
2.6 Ion-exchange chromatography (IC)
p p m ( t 1 ) 5 . 0 0 . 0
0.
00
0
(a)
(b)
(c)
* *
# #
* #
* #
(d)
Fig. 1. H NMR spectra of the typical samples of fine aerosols
WSOC; HVDS15DF from the dry(a), HVDS45NF from the tran-sition(b)and HVDS51NF from the wet(c)periods. Spectrum of blank HVDS7F(d). Spectra are in D2O solution containing TSP as internal standard. The HOD signal is presaturated. * = Internal TSP standard. # = residual HOD peak. Vertical scale is adjusted according to the intensity of each spectrum.
employs longer columns compared to those used for the calibration of the HPLC technique (Decesari et al., 2005), and it allows the fractionation of sample amounts of up to 1000µgC of WSOC.
Blank filters were submitted to the same procedures de-scribed above for the real samples. Their NMR spectra (NMR-A, NMR-B, NMR-C) were integrated in the usual way and divided into the same regions as real samples.
3 Results
3.1 H NMR analysis of HVDS filter sample
H NMR spectra of three samples representative for the fine fraction of the dry (a), transition (b) and wet (c) periods and of blank (d) are presented in Fig. 1. As normally found
p p m ( t 1 ) 5 . 0 0 . 0
* #
(a)
(b)
* #
(c)
* #
Fig. 2.H NMR spectra of the a typical samples of coarse aerosols
WSOC; HVDS45NC from the transition(a)and HVDS51NC from the wet(b)periods.(c)Spectrum of blank HVDSB2F. Spectra are in D2O solution containing TSP as internal standard. The HOD signal is presaturated. * = Internal TSP standard. # = residual HOD peak. Vertical scale is adjusted according to the intensity of each spectrum.
in this type of NMR spectra, the general shape is given by large bands deriving from the convolution of signals from a huge amount of different compounds, while it is superim-posed by a relatively small number of sharp peaks, coming from few major substances. Among these substances, the most clearly identifiable are acetate, formate, the H-1 pro-ton of levoglucosan at 5.46 ppm and the methyl propro-tons of 2-methylerythritol at 1.13 ppm. The latter two compounds are, respectively, the major substance formed from the py-rolysis of cellulose and the major aerosol derivative of the photo-oxidation of isoprene (Claeys et al., 2004)
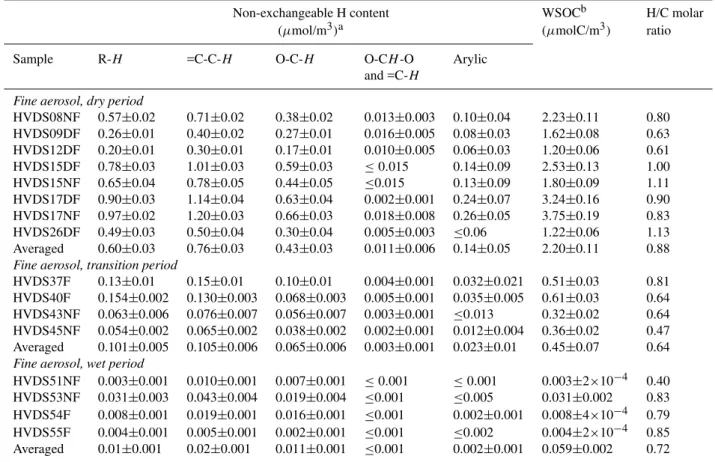
Table 1.H NMR and TOC data for fine aerosol samples from the HVDS sampler.
Non-exchangeable H content WSOCb H/C molar
(µmol/m3)a (µmolC/m3) ratio
Sample R-H =C-C-H O-C-H O-CH-O Arylic
and =C-H
Fine aerosol, dry period
HVDS08NF 0.57±0.02 0.71±0.02 0.38±0.02 0.013±0.003 0.10±0.04 2.23±0.11 0.80 HVDS09DF 0.26±0.01 0.40±0.02 0.27±0.01 0.016±0.005 0.08±0.03 1.62±0.08 0.63 HVDS12DF 0.20±0.01 0.30±0.01 0.17±0.01 0.010±0.005 0.06±0.03 1.20±0.06 0.61 HVDS15DF 0.78±0.03 1.01±0.03 0.59±0.03 ≤0.015 0.14±0.09 2.53±0.13 1.00 HVDS15NF 0.65±0.04 0.78±0.05 0.44±0.05 ≤0.015 0.13±0.09 1.80±0.09 1.11 HVDS17DF 0.90±0.03 1.14±0.04 0.63±0.04 0.002±0.001 0.24±0.07 3.24±0.16 0.90 HVDS17NF 0.97±0.02 1.20±0.03 0.66±0.03 0.018±0.008 0.26±0.05 3.75±0.19 0.83 HVDS26DF 0.49±0.03 0.50±0.04 0.30±0.04 0.005±0.003 ≤0.06 1.22±0.06 1.13 Averaged 0.60±0.03 0.76±0.03 0.43±0.03 0.011±0.006 0.14±0.05 2.20±0.11 0.88
Fine aerosol, transition period
HVDS37F 0.13±0.01 0.15±0.01 0.10±0.01 0.004±0.001 0.032±0.021 0.51±0.03 0.81 HVDS40F 0.154±0.002 0.130±0.003 0.068±0.003 0.005±0.001 0.035±0.005 0.61±0.03 0.64 HVDS43NF 0.063±0.006 0.076±0.007 0.056±0.007 0.003±0.001 ≤0.013 0.32±0.02 0.64 HVDS45NF 0.054±0.002 0.065±0.002 0.038±0.002 0.002±0.001 0.012±0.004 0.36±0.02 0.47 Averaged 0.101±0.005 0.105±0.006 0.065±0.006 0.003±0.001 0.023±0.01 0.45±0.07 0.64
Fine aerosol, wet period
HVDS51NF 0.003±0.001 0.010±0.001 0.007±0.001 ≤0.001 ≤0.001 0.003±2×10⁻⁴ 0.40 HVDS53NF 0.031±0.003 0.043±0.004 0.019±0.004 ≤0.001 ≤0.005 0.031±0.002 0.83 HVDS54F 0.008±0.001 0.019±0.001 0.016±0.001 ≤0.001 0.002±0.001 0.008±4×10⁻⁴ 0.79 HVDS55F 0.004±0.001 0.005±0.001 0.002±0.001 ≤0.001 ≤0.002 0.004±2×10⁻⁴ 0.85 Averaged 0.01±0.001 0.02±0.001 0.011±0.001 ≤0.001 0.002±0.001 0.059±0.002 0.72
aUncertainty is estimated from the variability of noise in the NMR spectra. Other error sources are believed to be of minor importance.
When concentrations fall below the detection limit (D. L.), the value of the D. L. is reported. bUncertainty on TOC is≤5%
to purely alkylic hydrogens, hydrogens inα-position to un-saturated carbons, and hydrogens bound to alcoholic, ethe-real or esteethe-real carbons. The band of alkylic R-H (δH: 0.60– 1.80 ppm) shows maxima at 0.9 ppm from terminal methyl hydrogens H3C-C and 1.3 ppm from polymethylene chains (CH2)n. The peaks are, however, poorly pronounced, indi-cating that long aliphatic chains, such as those of fatty acids, are not particularly abundant in these samples. This find-ing contrasts with the NMR analysis of samples from pol-luted environments at middle-latitudes (Decesari et al., 2000, 2006). Aromatic hydrogen atoms are responsible for the very broad band, with chemical shifts extending from 6 to 8.2 ppm, that shows two distinct maxima at 7.0 and 7.6 ppm. The first can be attributed to aromatic rings with electron-donor substituents (e.g., phenolic groups), while the second is characteristic of aromatic rings carrying both electron-donor and electron-acceptor (e.g., carbonyls and carboxyls) groups. The overall spectral features observed for the PM2.5 HVDS samples collected during the SMOCC campaign sub-stantially match those found for analogous samples collected during the dry and transition periods in 1999, during the EUSTACH-2 experiment (Graham et al., 2002).
Table 2.H NMR and TOC data for coarse aerosol samples from the HVDS sampler.
Non-exchangeable H content (µmol/m3)a WSOCb(µmolC/m3) H/C molar ratio
Sample R-H =C-C-H O-C-H O-CH-O Arylic
and=C-H
Coarse aerosol, transition period
HVDS43NC ≤0.005 ≤0.006 0.03±0.005 ≤0.0003 ≤0.003 0.041±0.002 0.90 HVDS45NC 0.010±0.003 ≤0.003 0.017±0.002 ≤0.001 ≤0.005 0.056±0.003 0.58 Averaged 0.005±0.002 ≤0.005 0.025±0.004 ≤0.0007 ≤0.004 0.049±0.002 0.74
Coarse aerosol, wet period
HVDS51NC 0.018±0.007 ≤0.009 0.015±0.007 ≤0.002 ≤0.16 0.027±0.001 1.62 HVDS54C 0.006±0.0001 0.002.±0.0002 0.025±0.0001 ≤0.0001 ≤0.0002 0.038±0.002 0.93 HVDS55C ≤0.002 0.005±0.002 0.016±0.002 ≤0.0001 ≤0.0003 0.025±0.001 0.92 Averaged ≤0.003 0.005±0.003 0.019±0.003 ≤0.0009 ≤0.005 0.030±0.002 1.16
aUncertainty is estimated from the variability of noise in the NMR spectra. Other error sources are believed to be of minor importance.
When concentrations fall below the detection limit (D. L.), the value of the D. L. is reported. bUncertainty on TOC is≤5%.
0% 20% 40% 60% 80% 100%
R-H =C-C-H O-C-H O-CH-O Arylic
Fine Dry Fine Transition Fine Wet Coarse Transition Coarse Wet
(a)
0.0 0.2 0.4 0.6 0.8 1.0 1.2
HVDS 08NF HVDS
09DF HVDS
12D F
HVDS 15D
F
HVDS 15N
F
HVDS 17DF
HVDS 17NF HVDS
26DF HVD
S37F HVD
S40F HVD S43N
F
HVDS 45NF
HVDS 51NF
HVDS 53NF
HVDS 54F HVDS
55F
H/C molar ratio
Mean Fine Dry 0.88
Mean Fine Trans. 0.64
Mean Fine Wet 0.72
(b)
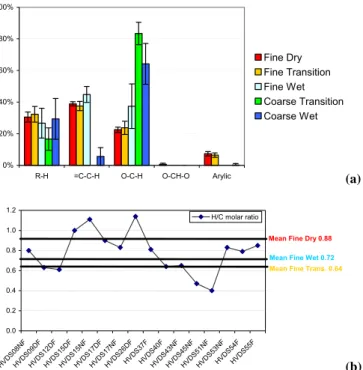
Fig. 3. (a)Average relative functional group percentage
composi-tion of fine WSOC samples in terms of moles of H.(b)H/C molar ratios of specific WSOC aerosol samples and mean values.
separation in the dichotomous sampler (Dzubay et al., 1977; Graham et al., 2002) is likely to explain partly the observed similarity between the spectra of the coarse and fine filters. To take into account the limited efficiency of the HVDS in separating the PM>2.5 fraction from the fine aerosol, the
µmol of H of each functional groups of coarse WSOC was corrected for the contribution of the fine particles, estimated on the basis of the relative volumes of air passed through the fine and coarse filters (Dzubay et al., 1977). The con-centrations of the functional groups in PM>2.5, reported in the following tables are already corrected according to this procedure.
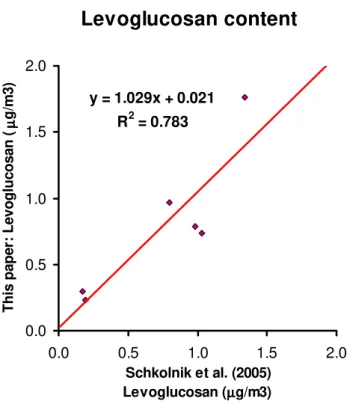
The amounts of organic non-exchangeable hydrogens and their uncertainty for the fine fraction of WSOC in the differ-ent spectral regions reported in Table 1, in terms ofµmols of H per m3of air sampled. All data are already corrected for the blank contribution. The same table reports the WSOC content in terms of µmols of C/m3 (from TOC measure-ments). The last column of Table 1 gives the measured molar H/C ratio, as a rough estimation of the degree of unsaturation of the organic matter in the samples. Table 2 gives the same data for the coarse size fraction, the coarse fraction data are also corrected for the fine fraction contribution. Average rel-ative amounts of hydrogens in the different functional groups for the fine and the coarse fraction are also shown in Fig. 3a. Among the spectral regions, the 5.0–5.5 ppm region at-tributed to acetalic and vinylic hydrogens is generally dom-inated by the levoglucosan anomeric hydrogen. The amount of levoglucosan calculated from our NMR data is in fair agreement with that found by GC/MS analysis (Claeys et al., 20051) and ion-exclusion chromatography (Schkolnik et al., 2005) on the same samples. The comparison with the data 1Claeys, M., Kourtchev, I., Pashynska, V., Vas, G., Vermeylen,
Table 3.Averaged H content percentage of WSOC aerosols.
R-H =C-C-H O-C-H O-CH-O Arylic and =C-H
Fine, dry period 31.1±0.6 39.0±0.8 22.2±0.6 0.6±0.2 7.2±1.4 Fine, transition period 33.9±0.8 35.3±0.9 21.9±0.8 1.1±0.1 7.7±1.8 Fine, wet period 25.5±0.7 43.7±1.3 25.5±0.6 0.9±0.1 4.4±2.2 Coarse, transition period 16.6±7.1 –a 83.4±7.1 –a –a Coarse, wet period 29.4±12.9 ≤5.6 64.2±12.9 –a –a
aIn these cases no significant data from the single samples could be achieved.
from Schkolnik et al. (2005) is shown in Fig. 4; there is a fairly good correlation (R2=0.78); only 3% overestimation is observed in the H NMR analysis. Two clear trends im-mediately emerge from the inspection of Tables 1 and 2: a) samples collected in the dry period have 4–10 times higher concentrations than the samples from the transition period, which are, in turn, have 5–100 times higher concentrations than the samples from the wet period; b) within each period, only minor differences are observed among the samples, and, for the dry period, no clear variation between samples col-lected during day and night is visible. It is not possible to establish a similar trend for the other two periods since no day/night differentiated samples were available or analyzed. A less clear conclusion can be drawn with regard to the H/C molar ratio (Fig. 3b), since the data vary from 0.4 to 1.6. Nonetheless it can be roughly stated that the H/C ratio is higher in the dry period than in the transition and wet pe-riods, although this statement is made cautiously, since some signals fall below the detection limit in the weaker spectra of the transition and wet period samples. This was due to the low aerosol loading, which was sometimes below detection limit, leading to an underestimation of the overall H content, an aspect that will be discussed in detail below.
Considering the relative uniformity of the samples, it was decided to compare the average relative distribution of hy-drogens among the functional groups for the fine and coarse aerosol in the three periods in Table 3. It can be seen that the samples from the dry and transition periods have very sim-ilar functional group composition, with about 30% purely aliphatic hydrogens, a little more hydrogens in α position to unsaturated carbon atoms, 20% hydrogens on oxygenated carbons, 1% acetalic and about 7% arylic. The WSOC from the wet period has less aliphatic moieties, more unsaturated and oxygenated positions and less arylic hydrogens, and is thus, in synthesis, more “oxidized” than the aerosol of the two previous periods.
Our results are generally consistent with those obtained in a previous sampling campaign in 1999 in the same region for the dry and transition periods (Graham et al., 2002); however, the present samples revealed a larger fraction of unsaturated compounds.
Levoglucosan content
y = 1.029x + 0.021
R2 = 0.783
0.0 0.5 1.0 1.5 2.0
0.0 0.5 1.0 1.5 2.0
Schkolnik et al. (2005)
Levoglucosan (µµµµg/m3)
This
pa
pe
r:
Le
vo
gluc
os
a
n
(µµµµ
g/m
3
)
Fig. 4. Comparison between the levoglucosan data of Schkolnik
et al. (2005) and the data obtained by our method for the same samples. Samples are: HVDS09DF, HVDS15DF, HVDS15NF, HVDS26DF, HVDS43NF, HVDS45NF.
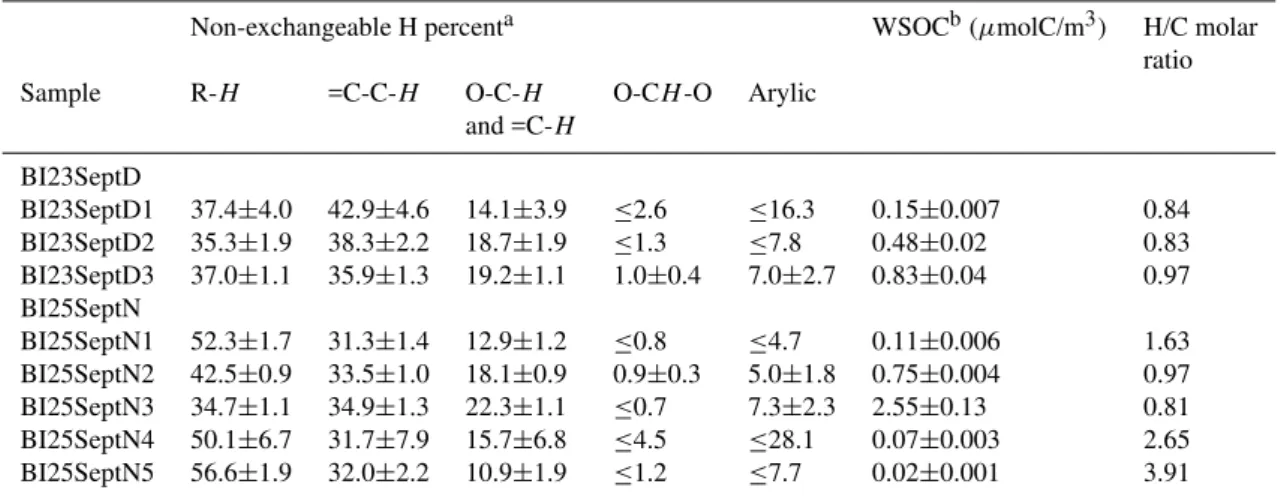
Table 4.H NMR and TOC data for size-segregated samples form the Berner impactor.
Non-exchangeable H percenta WSOCb(µmolC/m3) H/C molar ratio Sample R-H =C-C-H O-C-H O-CH-O Arylic
and =C-H
BI23SeptD
BI23SeptD1 37.4±4.0 42.9±4.6 14.1±3.9 ≤2.6 ≤16.3 0.15±0.007 0.84 BI23SeptD2 35.3±1.9 38.3±2.2 18.7±1.9 ≤1.3 ≤7.8 0.48±0.02 0.83 BI23SeptD3 37.0±1.1 35.9±1.3 19.2±1.1 1.0±0.4 7.0±2.7 0.83±0.04 0.97 BI25SeptN
BI25SeptN1 52.3±1.7 31.3±1.4 12.9±1.2 ≤0.8 ≤4.7 0.11±0.006 1.63 BI25SeptN2 42.5±0.9 33.5±1.0 18.1±0.9 0.9±0.3 5.0±1.8 0.75±0.004 0.97 BI25SeptN3 34.7±1.1 34.9±1.3 22.3±1.1 ≤0.7 7.3±2.3 2.55±0.13 0.81 BI25SeptN4 50.1±6.7 31.7±7.9 15.7±6.8 ≤4.5 ≤28.1 0.07±0.003 2.65 BI25SeptN5 56.6±1.9 32.0±2.2 10.9±1.9 ≤1.2 ≤7.7 0.02±0.001 3.91
aUncertainty is estimated from the variability of noise in the NMR spectra. Other error sources are believed to be of minor importance.
When concentrations fall below the detection limit (D. L.), the value of the D. L. is reported. bUncertainty on TOC is≤5%.
3.2 Size segregated samples
Two size segregated Berner impactor sample sets collected in the dry period during the day of 23 September and the night of 25 September 2005 were also used for HNMR in-vestigation of WSOC. The spectra in D2O solution of the five fractions of the sample collected on 25 September and one spectrum of the blank are shown in Fig. 5. Percentage distributions of hydrogens in the different spectral regions, TOC values and H/C ratios are reported in Table 4. The func-tional group composition of the nocturnal sample BI25SeptN shows marked variations among the size intervals. While the composition of the third impactor stage (0.42–1.2µm) is similar to the mean composition of the fine samples col-lected with the HVDS in the same period, all the other size fractions show a higher content of alkylic groups and a lower content of oxygenated and aromatic functional groups. In particular, the smallest size range, 0.05–0.14µm, shows a high proportion (45%) of alkylic hydrogens and a low con-tent of H-C-O groups. The results obtained for the Berner impactor samples do not contradict those from the HVDS fine filters, since the mass of submicrometer particles is al-most completely accounted for by particles with diameter of 0.14–1.2µm (Fig. 6).
Although the risk of contamination is high for very diluted samples and data obtained from such samples must be treated with care, it must be emphasized that the H NMR spectrum of the water-extract of the 0.05–0.14µm particles does not resemble any other published spectrum of ambient aerosol that has been collected so far (e.g., Decesari et al., 2000, 2005; Suzuki et al., 2001; Graham et al., 2002). Instead, similar spectra were obtained from the analysis of smoke par-ticles produced by the combustion of sugar cane in the Max
Planck combustion facility, during the SMOCC intercompar-ison experiment (unpublished results). Apparently, the pecu-liar functional group composition of the finest size range of sample BI25SeptN is characteristic of freshly-emitted smoke particles. This hypothesis is consistent with the results of the analysis of inorganic ions and WSOC chromatographic classes carried out on 32 size-segregated samples collected during the dry period (Fuzzi et al., 2006). Such results indi-cate an enrichment of fresh smoke particles in the smallest size intervals, and a higher proportion of such particles in the nocturnal aerosol samples. Conversely, aerosol samples collected during daytime show a more aged character and a more homogeneous composition in the submicrometer size range. This finding is in agreement with the NMR functional group composition of the size-segregated sample BI23SeptD, which shows only limited variation from the size intervals in the fine size range (Table 4).
Due to the small number of impactor samples analyzed, the present data do not allow the derivation of average size-segregated NMR compositions for the different periods of the campaign. On the other hand, these findings support poten-tially strong variations of the functional group composition between the different size intervals, which cannot be seen by fractionating the aerosol with a cut-off of 2.5µm (or even 1.0 or 2.0µm). Thus there is definitely a call for further investi-gation by means of sampling techniques based on multistage-impactors.
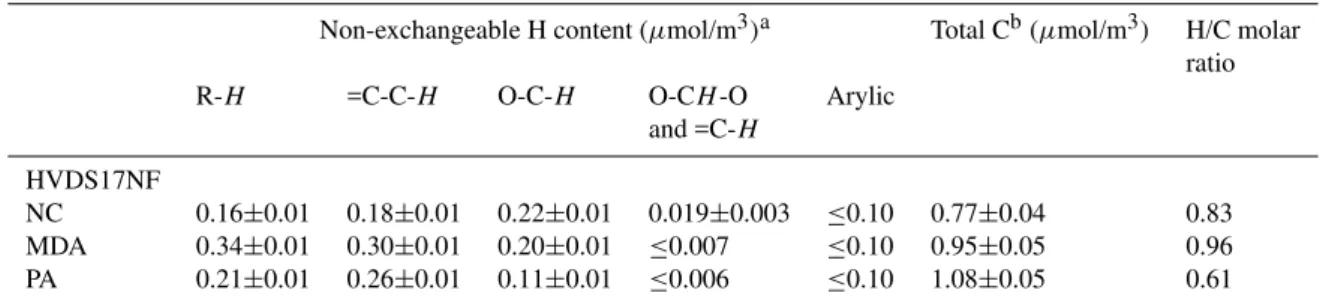
Table 5.H NMR data for IC fractions for sample HVDS17NF.
Non-exchangeable H content (µmol/m3)a Total Cb(µmol/m3) H/C molar ratio R-H =C-C-H O-C-H O-CH-O Arylic
and =C-H
HVDS17NF
NC 0.16±0.01 0.18±0.01 0.22±0.01 0.019±0.003 ≤0.10 0.77±0.04 0.83 MDA 0.34±0.01 0.30±0.01 0.20±0.01 ≤0.007 ≤0.10 0.95±0.05 0.96 PA 0.21±0.01 0.26±0.01 0.11±0.01 ≤0.006 ≤0.10 1.08±0.05 0.61
aUncertainty is estimated from the variability of noise in the NMR spectra. Other error sources are believed to be of minor importance.
When concentrations fall below the detection limit (D. L.), the value of the D. L. is reported. bTotal C is measured by TOC for the separated fractions after complete removal of NH
4HCO3. Uncertainty on Total C is≤5%.
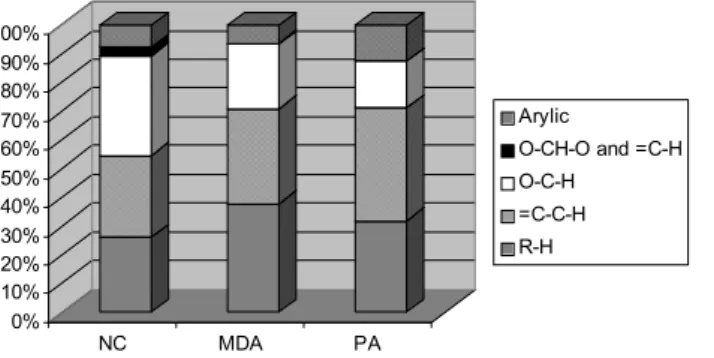
the separation of the three main fractions, operationally iden-tified on the basis of their chromatographic behavior as neu-tral compounds (NC), mono- and dicarboxylic acids (MDA) and polycarboxylic acids (PA). The H-NMR spectra of the three fractions of sample HVDS17NF are shown in Fig. 7, while the corresponding hydrogen content is reported in Ta-ble 5 and plotted in Fig. 8.
Considering the overall amount of non-exchangeable hy-drogens, the NC, MDA and PA fractions represent 27, 38 and 35%, respectively. When compared to the TOC data, the following H/C ratios are obtained: 0.83, 0.96, and 0.61, therefore the PA fraction is significantly more rich in dou-ble bonds and rings than the other two. Looking at the relative composition, the three fractions are very different: the NC fraction is dominated by hydrogens bound to oxy-genated carbons, this can be due to the conspicuous presence of polyols or sugar-like compounds; the relatively high con-centration of acetalic hydrogens, mostly derived from H-1 of levoglucosan, accounts for the presence of anhydrosugars; moreover, consistent aromatic and aliphatic chain moieties are present in this fraction, testifying to its complex compo-sition; the MDA fraction contains a more unbiased distribu-tion of hydrogens in the different spectral regions and can be interpreted as a complex mixture of hydroxylated or alkoxy-lated aliphatic and aromatic carboxylic acids; the PA frac-tion exhibits a large aromatic content and a reduced amount of hydroxylated and alkoxylated carbons with respect to the previous one. The spectral features and other characteristics of the PA fraction were previously attributed to humic-like substances (HULIS); indeed the presence of HULIS in sam-ples collected during the SMOCC campaign has been sug-gested (Hoffer et al., 2005). The functional groups of the PA in sample HVDS17NF indicate that the overall composition of HULIS produced by biomass burning marginally matches that of humic and fulvic acids derived from the early diagene-sis of lignin and cellulose. Indeed, careful examination of the aromatic hydrogens region (6.5–8 ppm) of Fig. 7c shows that the maximum of the band is located at 7.6 ppm, (not
indica-tive of phenols and anysols); on the contrary, aromatic com-pounds characteristic of lignin are characterized by a massive presence of hydroxy and alkoxy substituents.
3.4 H NMR analysis of derivatized WSOC samples The carboxylic acid functional group has a special role in the chemistry of water soluble aerosol: it is the most diffused group that can be ionised, allowing organic compounds to assume a negative charge. In its undissociated form, it is a strong hydrogen-bond donor and acceptor. Both these fea-tures can influence the activity and surface tension of wa-ter, two crucial parameters in determining the CCN ability of aerosol particles. Due to these outstanding properties, many carboxylic acids have been investigated and detected in the aerosol, including short chain aliphatic acids, saturated and unsaturated fatty acids, di- and tricarboxylic acids, mono-and polycarboxylic hydroxyacids, benzoic acids etc. Almost all of them have been found in biomass burning aerosol and specifically during the SMOCC campaign (Decesari et al., 2006). However, a measurement of the overall amount of CO2H groups within aerosol samples is still missing, to our best knowledge.
It was decided to apply the functional group approach to the analysis of biomass burning WSOC aerosol from Rondˆonia also to the carboxylic acid group. Since the direct information was missing in the H NMR spectrum in D2O be-cause of the chemical exchange of the CO2H hydrogen with the solvent, a method was developed to convert the NMR in-visible CO2H groups in the NMR detectable CO2CH3group. A similar transformation for NMR analysis has previously been applied to the investigation of humic acids (Noyes and Leenheer, 1989), but never to atmospheric aerosols.
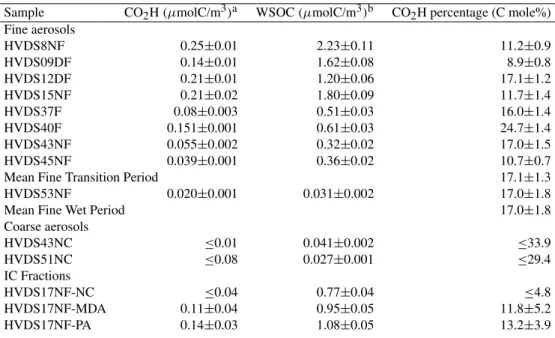
Table 6. H NMR data from methylation procedure.
Sample CO2H(µmolC/m3)a WSOC(µmolC/m3)b CO2H percentage (C mole%) Fine aerosols
HVDS8NF 0.25±0.01 2.23±0.11 11.2±0.9
HVDS09DF 0.14±0.01 1.62±0.08 8.9±0.8
HVDS12DF 0.21±0.01 1.20±0.06 17.1±1.2
HVDS15NF 0.21±0.02 1.80±0.09 11.7±1.4
HVDS37F 0.08±0.003 0.51±0.03 16.0±1.4
HVDS40F 0.151±0.001 0.61±0.03 24.7±1.4
HVDS43NF 0.055±0.002 0.32±0.02 17.0±1.5
HVDS45NF 0.039±0.001 0.36±0.02 10.7±0.7
Mean Fine Transition Period 17.1±1.3
HVDS53NF 0.020±0.001 0.031±0.002 17.0±1.8
Mean Fine Wet Period 17.0±1.8
Coarse aerosols
HVDS43NC ≤0.01 0.041±0.002 ≤33.9
HVDS51NC ≤0.08 0.027±0.001 ≤29.4
IC Fractions
HVDS17NF-NC ≤0.04 0.77±0.04 ≤4.8
HVDS17NF-MDA 0.11±0.04 0.95±0.05 11.8±5.2
HVDS17NF-PA 0.14±0.03 1.08±0.05 13.2±3.9
aUncertainty is estimated from the variability of noise in the NMR spectra. Other error sources are believed to be of minor importance. When concentrations fall below the detection limit (D. L.), the value of the D. L. is reported.
bUncertainty on TOC is≤5%.
in Fig. 9. Since only carboxylic acids and not carboxylates (RCO−2)react with CH2N2, acidification with excess HCl is carried out prior to reaction, in order to convert carboxylates into carboxylic acids. CH2N2is a dangerous and toxic sub-stance (R: 45; S: 53–45), but the very small amounts required allow safe operation by well trained personnel.
Methylation is performed on dried, acidified WSOC ex-tract in CH2Cl2suspension by adding a strong molar excess of CH2N2solution in diethyl ether at 0◦C. The reagent in excess is then removed by evaporation. Conversion of acids into methyl esters strongly reduces the polarity of such com-pounds, making them soluble in organic solvents. The parts of WSOC that do not contain acids, mainly sugars and poly-ols, are unaffected and remain soluble only in water. There-fore our procedure ends up with two products for NMR anal-ysis: one in CDCl3solution, containing the methyl ester of carboxylic acids, and one in D2O solution, containing the species other than carboxylic acids. The H NMR spectra of these two fractions (NMR-B in CDCl3 and in NMR-C D2O) are compared in Fig. 10 with that of the original sam-ple HVDS8NF in D2O (NMR-A) and of a blank sample in CDCl3. The signals present in this last spectrum come from impurities of the reagent and provide some small interfer-ence contribution in the methylesters region (3.20–4.40 ppm) region. Looking at NMR-C, one immediately observes a similarity with the spectrum of fraction NC in Fig. 7. The integrated data are also similar. It suggests that this
Table 7.Average carbon percentages in aerosol WSOC.
C content (moles%)a
R-H =C-C-H O-C-H O-CH-O Arylic CO2Hb Unaccounted
and =C-H Carbonc
Guessed H/C ratio 1.8 1.8 1.2 1.0 0.4
Fine aerosol, dry period
15.2±0.3 19.1±0.4 16.3±0.4 0.5±0.2 15.8±2.4 12.1±1.5 28.1±1.2 Fine aerosol, Transition period
11.7±0.3 13.0±0.3 11.3±0.4 0.9±0.1 12.0±2.8 17.9±1.3 33.2±1.3 Fine aerosol, wet period
9.9±0.3 18.5±0.6 16.1±0.3 0.7±0.1 8.1±4.0 17.0±1.8 24.6±1.8 Coarse aerosol, transition period
9.7±4.2 –d 90.3±7.7 –d –d –d –
Coarse aerosol, wet period
19.5±8.4 ≤10.0 70.6±14.2 –d –d –d –
aPercentage C content calculated from H NMR data of Tables 1 and 2, dividing each value by the H/C ratios reported here and averaging
over the samples of each period. bCO
2H content is averaged over those samples for which its amount was determined (see Table 6).
cPercentage difference between the amount of C calculated from NMR and the WSOC amount obtained by TOC reported in Tables 1 and 2. dIn these cases no significant data from the single samples could be achieved.
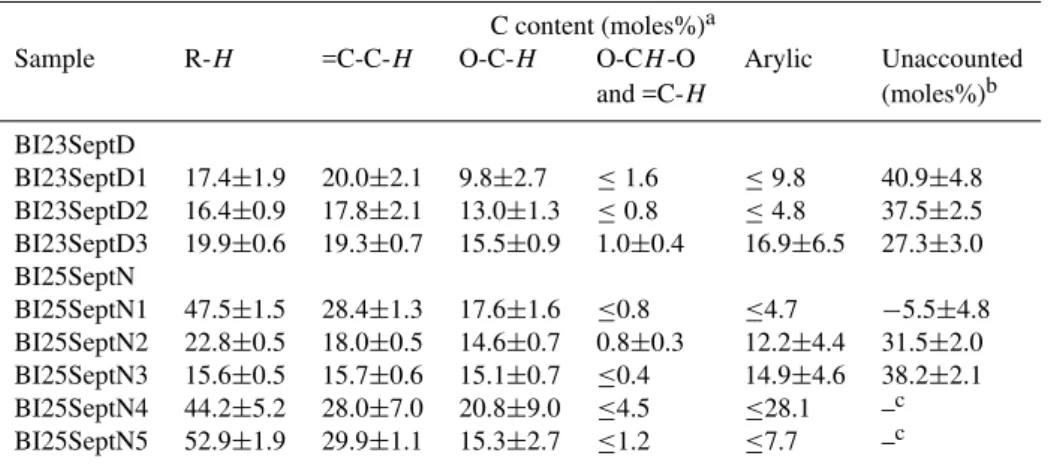
Table 8.Carbon percentages in size-segregated samples.
C content (moles%)a
Sample R-H =C-C-H O-C-H O-CH-O Arylic Unaccounted and =C-H (moles%)b
BI23SeptD
BI23SeptD1 17.4±1.9 20.0±2.1 9.8±2.7 ≤1.6 ≤9.8 40.9±4.8 BI23SeptD2 16.4±0.9 17.8±2.1 13.0±1.3 ≤0.8 ≤4.8 37.5±2.5 BI23SeptD3 19.9±0.6 19.3±0.7 15.5±0.9 1.0±0.4 16.9±6.5 27.3±3.0 BI25SeptN
BI25SeptN1 47.5±1.5 28.4±1.3 17.6±1.6 ≤0.8 ≤4.7 −5.5±4.8 BI25SeptN2 22.8±0.5 18.0±0.5 14.6±0.7 0.8±0.3 12.2±4.4 31.5±2.0 BI25SeptN3 15.6±0.5 15.7±0.6 15.1±0.7 ≤0.4 14.9±4.6 38.2±2.1 BI25SeptN4 44.2±5.2 28.0±7.0 20.8±9.0 ≤4.5 ≤28.1 –c BI25SeptN5 52.9±1.9 29.9±1.1 15.3±2.7 ≤1.2 ≤7.7 –c
aUncertainty is estimated from the variability of noise in the NMR spectra. Other error sources are believed to be of minor importance.
When concentrations fall below the detection limit (D. L.), the value of the D. L. is reported.
bPercentage difference between the amount of C calculated from H NMR and the WSOC amount obtained by TOC measurements reported in Table 4.
cCarbon content calculated from NMR was significantly higher than WSOC. For these samples C percentages are relative to the accounted carbon.
of fine and coarse aerosols and for the IC fractions of sample HVDS17NF, together with the overall moles of C in WSOC from TOC measurements. The last column of Table 6 gives the percentage of carboxylic carbons with respect to the total moles of water-soluble carbon. This last figure is about 11% for nighttime samples of fine aerosol during the dry period, but both higher and lower values are observed for integral daily samples, reaching 17% in samples from the transition and wet periods. In summary, 1 carbon in 9 up to 1 carbon
p p m ( t 1 ) 5 . 0 0 . 0
µ
(
a
)
*
#
(
b
)
(
c
)
(
d
)
(
e
)
(
f
)
#
#
#
#
#
*
*
*
*
*
Fig. 5. H NMR spectra of a size-segregated sample BI25SeptN.
Spectra(a)to(e), are from the different stages of the impactor (a: 0.05–0.14, b: 0.14–0.42, c: 0.42–1.2, d: 1.2–3.5, e: 3.5–10µm);(f)
blank. Spectra are in D2O solution containing TSP as internal stan-dard. The HOD signal is presaturated. * = Internal TSP stanstan-dard. # = residual HOD peak. Vertical scale is adjusted according to the intensity of each spectrum. Impurities from MCE are visible in the second spectrum (b), corresponding to the only one sample that has been subjected to filtration because of its high turbidity.
0 5 10 15 20 25 30 35
0.05 -0.14
0.14 -0.42
0.42 -1.2
1.2 -3.5
3.5 -10
µ
gC
/m
3
BI23SeptD BI25SeptN
Fig. 6.TOC content in the different stages of size-segregated
sam-ples.
ppm (t1) 5.0 0.0
# *
# *
# *
(c) (b) (a)
Fig. 7.IC fractions from sample HVDS17NF.(a)NC fraction,(b)
MDA fraction,(c)PA fraction. Spectra are in D2O solution con-taining TSP as internal standard. The HOD signal is presaturated. * = Internal TSP standard. # = residual HOD peak. Vertical scale is adjusted according to the intensity of each spectrum.
0% 10% 20% 30% 40% 50% 60% 70% 80% 90% 100%
NC MDA PA
Arylic
O-CH-O and =C-H O-C-H
=C-C-H
R-H
Fig. 8. Functional groups composition of IC fractions of WSOC of
sample HVDS17NF.
R O
OH
+H2C N N
R O
O +H3C N N R
O
O CH3
+ N N
Fig. 9. Conversion of carboxylic acids into methyl esters by
reac-tion with diazomethane.
unfractioned samples of the same period, and corresponds to the CO2H content of dodecanoic acid (i.e, 1 carbon in 12), while in the PA fractions that value significantly increases, but not more than to 1 carbon in 9. is a carboxylic acid.
4 Discussion
The above section presented H NMR functional group compositions of aerosol samples collected on PM2.5 and PM>2.5 quartz filters, as well as by means of a five-stage Berner impactor. However, in order to compare the re-sults obtained with other data from the SMOCC campaign, e.g. those from TOC-analysis or thermal evolution measure-ments, and to attempt a carbon mass balance, hydrogen amounts from H NMR must be converted into carbon units. To convert H into C amounts it was necessary to guess spe-cific H/C figures for the different functional groups defined in the previous section. This aspect has already been dis-cussed in a previous paper (Fuzzi et al., 2001), and we refer to that paper for details. The H/C values chosen here are al-most the same as those of the previous work, but a specific value was also defined for the arylic carbons, which were set at a value H/C=0.4, corresponding to the average H/C ratio for aromatic rings of lignins (Table 7). On this basis, the H content of Tables 1–5 were converted into C content. The averaged molar percentage amounts of C in HVDS sam-ples are reported in Table 7, while the corresponding val-ues for size segregated and chromatographic fraction sam-ples are reported in Tables 8 and 9, respectively. The total carbon content of each sample calculated the above way was compared with the actual WSOC content from TOC mea-surements. The differences found are also reported, as
p p m ( t 1 ) 5 . 0 0 . 0
NMR-B
NMR-C
NMR-A
Blank
# #
§ §
* * $
$
Fig. 10. H NMR spectra of sample HVDS8NF: NMR-A original
spectrum in D2O; NMR-B spectrum of the methyl ester in CDCl3; NMR-C spectrum of the CDCL3-insoluble residue, dissolved in D2O, blank in CDCl3. * = Internal TSP standard, # = residual HOD peak, $ TKS standard, § residual CHCl3. Vertical scale is adjusted according to the intensity of each spectrum.
centage of total WSOC, in Tables 7–9. If outliers are ex-cluded, the “unaccounted” carbon ranges from 20 to 40% of total WSOC, but the mean values reported in Table 7 for the fine aerosol are about 20% for the dry period and about 30% for the transition and wet periods. No clear correlation can be found with total carbon content; however, the higher val-ues of unaccounted C are generally found for lightly-loaded samples. It is very difficult to explain this imbalance in the carbon content. The following, non reciprocally excluding, hypotheses can be formulated:
1. A significant part of the material is colloidal or highly polymerised and is not revealed by NMR because of its unfavourable spectroscopic properties (very long T1); some volatile compounds (like low molecular weight acids) are lost in the manipulations.
0 10 20 30 40 50 60 70 80 90 100 Fine aerosol, dry period Fine aerosol, Transition period Fine aerosol, wet period Coarse aerosol, transition period Coarse aerosol, wet period Mo le C % R-H =C-C-H O-C-H
O-CH-O and =C-H Arylic
CO2H
Fig. 11.Mean and variability composition of WSOC samples from
HVDS in terms of moles of C.
assumption concerning the structure of the molecules composing the aerosols, but some values remain ques-tionable, especially the degree of substitution of the aro-matic rings and the relative amounts of alcohols, ethers and esters; moreover, there are many hydrogenless func-tional organic groups that would not be revealed at all in H NMR spectra: ketones, quaternary carbons in alkyl chains, fully substituted alkenes, arylic rings etc.. The presence of high molecular weight compounds and the presence of non-hydrogenated functional groups are believed to be the most likely causes of the carbon imbalance, but further investigation needs to be performed on these specific aspects.
What is reported for the HVDS samples holds also for the size-segregated samples and IC fractions, if we exclude some very diluted samples from the Berner impactor like BI25SeptN4 and BI25SeptN5. In these cases, a large overes-timation of C amount was found, possibly due to some con-tamination during sample preparation and analysis.
The relative average composition of the fine and coarse aerosol samples in terms of distribution of C among the dif-ferent functional groups is also shown in Fig. 11 together with their range of variation. This composition does not ac-count for all the measured carbon, as already remarked.
Any consideration about the IC fractions must be made with caution, since only one sample could be subjected to the chromatographic separation. Nevertheless, looking at Ta-ble 9 a clear difference appears between the three classes of WSOC. In particular, the PA fraction shows a strong aromatic character and a high CO2H content (almost 1 carbon out of 7 of the accounted carbons are carboxylic acids), resembling more closely humic-like substances.
The functional group compositions expressed in terms of carbon budget (Tables 7–9) can be directly compared to those obtained by speciation of individual WSOC by GC/MS, IC and IEC analysis on the same samples. A full treatment of the subject is given in a companion paper by Decesari et al., 2006. It turns out that the WSOC speciated at the molecu-lar level accounts for a small fraction of the functional groups determined by H NMR on bulk samples. On the other hand,
a substantial fraction of the H-C-O groups of the neutral fraction of WSOC could be apportioned into low-molecular weight polydroxylated compounds, such as sugar-anhydrides (e.g., levoglucosan) and sugar-alcohols (e.g., mannitol). Fur-thermore, the carboxylic groups of the MDA fraction of sam-ple HVDS17NF are largely accounted for by short-chain aliphatic acids and hydroxyacids. Conversely, the speciation of PA was insignificant, and alkylic and aromatic groups of all three IC fractions and of bulk samples could not be ac-counted for by the WSOC identified through high-resolution chromatographic techniques.
The lack of matching between the H NMR compositions and the individually detected compounds complicates the un-derstanding of the processes leading to the observed func-tional group distributions. Moreover, the results of the speci-ation methods sometimes apparently contradict those of the functional group analysis. A first point to discuss concerns the relative constancy of H NMR composition of daytime and nighttime samples This observation is in contrast with the re-sults of evolved gas analysis, GC/MS and liquid chromato-graphic analysis (Hoffer et al., 2005; Claeys et al., 20051; Schkolnik et al., 2005; Decesari et al., 2006), which pro-vided fairly distinct chemical compositions for day and night samples, probably due to the different prevalent combustion processes active in daytime (more flaming) and at night-time (more smoldering). Apparently, the combustion type does not affect the relative contribution of the main func-tional groups identified by H-NMR. This unexpected out-come calls for the presence of some compensation of the re-duced concentration of polyhydroxylated neutral compounds (NC) in daytime samples found in IC analysis, from poly-hydroxylated carboxylic acids (either MDA and PA). Gao et al. (2003) reported the presence of polyhydroxy-acids in high concentrations in smoke particles from savannah fires.
Table 9.Carbon percentages in IC fractions of sample HVDS17NF.
C content (moles%)a
IC Fraction R-H =C-C-H O-C-H O-CH-O Arylic CO2H Unaccounted
and =C-H (moles%)b
NC 12.0±0.7 13.1±0.7 24.1±1.1 2.5±0.4 ≤25.7 ≤3.4 29.6±10.6 MDA 20.0±0.6 17.7±0.7 17.8±0.6 ≤0.4 ≤8.3 11.8±4.3 17.4±2.5 PA 10.8±0.5 13.4±0.5 8.3±0.7 ≤0.6 ≤9.5 13.2±2.5 35.1±4.0
aUncertainty is estimated from the variability of noise in the NMR spectra. Other error sources are believed to be of minor importance.
When concentrations fall below the detection limit (D. L.), the value of the D. L.F is reported.
bPercentage difference between the amount of C calculated in the previous column and the WSOC amount obtained by TOC measurement
reported in Table 5.
biogenic compounds at the end of the campaign. An un-ambiguous tracer of biomass burning – levoglucosan – was found in significant concentrations in the wet period samples also by H NMR analysis (Fig. 1).
Another possible reason for the relatively small changes in the functional group composition of fine aerosol samples during the experiment is that biomass burning products were replaced by biogenic compounds having similar chemical structures, as in the case of sugar-alcohols compared to an-hydrosugars.
5 Conclusions
Functional group analysis by H NMR (Decesari et al., 2000) was extensively performed on aerosol samples collected in Rondˆonia, during the transition from the dry to the wet pe-riod. A new insight in the functional group composition of WSOC was provided by the development and application of a new methodology for the direct measurement of the amount of carboxylic groups through chemical derivatization and H NMR spectroscopic determination. Carboxylic acids are the most important oxygenated functional group in the organic aerosol fraction. In this way, the potential of the analyti-cal protocol proposed a few years ago has been greatly en-hanced.
The analysis of the aerosol samples according to the new analytical protocol results in CO2H molar contents ranging from 12 to 20% of the total carbon depending on sampling period and aerosol size fraction. Sensitivity and contami-nation are still a problem in this procedure but, by exploit-ing HiVol samplexploit-ing techniques, it was possible to determine the CO2H groups also in aerosol particles collected under the semi-clean conditions encountered at the end of the cam-paign.
The overall set of data provided by H NMR analysis indi-cates significantly different functional groups compositions between the fine and the coarse size fractions of the aerosol, and also between very fine particles (<0.1µm) and accumu-lation mode particles (approximately 0.2–1µm) for the
sam-ples of the dry season. The IC fractions of WSOC also show distinct compositions, especially with regard to their CO2H content. In contrast, only limited differences in the functional group composition of fine aerosol samples were found be-tween the dry, transition and the wet periods. This could be due to the persistence of biomass burning sources also in the wet period, and/or to the replacement of biomass burn-ing products by biogenic compounds showburn-ing an analogous functional group composition. The main distinguishing fea-tures of the wet season samples are a less aromatic character, a slightly higher content of hydroxyl-alkoxyl functionalities and a lower content of alkylic C-H groups. An increase in the number of CO2H groups per mole of water-soluble carbon was also observed from the dry to the wet period, indicating a progressive increase of the oxidation state of the aerosol WSOC throughout the campaign.
The problem of “missing carbon” amounting to 25%, on average, is still to be solved and calls for further research, al-though the present work is believed to represent a significant step towards carbon mass balance closure.
Acknowledgements. This work was carried out within the frame work of the Smoke, Aerosols, Clouds, Rainfall, and Climate (SMOCC) project, a European contribution to the Large-Scale Biosphere-Atmosphere Experiment in Amazonia (LBA). It was financially supported by the Environmental and Climate Program of the European Commission (contract N◦EVK2-CT-2001-00110 SMOCC), the Max Planck Society (MPG), the Project FISR Modellistica Molecolare, the Fundac¸˜ao de Amparo `a Pesquisa do Estado de S˜ao Paulo, and the Conselho Nacional de Desenvolvi-mento Cient´ıfico (Instituto do Milˆenio LBA). We are grateful to the Italian CNR – Agenzia 2000 (Project CNRC001D95 002) for the financial support of Fabio Moretti, and to the Belgian Federal Science Policy Office for funding the UGent research (contract EV/02/11A). We thank all members of the LBA-SMOCC and LBA-RACCI Science Teams for their support and assistance during the field campaign, especially A. C. Ribeiro, M. A. L. Moura, J. von Jouanne, L. Tarozzi and J. Cafmeyer.
References
Andreae, M. O., Rosenfeld, D., Artaxo, P., Costa, A. A., Frank, G. P., Longo, K. M., and Silva-Dias, M. A. F.: Smoking rain clouds over the Amazon, Science, 303, 1337–1342, 2004.
Artaxo, P., Vanderlei Martins, J., Yamasoe, M. A., Procopio, A. S., Pauliquevis, T. M., Andreae, M. O., Guyon, P., Gatti, L. V., and Cordova Leal, A. M.: Physical and chemical properties of aerosols in the wet and dry seasons in Rondˆonia, Amazonia, J. Geophys. Res. 107, 8081, doi:10.1029/2001JD000666, 2002. de Boer, T. J. and Backer, H. J.: Diazomethane, Organic Syntheses,
Coll. Vol. 4, 250–253, 1963.
Cavalli, F., Facchini, M. C., Decesari, S., Mircea, M., Em-blico, L., Fuzzi, S., Ceburnis, D., Yoon, Y. J., O’Dowd, C., Putaud, J.-P., and Dell’Acqua, A.: Advances in charac-terization of size-resolved organic matter in marine aerosol over the North Atlantic, J. Geophys. Res., 109, D24215, doi:10.1029/2004JD005137, 2004.
Claeys, M., Graham, B., Vas, G., Wu, W., Vermeylen, R., Pashyn-ska, V., Cafmeyer, J., Guyon, P., Andreae, M. O., Artaxo, P., and Maenhaut, W.: Formation of secondary organic aerosols through photooxidation of isoprene, Science, 303, 1173–1176, 2004. Decesari, S., Facchini, M. C., Fuzzi, S., and Tagliavini, E.:
Char-acterization of water soluble organic compounds in atmospheric aerosol: A new approach, J. Geophys. Res., 105, 1481–1489, 2000.
Decesari, S., Facchini, M. C., Fuzzi, S., McFiggans, G. B., Coe, H., and Bower, K. N.: The water-soluble organic component of size-segregates aerosol, cloud water and wet depositions from Jeju Island during ACE-Asia, Atmos. Environ., 39, 211–222, 2005a. Decesari, S., Fuzzi, S., Facchini, M. C., Maenhaut, W., Chi, X.,
Schkolnik, G., Falkovich, A., Rudich, Y., Claeys, M., Pashyn-ska, V., Vas, G., Kourtchev, I., Vermeylen, R., Hoffer, A., An-dreae, M. O., Tagliavini, E., Moretti, F., and Artaxo, P.: Charac-terization of the organic composition of aerosols from Rondˆonia, Brazil, during the LBA-SMOCC 2002 experiment and its rep-resentation through model compounds, Atmos. Chem. Phys., 6, 375–402, 2006.
Dzubay, T. G., Stevens, R. K., and Peterson, C. M.: Application of the dichotomous sampler to the characterization of ambient aerosols, in: X-Ray Fluorescence Analysis of Environmental Samples, edited by: Dzubay, T. G., Ann Arbor Science Publish-ers Inc., Michigan, 95–105, 1977.
Falkovich, A. H., Graber, E. R., Schkolnik, G., Rudich, Y., Maen-haut, W., and Artaxo, P.: Low molecular weight organic acids in aerosol particles from Rondonia, Brazil, during the biomass-burning, transition and wet periods, Atmos. Chem. Phys, 5, 781– 797, 2005.
Fuzzi, S., Decesari, S., Facchini, M. C., Matta, E., Mircea, M., and Tagliavini, E.: A simplified model of the water soluble or-ganic component of atmospheric aerosols, Geophys. Res. Lett., 20, 4079–4082, 2001.
Fuzzi, S., Decesari, Fuzzi, S., Decesari, S., Facchini, M. C., Cavalli, F., Emblico, L., Mircea, M., Andreae, M. O., Trebbs, I., Hoffer, A., Guyon, P., Artaxo, P., Rizzo, L. V., Lara, L. L., Pauliquevis, T., Maenhaut, W., Raes, N., Chi, X., Mayol-Bracero, O. L., Soto, L., Claeys, M., Kourtchev, I., Rissler, J., Swietliki, E., Tagliavini, E., Schkolnik, G., Falkovich, A. H., Rudich, Y., Fisch, G., and Gatti, L. V.: Overview of the inorganic and organic composition of size-segregated aerosol in Rondˆonia, Brazil, from the biomass
burning period to the onset of the wet season, J. Geophys. Res., accepted, 2006.
Gao, S., Hegg, D. A., Hobbs, P. V., Kirchstetter, T. W., Magi, B. I., and Sadilek, M.: Water-soluble organic components in aerosols associated with savanna fires in southern Africa: Identi-fication, evolution, and distribution, J. Geophys. Res., 108, 8491, doi:10.1029/2002JD002324, 2003.
Graham, B., Mayol-Bracero, O. L., Guyon, P., Roberts, G., Dece-sari, S., Facchini, M. C., Artaxo, P., Maenhaut, W., Koll, P., and Andreae, M. O.: Water-soluble organic compounds in biomass burning aerosols over Amazonia, 1. Characteri-zation by NMR and GC-MS. J. Geophys. Res., 107, 8047, doi:10,1029/2001JD000336, 2002.
Graham, B., Guyon, P., Taylor, P. E., Artaxo, P., Maenhaut, W., Glovsky, M. M., Flagan, R. C., and Andreae, M. O.: Organic compounds present in the natural Amazonian aerosol: Character-ization by gas chromatography-mass spectrometry, J. Geophys. Res., 108(D24), 4766, doi:10.1029/2003JD003990, 2003. Hoffer, A., Gelencs´er, A., Blazs´o, M., Guyon, P., Artaxo, P., and
Andreae, M. O.: Chemical transformation in organic aerosol from biomass burning, Atmos. Chem. Phys. Discuss., 5, 8027– 8054, 2005.
Knicker, H., Almendros, G., Gonzales-Vila, F. J., Martin, F. and Ludemann, H. D.: 13C and15N-NMR spectroscopic examina-tion of the transformaexamina-tion of organic nitrogen in plant biomass during thermal treatment, Soil Biol. Biochem., 28, 1053–1060, 1996.
Maria, S. F., Russell, L. M., Turpin, B. J., Porcja, R. J., Cam-pos, T. L., Weber, R. J., and Huebert, B. J.: Source signatures of carbon monoxide and organic functional groups in Asian Pa-cific Regional Aerosol Characterization Experiment (ACE-Asia) submicron aerosol types, J. Geophys. Res., 108(D23), 8637, doi:10.10129/2003JD003703, 2003.
Matta, E., Facchini, M. C., Decesari, S., Mircea, M., Cavalli, F., Fuzzi, S., Putaud, J-.P, and Dell’Acqua, A.: Mass closure on the chemical species in size-segregated atmospheric aerosol col-lected in a urban area of the Po Valley, Italy, Atmos. Chem. Phys., 3, 623–637, 2003.
Noyes, T. I. and Leenheer, J. A.: Proton nuclear-magnetic-resonance studies of fulvic acid from the Suwannee River, in: “Humic substances in the Suwannee River, Georgia: Interaction, properties, and proposed structures”, edited by: Averett, R. C., Leenheer, J. A., McKnight, D. M., and Thorn, K. A., USGS Report 87–557, U.S. Geological Survey, Denver, CO, 235–254, 1989.
Reid, J. S., Koppmann, R., Eck, T. F., and Eleuterio, D. P.: A re-view of biomass burning emissions, part II: Intensive physical properties of biomass burning particles, Atmos. Chem. Phys., 5, 799–825, 2005.
Rissler, J., Vestin, A., Swietlicki, E., Fisch, G., Zhou, J., Artaxo, P. and Andreae, M. O.: Size distribution and hygroscopic prop-erties of aerosol particles from Amazonian dry season biomass burning, Atmos. Chem. Phys., 6, 471–491, 2006.