DOI: 10.5562/cca2704
Narrowband NIR-Induced
In Situ
Generation of the
High-Energy
Trans
Conformer of Trichloroacetic
Acid Isolated in Solid Nitrogen and its Spontaneous
Decay by Tunneling to the Low-Energy
Cis
Conformer
R. F. G. Apóstolo,1 R. R. F. Bento,1,2 R. Fausto1,*
1 Department of Chemistry, University of Coimbra, P 3004−535, Coimbra, Portugal 2 Instituto de Física, Universidade Federal de Mato Grosso, 78060-900, Cuiabá, Brazil * Corresponding author’s e-mail address: rfausto@ci.uc.pt
RECEIVED: July 20, 2015 REVISED: October 8, 2015 ACCEPTED: October 10, 2015
THIS PAPER IS DEDICATED TO DR.SVETOZAR MUSIĆ ON THE OCCASION OF HIS 70TH BIRTHDAY
Abstract: The monomeric form of trichloroacetic acid (CCl3COOH; TCA) was isolated in a cryogenic nitrogen matrix (15 K) and the higher energy
trans conformer (O=C–O–H dihedral: 180°) was generated in situ by narrowband near-infrared selective excitation the 1st OH stretching
overtone of the low-energy cis conformer (O=C–O–H dihedral: 0°). The spontaneous decay, by tunneling, of the generated high-energy conformer into the cis form was then evaluated and compared with those observed previously for the trans conformers of acetic and formic acids in identical experimental conditions. The much faster decay of the high-energy conformer ofTCA compared to both formic and acetic acids (by ~35 and ca. 25 times, respectively) was found to correlate well with the lower energy barrier for the trans→cis isomerization in the studied compound. The experimental studies received support from quantum chemistry calculations undertaken at the DFT(B3LYP)/cc-pVDZ level of approximation, which allowed a detailed characterization of the potential energy surface of the molecule and the detailed assignment of the infrared spectra of the two conformers.
Keywords: trichloroacetic acid, NIR-induced in situ generation of the higher energy trans-TCA conformer, spontaneous decay by tunneling, matrix-isolation infrared spectroscopy, quantum chemical calculations.
1. INTRODUCTION
HE first report on an infrared-induced conformational isomerization in a cryomatrix was presented by Hall and Pimentel in 1963.[1] That work considered the
isomer-ization of HONO upon broadband infrared excitation. However, the generalization of the technique was initially severely conditioned by the usual similarity between the vibrational spectra of different conformers. It was only ca.
40 years later that the technique evolved to an extremely effective and elegant strategy for optically controlling the populations of different conformers of a molecule. For that, the use of narrowband tuneable lasers as excitation source
was introduced.[2–4] It is now possible to choose the
vibrational mode used to excite the targeted precursor conformer in a very selective way,[2–8] and since then many
successful examples of application of the technique have been reported.[2–12] In several cases, the application of the
method aims to generate high-energy rare conformers otherwise inaccessible to experiment.[2–6,8–12]
A conformational isomerisation occurs when enough energy is deposited into the reaction coordinate, so that the system can overcome the energy barrier and pass into the products valley. The reaction coordinate for internal rotation around a single bond connecting two conformers is essentially described by the torsion about that bond. In
Croat. Chem. Acta2015, 88(4), 377–386 DOI: 10.5562/cca2704
general, its direct excitation above the barrier is not feasible because its absorption cross section is very low. Alternatively, energy is introduced in the molecule by excitation of a different higher-energy vibration with appreciable absorption cross section.[2–12] This energy is
then partially transferred to the reaction coordinate through a cascade relaxation mechanism involving partic-ipation of matrix phonons.
The paradigmatic systems studied by this approach are carboxylic acids, because the COOH group has two minimum energy conformations which can be inter-converted very effectively by excitation of the corres-ponding OH stretching mode.[2–4,7–11] Formic and acetic
acids have been studied in detail in various matrix-media.
[2–4,7,9,13–16] Together with additional studies on other
molecules, these investigations allowed to reach some general conclusions: i) in general, once formed, the high-energy conformer of the carboxylic acids convert back spontaneously to the more stable form by tunnelling, even at cryogenic temperatures, in time scales that vary from a few seconds to several hours;[7,8,13–16]ii) the stability of the
higher-energy forms depends upon several factors, the dominant one appearing to be the height/wideness of the energy barrier separating the higher energy form from the lower energy one;[3,7,14] iii) specific interactions with the
matrix material affect also the stability of the higher-energy form, which has been found to be greater in solid N2 and
CO2 than in rare gases;[7,8,14,15]iv) differences in the matrix
microenvironments also influence the life-time of the higher-energy conformer, even if they appear spectros-copically indistinguishable, leading to decay rates that very often obey to a dispersive-type kinetics instead of following a single exponential behaviour.[5–12]
The present study focuses on trichoroacetic acid (Cl3CCOOH; TCA), which differs from acetic acid by
replace-ment of the methyl group by the strongly electron-attractor trichloromethyl moiety. Such structural modification can be expected to lead to a reduction of the double bond char-acter of the carboxylic C–O bond, implying a lower energy barrier for the trans→cis conformational isomerization in
TCA, and reducing the stability of the higher-energy trans
conformer (O=C–O–H dihedral angle: 180°; see Figure 1) once it is generated in a suitable matrix media using the strategy presented above. As described in detail in the next sections, monomers of TCA were isolated in a nitrogen ma-trix (15 K) and the higher-energy trans conformer was gen-erated in situ by narrowband near-infrared selective excitation the 1st OH stretching overtone of the
lower-en-ergy cis conformer. Subsequently, the spontaneous
trans-TCA→cis-TCA decay was investigated and compared with data previously obtained for acetic and formic acids.[2,7,14]
The experimental results were enlightened by the com-prehensive characterization of the potential energy surface of the molecule and the detailed assignment of the infrared spectra of the two conformers undertaken by quantum chemistry calculations. This is the first reported doubtless experimental observation of the trans-TCA conformer hitherto.
2. EXPERIMENTAL AND
COMPUTATIONAL METHODS
Trichloroacetic acid was obtained from Sigma, purity > 99 %. Before use, the compound was dried by the standard freeze-pump-thaw method. For matrix preparation, the solid sample was placed in a specially designed Knudsen cell with shut-off possibility and its vapors (at room tempera-ture) were co-deposited with a large excess of the matrix gas (N2; 99.999 %) onto the cold CsI substrate (T = 15 K) of
the cryostat (APD Cryogenics DE-202A closed-cycle helium refrigerator).
The infrared spectra were recorded, with 0.5 cm–1
spectral resolution, in a Thermo Nicolet™ 6700 Fourier transform infrared spectrometer, equipped with a deuter-ated triglycine sulphate (DTGS) detector and a KBr beam splitter for studies in the mid-infrared range and with a CaF2
beam splitter and an InGaAs detector for near-infrared. The sample compartment of the spectrometer was modified in order to accommodate the cryostat head and allow purging of the instrument by a stream of dry, CO2 exempted air.
Vibrational excitation of the low-energy conformer of TCA initially present in the matrices was undertaken in situ, through the KBr windows of the cryostat, using the idle beam of the Spectra Physics Quanta-Ray® optical paramet-ric oscillator (MOPO-SL) pumped by a Nd:YAG laser (Spectra Physics Quanta-Ray® PRO-230-10). The near-infrared beam has a bandwidth of ~0.2 cm–1, pulse frequency of 10 Hz and
energy of ~10 mJ.
The quantum chemical calculations were performed using the Gaussian 09 program package[17] at the DFT level
of theory, using the Dunning’s correlation consistent cc-PVDZ basis set[18,19] and the three-parameter hybrid density
DOI: 10.5562/cca2704 Croat. Chem. Acta2015, 88(4), 377–386
functional abbreviated as B3LYP.[20–22] Relaxed potential
energy scans were performed at the same level of theory, and the transition state structure for the trans-TCA↔cis -TCA isomerization located using the synchronous transit-guided quasi-Newton (STQN) method.[23,24] The
B3LYP/cc-PVDZ calculated vibrational frequencies and infrared inten-sities were used to assist the analysis of the experimental spectra. The computed harmonic wavenumbers were cor-rected by applying the simple linear transformation νcorr =
0.932 νcalc + 67.5 cm–1, which was obtained by fitting the
calculated wavenumbers to the experimentally observed infrared bands of both cis-TCA and trans-TCA conformers. This correction accounts mainly for the effects of basis set limitations, neglected part of electron correlation and an-harmonicity effects. Normal coordinate analysis was under-taken in the symmetry internal coordinates space, accor-ding to the recommendations of Pulay et al.,[25] as
de-scribed by Schachtschneider and Mortimer,[26] using the
optimized geometries and harmonic force constants result-ing from the DFT(B3LYP)/cc-PVDZ calculations. For the pur-pose of modeling infrared spectra, the calculated frequen-cies, together with the calculated infrared intensities, served to simulate the spectra shown in the figures by convoluting each peak with a Lorentzian function with a full-width-at-half-maximum of 2 cm–1.
3. RESULTS AND DISCUSSION
3.1 Potential Energy Landscape of TCA
Trichloroacetic acid is a structurally simple compound, which receives substantial uses, in particular as protein pre-cipitant in clinical chemistry[27] and as a caustic forremov-ing wart.[28–32] Nevertheless, its structure and vibrational
spectra have been very scarcely addressed. A molecular mechanics and vibrational spectroscopy study has been re-ported by Fausto and Teixeira-Dias, almost 20 years ago,[33]
where the infrared and Raman spectra of TCA in the crys-talline and liquid states were assigned and the calculated structures for the two conformers of the compound, as iso-lated species, were predicted. The two calcuiso-lated minima correspond to the cis and trans conformers about the car-boxylic C–O bond, both forms showing the trichloromethyl group oriented in such a way that one of the chlorine atoms eclipses the carbonyl oxygen atom. The molecular mechan-ics calculations predicted the cis form more stable than the
trans conformer by 36.2 kJ mol–1, with a cis→trans energy
barrier of 51.8 kJ mol–1. As it will be shown below, these
values are both overestimated, in particular that for the en-ergy difference between the conformers. The barrier for in-ternal rotation of the trichloromethyl group in the cis
conformer was also estimated and a value of 3.4 kJ mol–1
suggested, which is somewhat lower than that resulting from the calculations carried out in the present study, as described in detail below. The infrared spectrum of anhy-drous solid TCA was addressed by Adams and Kim,[34] in an
attempt to correlate this spectrum with a former structural study of the compound by neutron diffraction.[35] TCA was
also investigated before theoretically (using the old CNDO/2 semi-empirical method) and in gas phase (by infra-red spectroscopy) by Panichkina, Bilobrov and Titov.[36] In
that study, the cis→trans energy barrier was calculated as ~20 kJ mol–1, and the trans conformer suggested to have its
trichloromethyl group oriented the opposite way as com-pared to that in the cis conformer, i.e., exhibiting one of the chlorine atoms eclipsed with the acid oxygen atom. The CNDO/2 estimated energy difference between the two con-formers was ~2.5 kJ mol–1.[36] As shown below, the CNDO/2
predicted geometry for the trans-TCA conformer as well as both the trans – cis energy difference and cis→trans energy barrier are incorrect.
In the present study, the potential energy surface of TCA was investigated at the DFT(B3LYP)/cc-PVDZ level of theory. The calculations reveal that both cis- and trans-TCA conformers have the trichloromethyl group in the same ori-entation with respect to the acid group, with one of the chlorine atoms eclipsing the carbonyl oxygen atom (see Fig-ure 1). Both structFig-ures exhibit a plane of symmetry, belong-ing to the Cs point group. The optimized geometrical parameters for the optimized structures of the two con-formers are provided in the Supporting Information Table S1. The potential energy profiles for internal rotation about the C–O bond, interconverting the conformers into each other, and those corresponding to rotation of the trichloro-methyl group in the two conformers are shown in Figure 2. The B3LYP/cc-PVDZ calculations predict the energy of the
cis conformer to be lower than that of the trans conformer by 10.74 kJ mol–1 (9.82 kJ mol–1 after inclusion of the
zero-point correction), and a cis→trans energy barrier of 41.7 kJ mol–1 (31.0 kJ mol–1 in the reverse direction). Noteworthy,
at room temperature (298.15 K) the Gibbs energy differ-ence between the conformers was estimated by the calcu-lations as being only 5.38 k J mol–1, suggesting that entropic
effects stabilize considerably the trans conformer. This re-sult is in agreement with the very low C–C torsional fre-quency calculated for the trans-TCA conformer (predicted as low as 6.2 cm–1, that shall be compared with a frequency
of 37.4 cm–1 for the same mode in the cis conformer), which
Croat. Chem. Acta2015, 88(4), 377–386 DOI: 10.5562/cca2704
In the transition state for conformational isomeriza-tion (see Figure 2), the hydrogen atom is almost perpendic-ularly oriented in relation to the CC(=O)O plane (O=C–O–H dihedral: 91.3°). The transition states for internal rotation of the trichloromethyl group correspond to the Cs sym-metry structures bearing one of the chlorine atoms eclips-ing the acid oxygen atom, defineclips-ing 3-fold energy barriers of 5.34 and 2.30 kJ mol–1 in cis- and trans-TCA, respectively. As
expected, the energy barrier in the trans conformer is sig-nificantly lower than in the cis form, mostly due to the ste-ric hindrance in the minimum energy trans structure resulting from the proximity of the OH and trichloromethyl groups.
3.2 Infrared Spectrum of TCA Isolated in
N
2matrix (15 K)
During the deposition of the matrices, the gaseous TCA:ar-gon beam (in ~1:1000 ratio) being deposited was kept at room temperature (RT = 298.15 K), while the temperature of the cold CsI substrate of the cryostat was 15 K. The pre-dicted populations of the cis- and trans-TCA conformers in the gas phase equilibrium at RT, based on their calculated Gibbs energy difference (5.38 k J mol–1), are 90 % and 10 %,
respectively. As already mentioned, the results of the pre-sent calculations differ considerably from those previously reported,[33,36] obtained at lower theoretical levels, where
the relative energy of the two conformers was predicted to be either much higher (36.2 kJ mol–1),[33] suggesting a
neg-ligible population of the trans-TCA conformer in the RT gas phase, or much smaller (~2.5 kJ mol–1),[36] so that the
pop-ulation of the trans conformer should be expected to be about 25 %.
Figure 3 shows the infrared spectrum of the as-de-posited TCA N2-matrix. The experimental spectrum is
com-pared with the calculated spectrum of the cis conformer. It is clear from this Figure that the experimental spectrum is nicely reproduced by the calculated one, indicating that it
contains essentially the vibrational signature of the most stable cis-TCA conformer. Nevertheless, low intensity bands are also observed that have no counterparts in the theoretical spectra of cis-TCA and that are ascribable to the
trans conformer. Examples of these bands are the doublets at 1817.5/1813.1 and 1318.2/1291.0 cm–1 and the
multi-plet at ~926 cm–1, which fit well some of the most intense
predicted infrared bands of trans-TCA (νC=O: 1835.1 cm–1;
δCOH: 1311.0 cm–1; νC–C: 926.7 cm–1). The full
identifica-tion of the vibraidentifica-tional signature of the trans conformer has been facilitated by the near-infrared irradiation experi-ments described in the next section. However, the obser-vation of the bands of this conformer in the spectrum of the as-deposited matrices is in agreement with the presence of this form in the RT gaseous beam used to prepare the sam-ples. In that sense, the present results are in agreement with the previous suggestion by Panichkina, Bilobrov and Titov,[36] who have interpreted the observed νC=O splitting
in the gas phase infrared spectrum of TCA as due to the presence of two conformers of the compound (though as mentioned above they failed in assigning the right structure of the higher energy trans-TCA conformer), and also with some previous studies on the compound in diluted CCl4
so-lutions.[37,38] It shall also be pointed out here, however, that
until now the suggested experimental detection of the
trans-TCA conformer has been rather controversial.[36,39]
Taking into account the calculated relative intensi-ties of the infrared bands of the two conformers, the pop-ulations of cis- and trans-TCA present in the spectrum of the as-deposited N2 matrices, estimated from the observed
intensities, are ca. 95 % and 5 %, respectively. Compared to the predicted relative populations (90 % vs. 10 %) these val-ues are shifted towards the most stable cis conformer. The reason for such population shift will be presented in Section 3.4.
Another characteristics of the infrared spectrum of matrix isolated TCA is that several bands exhibit a multiplet
Figure 2. B3LYP/cc-PVDZ calculated potential energy profiles for internal rotations about the C–O (left) and C–C (middle and right) bonds in trichloroacetic acid. The first graph corresponds to the isomerization coordinate and the two last plots to the internal rotation of the CCl3 group in the cis- and trans-TCA conformers, respectively. The inserted structure corresponds to the transition state between the two conformers.
0 30 60 90 120 150 180
0 10 20 30 40 50 R el at iv e en er gy / k J m ol -1 O=C-O-H/ degrees B3LYP/cc-PVDZ
0 30 60 90 120 150 180 0 1 2 3 4 5 6 R el ati ve ener gy / k J m ol -1 Cl-C-C=O/ degrees B3LYP/cc-PVDZ cis-TCA
DOI: 10.5562/cca2704 Croat. Chem. Acta2015, 88(4), 377–386
structure. This multiplet structure appears very clearly in the case of the most intense bands, which are related with vibrations implying a larger variation of the dipole moment and, then, that are more sensitive to the local environment (see Figure 2). The assignment of the spectrum of cis-TCA is given in Table 1, where the calculated infrared spectrum of this form is also shown, together with the results of the per-formed normal coordinate analysis. The definition of the used symmetry coordinates are provided in Table S2 (Sup-porting Information).
Considering the good agreement between the ex-perimental and calculated spectra, most of the assignments are straightforward. The multiplet observed in the νOH stretching region (centered at ~3528 cm–1) is a good
exam-ple of a band exhibiting extensive matrix site-splitting. As it could be expected, the average wavenumber of the νOH stretching vibration in cis-TCA is considerably lower than that of the same vibration in cis-acetic acid (cis-AA) isolated in N2 (~3549 cm–1),[14] due to the considerably stronger acid
character of TCA. On the other hand, the νC=O stretching
mode is observed at higher frequency in TCA (main bands at 1796.5 and 1793.7 cm–1) than in acetic acid (1779.0 and
1775.7 cm–1).[14] This result correlates with the stronger
C=O bond in TCA compared with acetic acid (120.00 vs.
120.87 pm; B3LYP/cc-PVDZ calculated data). The two modes predominantly related with the νC–O and δCOH co-ordinates are observed in cis-TCA at 1350.1/1344.8 cm–1
and in the 1162–1151 cm–1 range, the lower wavenumber
mode having a larger contribution from the νC–O coordi-nate (see Table 1). In cis-AA, these modes are observed around 1285 cm–1 and in the 1206–1177 cm–1 region,[14]
with the lower frequency mode absorbing at slightly higher values in relation TCA in agreement with the expectations. The νC–C vibration is observed in cis-TCA around 940 cm–1
and in cis-AA near 855 cm–1.[14] Since the C–C bond is longer
in TCA than in acetic acid (155.70 vs. 150.72 pm; B3LYP/cc-PVDZ calculated values), the larger νC–C stretching fre-quency in cis-TCA is an indication that the elongation of the C–C bond in TCA results mostly from through-space repul-sion between the negatively charged substituents at the Figure 3. Infrared spectrum of TCA isolated in N2 matrix at 15 K (top) and B3LYP/cc-PVDZ calculated infrared spectrum of cis -TCA (bottom). Bands in the calculated spectrum are simulated by a Lorentzian function centered at the calculated (scaled) wavenumber and with a full-width-at-half-band equal to 2 cm–1, with calculated intensities corresponding to the area under the function. In the experimental spectrum, the most prominent bands due to conformer trans are indicated by the arrows.
3600 3200 2000 1800 1600 1400 1200 1000 800
600
0.0
0.1
0.2
0.3
3600 3200 2000 1800 1600 1400 1200 1000 800
600
0
20
40
60
80
100
Abs
or
banc
e
Experimental (N2 matrix; 15 K)
R
el
at
iv
e
IR
Int
ens
ity
Wavenumber/ cm
-1Croat. Chem. Acta2015, 88(4), 377–386 DOI: 10.5562/cca2704
carbon atoms forming the bond (the three chlorine atoms at one carbon and the two oxygen atoms at the second one), while the polarization of the C–C bond is smaller, leading to an effective larger electron density of the bond. Also, the two bending modes associated with the carboxylic group, γC=O and δOCO, give rise to bands appearing at higher wavenumbers in cis-CA (in the 865–855 cm–1 range
and at 658.2/657.3 cm–1) than in cis-AA (in the 554–550
and 588–585 cm–1 ranges, respectively). These shifts to
higher wavenumbers in TCA result mainly from the cou-pling of the γC=O and δOCO coordinates with the νCCl3
stretching coordinates (see Table 1). On the other hand, the
τCOH torsion appears at lower frequency in cis-TCA (as a multiplet between 591.1 and 554.6 cm–1) than in cis-AA
(be-tween 663.2 and 654.6 cm–1),[14] because of the
considera-bly shallow torsional potential in TCA compared to acetic acid (see previous section), which implies a lower torsional force constant in the presently studied molecule.
The stretching vibrations of the trichloromethyl group for cis-TCA are predicted at 834.1, 706.4 (anti-sym-metric modes) and 464.3 cm–1 (symmetric mode). The
anti-symmetric modes are observed around 850 and 700 cm–1,
in good agreement with the theoretical values, while the symmetric vibration is of very low intensity (1.7 km mol–1;
see Table 1) and could not be observed (this is mainly due to the fact that below 500 cm–1 the registered spectra show
a higher noise, since the spectrometer beam has to go through the two external KBr windows of the cryostat, plus
the CsI of the cold substrate, which considerably reduces transmittance in this spectral region). The observed νCCl3
anti-symmetric stretching modes give rise to extensively splitted bands (see Table 1). We have performed vibra-tional calculations on all 35Cl/37Cl isotopologues of the
com-pound and found out that the maximum frequency shifts due to different chlorine isotopic substitution are smaller than 2 cm–1 for both νCCl3 anti-symmetric stretching modes
(9 cm–1 in the case of the non-observed νCCl3 symmetric
stretching mode). Hence, the extensive splitting observed for bands due to the νCCl3 anti-symmetric stretching
vibra-tions (which spread over more than 10 and 5 cm–1 for the
A’ and A” symmetry modes, respectively; see Table 1) cannot be ascribed to the co-existence of different isotopo-logues of the molecule, and shall be ascribed mostly to matrix-site effects (in the case of the A” mode, reinforced by an extensive coupling with the τCOH torsional coordi-nate; Table 1).
3.3 Narrowband NIR-Induced
Genera-tion of
trans
-TCA
Near-infrared radiation, tunned at the frequency of the first
νOH overtone of cis-TCA, was used to vibrationally excite this conformer. In the near-infrared range, the band cor-responding to the 2νOH overtone of cis-TCA is observed between 6905.4 and 6897.1 cm–1, with maximum at
6898.5 cm–1. Irradiation of the matrix isolated cis-TCA at
this latter wavenumber resulted in its conversion into the Table 1. Assignment of the observed infrared spectrum (3600–450 cm–1 range) of cis-TCA conformer, and B3LYP/cc-PVDZ calculated infrared wavenumbers and infrared intensities and results of normal coordinate analysis for this conformer.(a)
Observed ν/cm–1
Calculated(b) Approximate
description PED(c) /% ν/cm–1 IIR/km mol–1
3534.8/3530.6sh/3529.4/3526.6sh/3525.9/3522.6/3521.0 3525.6 99.7 νOH A’ S1(100)
1796.5/1795.9sh/1794.6sh/1793.7 1802.6 246.5 νC=O A’ S2(89)
1350.1/1344.8 1345.0 48.3 δCOH, νC–O A’ S8(44) + S3(28) + S9(16)
1162.0/1160.4sh/1158.6/1155.9sh/1151.2/1149.8sh/1147.5 1170.0 191.2 νC–O, δCOH A’ S8(43) + S3(41)
941.6/940.8/939.2/937.3 943.6 12.9 νCC A’ S4(48) + S3(17) + S13(17) +S7(13)
868–832(d) with main maxima at: 865.1/855.9
and at: 845.9/833.7 834.9 834.1 186.2 38.9 γνC=OCCl3 as’
A” S14(53) + S16(20) + S6(15)
A’ S5(53) + S10(16) + S15(15) + S11(11)
700.5/699.1sh/697.5sh/696.5/695.7sh/694.9/692.8sh 706.4 229.4 νCCl3 as” A” S6(53) + S17(32) + S14(11)
658.2/657.3 674.5 95.4 δOCO A’ S9(61) + S7(10)
591.1/583.4/579.0/569.8/566.9 /554.6 584.1 22.8 τCOH A” S17(64) + S14(19) + S6(17)
not observed 464.3 1.7 νCCl3 s A’ S7(77) + S4(14)
not observed 452.6 0.6 δCCO A’ S10(39) + S5(34) + S9(10)
(a) Wavenumbers (ν/cm–1), calculated infrared intensities (IIR/km mol–1). (b) Wavenumbers corrected according to the equation ν
corr = 0.932 νcalc + 67.5 cm–1; for non-corrected wavenumbers (full spectral range) see Table S3 in the Supporting Information.
(c) See Table S2 (Supporting Information) for definition of symmetry coordinates; only PED values equal or larger to 10 % are shown. (d) The assignment of specific bands to the γC=O and νCCl
DOI: 10.5562/cca2704 Croat. Chem. Acta2015, 88(4), 377–386
higher-energy trans conformer. The results are summarized in Figure 4, where the difference spectrum (spectrum obtained after irradiation at 6898.5 cm–1 during
45 min. minus spectrum of the as-deposited matrix) is compared with the simulated difference spectrum (trans -TCA minus cis-TCA) obtained from the B3LYP/cc-PVDZ calculations. The occurrence of the isomerization reaction is doubtless, with the emerging spectrum fitting very well the calculated one for the trans conformer. Assignments for this form are given in Table 2, where the results of the performed normal coordinate analysis are also presented. Following the general trend,[2,3,8,14] both the νOH and νC=O
stretching vibrations in trans-TCA appear shifted to higher frequencies when compared to those of the cis-TCA form. The average shifts are both ca. 20 cm–1, what contrasts with
what was found in acetic acid, where the corresponding
νOH and νC=O shifts are of ca. 60 and 20 cm–1, respectively.
The smaller νOH shift observed for TCA results from the fact that in this molecule the OH group is oriented towards elec-tronegative groups in both conformers, whereas in acetic acid it is oriented towards an electronegative one in the case of the cis form but points to the electropositive methyl group in the trans conformer. The different prevalent charges in the two conformers of acetic acid in the vicinity of the OH group lead to considerably diverse polarization-induced changes in the OH bond of the two conformers, thus making their associated νOH vibrational frequencies considerably more dissimilar than in the two TCA forms. Figure 4. Infrared difference spectrum obtained by
subtracting the spectrum of the as-deposited TCA N2-matrix from the spectrum obtained after near-infrared irradiation at 6898.5 cm–1 (2νOH cis-TCA) during 45 min. (top) and simulated difference spectrum built based on the B3LYP/cc-PVDZ calculated infrared spectra of trans-TCA (bands pointing up) and cis-TCA (bands pointing down) (bottom). Bands in the calculated spectrum are simulated by a Lorentzian function centered at the calculated (scaled) wavenumber and with a full-width-at-half-band equal to 2 cm–1, with calculated intensities corresponding to the area under the function; the calculated difference spectrum was normalized to the most intense band.
3600 3200 2000 1800 1600 1400 1200 1000 800 600
-1.0 -0.5 0.0 0.5 1.0
3600 3200 2000 1800 1600 1400 1200 1000 800 600
-1.0 -0.5 0.0 0.5 1.0
Ab
so
rb
an
ce
x
1
0 Experimental
(irradiated at 6898.5 cm-1minus as-deposited N 2 matrix; 15 K)
R
ela
tiv
e
IR
In
te
ns
ity
Wavenumber/ cm-1
Calculated (trans-TCA minuscis-TCA) B3LYP/cc-PVDZ
Table 2. Assignment of the observed infrared spectrum (3600–450 cm–1 range) of trans-TCA conformer, and B3LYP/cc-PVDZ calculated infrared wavenumbers and infrared intensities and results of normal coordinate analysis for this conformer.(a)
Observed ν/cm–1
Calculated(b) Approximate
description PED(c) /% ν/cm–1 IIR /km mol–1
3553.3/3549.8/3545.1/3544.0sh/3540.8/3538.0/3534.8 3534.8 71.1 νOH A’ S1(100)
1817.5/1816.2sh/1813.9sh/1813.1 1835.1 220.8 νC=O A’ S2(88)
1318.2/1300.3/1291.0/1288.5sh/1283.0(d) 1311.0 377.4 δCOH A’ S8(64) + S3(19)
1187.4/1180.2/1178.2 1181.3 11.8 νC–O A’ S3(51) + S8(29)
926.8/925.5/924.9/923.9 926.7 46.8 νCC A’ S4(46) + S3(15) + S13(15) + S7(13)
872.8/871.4/870.7 846.6 128.5 νCCl3 as’ A’ S5(49) + S10(15) + S15(14)
828.5/825.6 825.4 74.3 γC=O A” S14(52) + S16(20) + S6(13)
685.4/684.1 700.0 29.3 δOCO A’ S9(66) + S7(10)
669.5 663.2 133.7 νCCl3 as” A” S6(68) + S14(23)
484.8 484.8 62.1 τCOH A” S17(87) + S14(10)
not observed 461.2 8.9 νCCl3 s A’ S7(39) + S9(15) + S5(15) + S10(12)
not observed 455.4 12.4 δCCO, νCCl3 s A’ S7(35) + S10(28) + S5(22)
(a) Wavenumbers (ν/cm–1), calculated infrared intensities (IIR/km mol–1). (b) Wavenumbers corrected according to the equation ν
corr = 0.932 νcalc + 67.5 cm–1; for non-corrected wavenumbers (full spectral range) see Table S3 in the Supporting Information.
Croat. Chem. Acta2015, 88(4), 377–386 DOI: 10.5562/cca2704
The situation is distinct in the case of the carbonyl group, which shows identical vicinities in the analogous conform-ers of the two molecules.
An interesting observation is that in trans-TCA the degree of mixing of the νC–O and δCOH coordinates in the two vi-brations with predominant contributions from these oscil-lators is much smaller than in cis-TCA, with the higher-frequency mode having a dominant contribution from
δCOH and the lower frequency one a major contribution from νC–O (see Table 2). This trend has already been no-ticed in the case of acetic acid.[14] Also as in trans-AA, the
δCOH mode in trans-TCA is involved in a Fermi resonance interaction with a combination tone (τCOH + γC=O), thus appearing as a characteristic Fermi doublet around 1318.2 and 1291.0 cm–1 (with some low-intensity satellite bands
due to matrix-site splitting).
The relative frequencies of the νC–C mode in trans
and cis-TCA (~925 vs. 940 cm–1, respectively) correlate well
with the corresponding B3LYP/cc-PVDZ calculated bond lengths (156.87 and 155.70 pm, respectively). The γC=O vi-bration is observed at nearly the same frequency in both conformers. On the other hand, the δOCO bending mode increases its frequency by ca. 30 cm–1 (see Tables 1 and 2)
when going from cis-TCA to trans-TCA. Such shift is much probably determined by the significant changes in the an-gles of the C(=O)O fragment upon isomerization (O=C–O/C– C=O/C–C–O: 125.48/124.07/110.45° in cis-TCA, vs.
123.02/122.42/114.56° in trans-TCA; see Table S1). Fi-nally, as expected taking into account the much flat poten-tial associated with the torsion around the C–O bond in the vicinity of the trans conformation (see Figure 2), the τCOH torsion absorbs at much lower frequency in the trans-TCA conformer (484.8 cm–1) than in the cis-TCA form (between
591.1 and 554.6 cm–1).
An additional note shall be made in relation to the stretching vibrations of the trichloromethyl group. While the A’ symmetry νCCl3 anti-symmetric stretching is
ob-served at nearly the same frequency in both conformers of TCA, the A” mode absorbs at a significantly lower frequency in the trans-TCA conformer (669.5 cm–1, vs. about 700 cm–1
in the cis conformer). Also, interestingly, this mode gives rise to an essentially single band in the trans conformer, while in the cis form it is observed as a complex multiplet of bands. The fact that the vibration is substantially coupled with the τCOH torsional coordinate in cis-TCA while it does not mix with this coordinate in the trans conformer may be in the origin of these observations.
3.4
Trans
-TCA
→
cis
-TCA Spontaneous
Decay, by Tunneling
Once the higher-energy trans-TCA conformer has been pro-duced by vibrational excitation of the cis conformer, the matrix was kept in the dark and its evolution with time was
monitored by recording its mid-infrared spectra periodi-cally. As found for other carboxylic acids[2,3,7–10,13–15] (and
also other molecules bearing the OH fragment)[5,6,11,12]
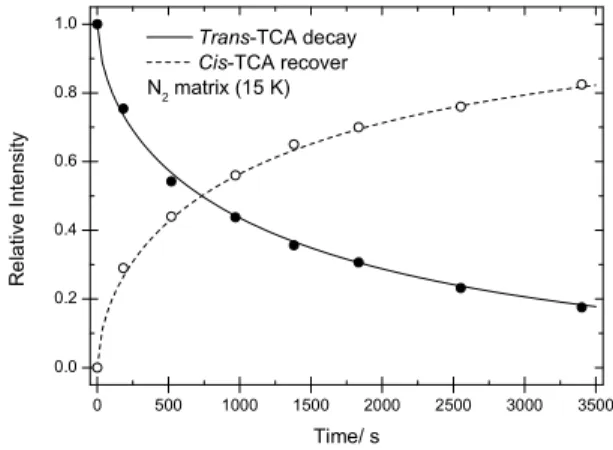
spontaneous conversion of trans-TCA into cis-TCA, by tun-neling, was observed, as noticed by the decrease of inten-sity of the bands ascribed to trans-TCA and simultaneous recover of bands due to the cis form. Figure 5 shows the evolution with time of the intensity of the νC=O stretching band of trans-TCA (1818–1812 cm–1 range), where the
in-tensity of the band in the last spectrum resulting from near-IR irradiation at 6898.5 cm–1 was normalized to unity. The
decay curve could be fitted by a stretching exponential function (see legend of Figure 5), indicating that the decay obeys a dispersive type kinetics, as found frequently for this type of processes,[12] and showing that the morphology of
the different matrix sites affects the decay rate of individual molecules.
The time required for reduction to half of the popu-lation initially generated of the trans-TCA conformer was ~720 s, which is substantially lower than those observed previously for both acetic and formic acids in N2 matrix
(~5 h and ca. 7 h, respectively).[14] The faster decay of trans
-AA compared to trans-FA has been explained[14] by the
lower trans→cis barrier in acetic acid (32.9 vs. 38.5 kJ mol–1
in formic acid; B3LYP/cc-PVDZ calculated values). Indeed, the barrier height seems to be the most important factor controlling the tunneling rate, though other factors, like
Figure 5. Decay of trans-TCA into cis-TCA in a nitrogen matrix at 15 K. The νC=O stretching bands of trans- and cis -TCA bands in the 1818–1812 and 1800–1785 cm–1 ranges were used to follow the trans→cis conversion. The fitting decay curve obeys to a dispersive type kinetics, y = exp(–atb),
with a = 0.0146 ± 0.0024 and b = 0.585 ± 0.022; R2 = 0.9968; the recovering curve for cis-TCA obeys the equation y = [1 – exp(–atb)], with a and b parameters made equal to those
fitted to the decay curve of the trans conformer; the relative intensities for cis-TCA were normalized in order to have the last point equal to the difference between the unity and the relative intensity of trans-TCA.
0 500 1000 1500 2000 2500 3000 3500
0.0 0.2 0.4 0.6 0.8 1.0 R el at iv e In te ns ity Time/ s
Trans-TCA decay
DOI: 10.5562/cca2704 Croat. Chem. Acta2015, 88(4), 377–386
nature and distribution of the vibrational energy levels involved in the tunneling process, may also play a role in determining the kinetics of the process.[14,40–42] The present
B3LYP/cc-PVDZ calculations estimated the trans→cis
barrier in TCA as being 31.0 kJ mol–1, i.e., lower than those
for acetic and formic acids. Accordingly, the observed decay of the high-energy conformer ofTCA is faster than for both formic and acetic acids by ~35 and ca. 25 times, respectively. The present results then give further support to the idea that the size of the barrier is the most relevant factor determining the tunneling decay rate of trans
carboxylic acid conformers into their lower-energy cis
counterparts.[14,40–42]
The fast decay observed for trans-TCA does also jus-tify two additional observations: firstly, the fact that no evidence of trapping of the trans-TCA conformer could be found upon deposition of the compound in argon and xenon matrices (it has been shown that the stability of
trans carboxylic acid conformers in noble gases is much smaller than in N2,[14,40–42] so that the trans-TCA molecules
existing in the gas phase equilibrium prior to deposition promptly convert into the more stable cis form in these matrices, precluding its spectroscopic detection); sec-ondly, the fact pointed out in Section 3.2 that the population of the trans-TCA conformer observed in the as-deposited N2 matrix was smaller than that predicted by
the calculations for the room temperature gas phase equilibrium, since this conformer could also convert partially into the more stable cis-TCA form during deposition (the cold substrate local temperature during deposition at the molecules landing point is somewhat higher than 15 K, because the gaseous beam is at a higher temperature and heat dissipation is not instantaneous, thus facilitating the trans-TCA to cis-TCA conversion; this local heating during deposition of a cryogenic matrix is the main factor responsible for changes in the trapped con-formational populations compared to those existing in the gas phase equilibrium prior to deposition in matrix isolation experiments, playing a role even in the cases where the isomerization has to take place via the over the barrier mechanism, in cases where the barrier is small,
i.e., of a few kJ mol–1).[11,43]
4. CONCLUSIONS
We were able to generate, for the first time, the higher-en-ergy conformer of trichloroacetic acid, through narrow-band selective near-infrared vibrational excitation of the more stable cis-TCAconformer, and measure its decay rate in a N2 cryomatrix, at 15 K. The half-life of the trans-TCA
conformer in a N2 matrix at 15 K (~720 s) was found to be
shorter than that of both trans-AA and trans-formic acid under identical experimental conditions by more than one
order of magnitude, in agreement with the lower
trans→cis energy barrier in TCA compared to acetic and formic acids. The experimental studies received support from quantum chemistry calculations undertaken at the DFT(B3LYP)/cc-pVDZ level of approximation, which allowed the first detailed characterization of the potential energy surface of the molecule and the detailed assignment of the infrared spectra of the two conformers.
Acknowledgements. The authors thank the Portuguese Scien-ce Foundation (FCT), Lisbon, Portugal, for funding the Coimbra Chemistry Centre (FCT project PEst-OE/QUI/UI0313/2014, which is supported in part also by FEDER – European Regional Development Fund, through the COMPETE Pro-gramme, Operational Programme for Competitiveness). R. R. F. Bento acknowledges the Scholarship from CAPES Foundation (Proc. no. BEX 2010/14-3).
Supplementary Information. Supporting information to the paper is enclosed to the electronic version of the article at: http://dx.doi.org/10.5562/cca2704. Table S1, with the B3LYP/cc-PVDZ optimized geometrical parameters for cis
and trans-TCA; Table S2, with the definition of the symmetry coordinates used in the normal coordinate analysis per-formed on both conformers of TCA; Table S3, with the B3LYP/cc-PVDZ calculated infrared spectra for cis and trans -TCA and results of normal coordinate analysis for both con-formers.
REFERENCES
[1] R. T. Hall, G. C. Pimentel, J. Chem. Phys.1963, 38, 1889.
[2] M. Pettersson, J. Lundell, L. Khriachtchev, M. Räsänen, J. Am. Chem. Soc.1997, 119, 11715. [3] E. M. S. Maçôas, L. Kriachtchev, M. Pettersson, R.
Fausto, M. Räsänen, J. Am. Chem. Soc.2003, 125, 16188.
[4] E. M. S. Maçôas, R. Fausto, M. Pettersson, L. Khriachtchev, M. Räsänen, J. Phys. Chem. A 2000,
104, 6956.
[5] L. Lapinski, M. J. Nowak, I. Reva, H. Rostkowska, R. Fausto, Phys. Chem. Chem. Phys.2010, 12, 9615. [6] C. M. Nunes, L. Lapinski, R. Fausto, I. Reva, J. Chem.
Phys.2013, 138, 125101.
[7] R. Fausto, L. Khriachtchev, P. Hamm, in: Physics and Chemistry at Low Temperatures, (Ed.: L. Khriachtchev), World Scientific 2010, Chap. 3. pp. 51–84.
Croat. Chem. Acta2015, 88(4), 377–386 DOI: 10.5562/cca2704
[10] I. Reva, C. M. Nunes, M. Biczysko, R. Fausto, J. Phys. Chem. A2015, 119, 2614.
[11] N. Kuş, A. Sharma, I. Peña, M. C. Bermudez, C. Cabezas, J. L. Alonso, R. Fausto, J. Chem. Phys.2013,
138, 144305.
[12] L. Lapinski, I. Reva, H. Rostkowska, R. Fausto, M. J. Nowak, J. Phys. Chem. B2014, 118, 2831.
[13] E. M. S. Maçôas, J. Lundell, M. Pettersson, L. Khriachtchev, R. Fausto, M. Räsänen, J. Mol. Spectrosc. 2003, 219, 70.
[14] S. Lopes, A. V. Domanskaya, R. Fausto, M. Räsänen, L. Khriachtchev, J. Chem. Phys. 2010, 133, 144507. [15] M. Tsuge, K. Marushkevich, M. Räsänen, L.
Khriachtchev, J. Phys. Chem. A2012, 116, 5305. [16] L. O. Paulson, D. T. Anderson, J. Lundell, K.
Marushkevich, M. Melavuori, L. Khriachtchev, J. Phys. Chem. A2011, 115, 13346.
[17] M. J. Frisch, G. W. Trucks, H. B. Schlegel, G. E. Scuseria, M. A. Robb, J. R. Cheeseman, G. Scalmani, V. Barone, B. Mennucci, G. A. Petersson, et al. Gaussian 09, Revision A.02; Gaussian, Inc.: Wallingford, CT, 2009.
[18] T. H. Dunning Jr.,J. Chem. Phys.1989, 90, 1007. [19] G. P. F. Wood, L. Radom, G. A. Petersson, E. C.
Barnes, M. J. Frisch, J. A. Montgomery Jr.,J. Chem. Phys.2006, 125,094106.
[20] A. D. Becke, Phys. Rev. A 1988, 38, 3098.
[21] C. Lee, W. Yang, R. G. Parr, Phys. Rev. B1988, 37, 785.
[22] S. H. Vosko, L. Wilk, M. Nusair, Can. J. Phys.1980, 58, 1200.
[23] C. Peng, H. B. Schlegel,Israel J. Chem.1993, 33, 449. [24] C. Peng, P. Y. Ayala, H. B. Schlegel, M. J. Frisch,J.
Comp. Chem 1996, 17, 49.
[25] P. Pulay, G. Fogarasi, F. Pang, J. E. Boggs, J. Am. Chem. Soc.1979, 101, 2550.
[26] J. H. Schachtschneider, F. S. Mortimer, Vibrational Analysis of Polyatomic Molecules. VI. FORTRAN IV Programs for Solving the Vibrational Secular Equation and for the Least-Squares Refinement of
Force Constants, Project No. 31450. Structural Interpretation of Spectra; Shell Development Co: Houston, TX, 1965.
[27] D. Rajalingam, C. Loftis, J. J. Xu, T. K. S. Kumar,
Protein Sci.2009, 18, 980.
[28] D. A. Hudson, R. U. Lechtape-Gruter, S. Afr. Med. J. 1990, 78, 748.
[29] A. Yug, J. E. Lane, M. S. Howard, D. E. Kent, Dermatol. Surg. 2006, 32, 985.
[30] P. S. Collins, The Chemical Peel, Clin. Dermatol.1987,
5, 57.
[31] P. S. Collins, J. Dermatol. Surg. Oncol.1989, 15, 933. [32] K. R. Beutner, M. V. Reitano, G. A. Richwald, D. J.
Wiley, Clin. Infect. Dis.1998, 27, 796.
[33] R. Fausto, J. J. C. Teixeira-Dias, J. Mol. Struct.1986,
144, 241.
[34] J. Adams, H. Kim, Spectrochim. Acta A1973, 29, 675. [35] P. Jönsson, W. Hamilton, J. Chem. Phys.1972, 56, 4433. [36] V. A. Panichkina, V. M. Bilobrov, E. V. Titov, Teoret.
Eksperiment. Khim. (Translated)1980, 16, 133. [37] E. V. Titov, V. M. Belobrov, Voprosy Stereokhimii
1971, 1, 145.
[38] E. V. Titov, S. I. Chekushin, V. E. Umanskii, V. M. Belobrov, Dokl. Akad. Nauk USSR B1972, 12, 1088. [39] I. S. Perelygin, A. M. Afanas’eva, Appearance of
Autoassociation of Halosubstituted Monocarboxylic Acids in the Absorption Spectra in the Region of the Stretching Vibrations of the Carbonyl Groups, in:
Intermolecular Interaction in Condensed Media [in Russian], Naukova Dumka, Kiev, 1974, pp. 103–106. [40] E. M. S. Maçôas, L. Khriachtchev, M. Pettersson, R. Fausto, M. Räsänen, Phys. Chem. Chem. Phys.2005,
7, 743.
[41] E. M. Maçôas, L. Khriachtchev, M. Pettersson, R. Fausto, M. Räsänen, J. Chem. Phys.2004, 121, 1331. [42] M. Pettersson, E. M. S. Maçôas, L. Khriachtchev, J. Lundell, R. Fausto, M. Räsnen, J. Chem. Phys.2002,
117, 9095.
[43] I. D. Reva, S. G. Stepanian, L. Adamowicz, R. Fausto,
1
Narrowband NIR-Induced
In Situ
Generation of the High-Energy
Trans
Conformer of Trichloroacetic Acid Isolated in Solid Nitrogen and its Spontaneous
Decay by Tunneling to the Low-Energy
Cis
Conformer
R. F. G. Apóstolo,
aR. R. F. Bento
a,band R. Fausto
a,*a
Department of Chemistry, University of Coimbra, P 3004
−
535, Coimbra, Portugal
b
Instituto de Física, Universidade Federal de Mato Grosso, 78060-900, Cuiabá, Brazil
Contents
Table S1.
B3LYP/cc-PVDZ optimized geometric parameters for
cis
- and
trans
-TCA.
2
Table S2.
Definition of the symmetry coordinates used in the normal coordinate analysis of
trichloroacetic acid.
3
Table S3.
B3LYP/cc-PVDZ calculated infrared spectra for
cis-
and
trans
-TCA and results of normal
coordinate analysis for both conformers.
4
2
Parameter
cis
-TCA
trans
-TCA
Parameter
cis
-TCA
trans
-TCA
C=O
120.00
119.45
C
–
Cl
6,8180.36
181.52
C
–
O
133.96
134.06
C
–
Cl
7178.14
176.92
O
–
H
97.53
97.27
C
–
C
155.70
156.87
C
–
C=O
124.07
122.42
C
–
C
–
Cl
6,8108.68
108.24
C
–
C
–
O
110.45
114.56
C
–
C
–
Cl
7109.95
111.10
O=C
–
O
125.48
123.02
Cl
7–
C
–
Cl
6,8109.80
110.19
C
–
O
–
H
106.42
110.80
Cl
6–
C
–
Cl
8109.91
108.82
O=C
–
O
–
H
0.00
180.00
Cl
7–
C
–
C=O
0.00
0.00
Cl
6,8–
C
–
C=O ±120.36
±121.11
a
3
Coordinate
Sym. Definition
bApproximate
Description
cS
1A´
r(O
–
H)
OH
S
2A´
r(C=O)
C=O
S
3A´
r(C
–
O)
C
–
O
S
4A´
r(C
–
C)
CC
S
5A´
2r(C
–
Cl
7)
–
r(C
–
Cl
6)
–
r(C
–
Cl
8)
CCl
3as´
S
6A´´
r(C
–
Cl
6)
–
r(C
–
Cl
8)
CCl
3as´´
S
7A´
r(C
–
Cl
7) + r(C
–
Cl
6) + r(C
–
Cl
8)
CCl
3s
S
8A´
(C
–
O
–
H)
COH
S
9A´
2 (O
–
C=O)
–
(C
–
C=O)
–
(C
–
C
–
O)
OCO
S
10A´
(C
–
C=O)
–
(C
–
C
–
O)
CCO
S
11A´
2 (Cl
6–
C
–
Cl
8)
–
(Cl
7–
C
–
Cl
6)
–
(Cl
7–
C
–
Cl
8)
CCl
3as´
S
12A´´
(Cl
7–
C
–
Cl
6)
–
(Cl
7–
C
–
Cl
8)
CCl
3as´´
S
13A´
(Cl
6–
C
–
Cl
8) + (Cl
7–
C
–
Cl
6) + (Cl
7–
C
–
Cl
8)
CCl
3s
–
(C
–
C
–
Cl
7)
–
(C
–
C
–
Cl
6)
–
(C
–
C
–
Cl
8)
S
14A´´
(CCO(=O))
C=O
S
15A´
2 (C
–
C
–
Cl
7)
–
(C
–
C
–
Cl
6)
–
(C
–
C
–
Cl
8)
CCl
3´
S
16A´´
(C
–
C
–
Cl
6)
–
(C
–
C
–
Cl
8)
CCl
3´´
S
17A´´
(O=C
–
O
–
H) + (C
–
C
–
O
–
H)
COH
S
18A´´
(O=C
–
C
–
Cl
6) + (O=C
–
C
–
Cl
7) + (O=C
–
C
–
Cl
8)
CCl
3(O
–
C
–
C
–
Cl
6) + (O
–
C
–
C
–
Cl
7) + (O
–
C
–
C
–
Cl
8)
a
See Figure 1 for atom numbering.
br, bond distance; , bond angle; , out of the plane angle; , torsional
dihedral angle; Normalizing constants are not given; they are chosen as
N
= (
c
i2)
– ½, where
c
iis the coefficient
4
cis
-TCA
trans
-TCA
Calculated b Approximate Sym- PED/% c Calculated b Approximate Sym- PED/% c
IIR Description metry IIR Description metry
3710.4 99.7 OH A´ S1(100) 3720.2 71.1 OH A´ S1(100)
1861.7 246.5 C=O A´ S2(89) 1896.5 220.8 C=O A´ S2(88)
1370.7 48.3 COH, C–O A´ S8(44) + S3(28) + S9(16) 1334.2 377.4 COH A´ S8(64) + S3(19)
1182.9 191.2 C–O, COH A´ S8(43) + S3(41) 1195.1 11.8 C–O A´ S3(51) + S8(29)
940.0 12.9 CC A´ S4(48) + S3(17) + S13(17) + S7(13) 921.9 46.8 CC A´ S4(46) + S3(15) + S13(15) + S7(13) 823.4 38.9 C=O A´´ S14(53) + S16(20) + S6(15) 835.9 128.5 CCl3 as´ A´ S5(49) + S10(15) + S15(14) 822.5 186.2 CCl3 as´ A´ S5(53) + S10(16) + S15(15) + S11(11) 813.2 74.3 C=O A´´ S14(52) + S16(20) + S6(13) 685.5 229.4 CCl3 as´´ A´´ S6(53) + S17(32) + S14(11) 678.7 29.3 OCO A´ S9(66) + S7(10)
651.3 95.4 OCO A´ S9(61) + S7(10) 639.1 133.7 CCl3 as´´ A´´ S6(68) + S14(23)
554.3 22.8 COH A´´ S17(64) + S14(19) + S6(17) 447.8 62.1 COH A´´ S17(87) + S14(10)
425.7 1.7 CCl3 s A´ S7(77) + S4(14) 422.4 8.9 CCl3 s A´ S7(39) + S9(15) + S5(15) + S10(12) 413.2 0.6 CCO A´ S10(39) + S5(34) + S9(10) 416.2 12.4 CCO, CCl3 s A´ S7(35) + S10(28) + S5(22)
288.5 0.1 CCl3 s A´ S13(70) + S4(18) 286.2 0.7 CCl3 s A´ S13(69) + S4(20)
276.2 0.4 CCl3 as´´ A´´ S12(74) + S6(16) 273.6 0.3 CCl3 as´´ A´´ S12(69) + S6(19) 266.4 0.4 CCl3 as´ A´ S11(69) + S10(15) 268.9 5.8 CCl3 as´ A´ S11(68) + S10(14) 189.0 1.1 CCl3 ´´ A´´ S15(65) + S11(21) + S10(11) 191.7 3.6 CCl3 ´´ A´´ S15(57) + S11(20) 183.1 0.1 CCl3 ´ A´ S16(69) + S14(19) + S12(13) 180.1 1.2 CCl3 ´ A´ S16(64) + S14(14) + S12(12)
37.9 1.4 CCl3 A´´ S18(100) 6.3 7.7 CCl3 A´´ S18(100)
a