Assessment of the molecular structure of
natrodufrénite – NaFe
2þ
Fe
3þ
5
ð
PO
4
Þ
4
ð
OH
Þ
6
2
ð
H
2
O
Þ
,
a secondary pegmatite phosphate mineral from Minas Gerais, Brazil
Andrés López
a, Ray L. Frost
a,⇑, Yunfei Xi
a, Ricardo Scholz
b, Fernanda Maria Belotti
c, Érika Ribeiro
baDiscipline of Nanotechnology and Molecular Science, Science and Engineering Faculty, Queensland University of Technology, GPO Box 2434, Brisbane, Queensland 4001, Australia bGeology Department, School of Mines, Federal University of Ouro Preto, Campus Morro do Cruzeiro, Ouro Preto, MG 35,400-00, Brazil
cFederal University of Itajubá, Campus Itabira, Itabira, MG 35,903-087, Brazil
h i g h l i g h t s
We have studied the mineral natrodufrénite using SEM-EDX and vibrational spectroscopy. The chemical formula was determined.
Raman bands of natrodufrénite were measured. The molecular structure was assessed.
a r t i c l e
i n f o
Article history:
Received 26 March 2013 Accepted 12 August 2013 Available online 19 August 2013
Keywords:
Natrodufrénite Phosphate Pegmatite
Infrared spectroscopy Raman spectroscopy
a b s t r a c t
The mineral natrodufrénite a secondary pegmatite phosphate mineral from Minas Gerais, Brazil, has been studied by a combination of scanning electron microscopy and vibrational spectroscopic techniques. Electron probe analysis shows the formula of the studied mineral as (Na0.88Ca0.12)P1.00(Fe02þ:72Mn0.11Mg0.08Ca0.04Zr0.01 Cu0.01)P0.97(Fe34þ:89Al0.02)
P4.91(PO4)3.96(OH6.15F0.07)6.222.05(H2O). Raman spectroscopy identifies an intense peak at 1003 cm1assigned to the PO3
4 m1symmetric stretching mode. Raman bands are observed at 1059 and 1118 cm1and are attributed to the PO3
4 m3antisymmetric stretching vibrations. A comparison is made with the spectral data of other hydrate hydroxy phosphate minerals including cyrilovite and wardite. Raman bands at 560, 582, 619 and 668 cm1are assigned to them
4PO34bending modes and Raman bands at 425, 444,
477 and 507 cm1are due to them
2PO34bending modes. Raman bands in the 2600–3800 cm1spectral range
are attributed to water and OH stretching vibrations. Vibrational spectroscopy enables aspects of the molec-ular structure of natrodufrénite to be assessed.
Ó2013 Elsevier B.V. All rights reserved.
1. Introduction
Natrodufrénite is hydrated hydroxyl basic iron and sodium phosphate mineral and shows general chemical formula expressed by NaFe2þFe3þ
5 ðPO4Þ4ðOHÞ62ðH2OÞ. The mineral was first described from Pluherlin Castle, Brittany, France[1]. Natrodufré-nite is a member of the dufréNatrodufré-nite group that also includes buranga-ite, matioliburanga-ite, dufrénite and gayite [2]. Natrodufrénite usually occurs as secondary phosphate mineral in phosphorus bearing pegmatites with primary triplite and zwieselite[2,3].
Granitic pegmatites are important sources for industrial miner-als, gemstones and rare minerals for the collectors market. The diversity of minerals is the result of chemical evolution due to the superposition of different process, including the magmatic,
methasomatic, hydrothermalism and weathering. A complete characterization of the mineral assemblage can be an important tool in the study of the geological evolution of such rocks[4]. In some phosphate rich pegmatites the mineral assemblage can in-clude more than 60 minerals[5–7]. In recent years, the application of spectroscopic techniques to understand the structure of phates is increasing, with special attention to pegmatite phos-phates, especially due to being a non destructive technique (RAMAN) or by using small amounts of sample (infrared).
Farmer [8] divided the vibrational spectra of phosphates according to the presence, or absence of water and/or hydroxyl units in the minerals. In aqueous systems, Raman spectra of phos-phate oxyanions show a symmetric stretching mode (
m
1) at 938 cm1, the antisymmetric stretching mode (m
3) at 1017 cm1, the symmetric bending mode (m
2) at 420 cm1and them
4mode at 567 cm1 [9–12]. The value for them
1 symmetric stretching vibration of PO4 units as determined by infrared spectroscopy0022-2860/$ - see front matterÓ2013 Elsevier B.V. All rights reserved. http://dx.doi.org/10.1016/j.molstruc.2013.08.018
⇑ Corresponding author. Tel.: +61 7 3138 2407; fax: +61 7 3138 1804.
E-mail address:[email protected](R.L. Frost).
Contents lists available atScienceDirect
Journal of Molecular Structure
1070 and 1032 cm1; and beraunite at 1150, 1100, 1076 and 1035 cm1.
In this work, spectroscopic investigation of a monomineral nat-rodufrénite sample from Divino das Laranjeiras, Minas Gerais, Bra-zil has been carried out. The analysis includes spectroscopic characterization of the structure with infrared and Raman spectroscopy.
2. Methods
2.1. Sample preparation
An olive green aggregate of natrodufrénite was obtained from the collection of the Geology Department of the Federal University of Ouro Preto, Minas Gerais, Brazil, with sample code SAB-009. The sample is from a granitic pegmatite located in Divino das Laranje-iras, eastern Minas Gerais. Natrodufrénite forms a botryoidal aggregate up to 3 cm in association with hydroxylherderite and ushkovite. The sample was gently crushed in an agate mortar and the pure fragments were hand selected under a stereomicro-scope Leica MZ4. One fragment was prepared in polyester resin for quantitative chemical analysis. The polishing was undertaken in the sequence of 9
l
m, 6l
m and 1l
m diamond paste MetaDIÒ II Diamond Paste – Buhler, using water as a lubricant, with a semi-automatic MiniMetÒ1000 Grinder–Polisher–Buehler.2.2. Scanning electron microscopy (SEM)
Natrodufrénite samples were coated with a thin layer of evapo-rated carbon. Secondary electron and backscattering images were obtained using a JEOL-JSM840A scanning electron microscope from the Physics Department of the Federal University of Minas Gerais, Belo Horizonte. Qualitative chemical analyses by SEM in the EDS mode were produced to support the mineral characterization and determine the concentration of the elements by Electron probe mi-cro-analysis.
2.3. Electron micro probe (EMP)
EPMA was carried in a selection of two single crystals, with the performance of five spots per crystal. The chemical analysis was carried out with a Jeol JXA8900R spectrometer from the Physics Department of the Federal University of Minas Gerais, Belo Hori-zonte. For each selected element was used the following standards: Fe – Magnetite, Mg – MgO, Mn – Rodhonite, P – Ca2P2O7, Ca – Anor-thite100, Na – Albite100, Al – AnorAnor-thite100, K – Microcline, Zr – Badelleyite, Sr – Celestite, Pb – Galena, Ba – Barite, Cu – CuS and F – Fluorite. The epoxy embedded natrodufrénite sample was coated with a thin layer of evaporated carbon. The electron probe
(50) were accumulated to improve the signal to noise ratio of the
spectra. The spectra were collected over night. Raman Spectra were calibrated using the 520.5 cm1line of a silicon wafer. The Raman spectrum of at least 10 crystals was collected to ensure the consistency of the spectra.
2.5. Infrared spectroscopy
Infrared spectra were obtained using a Nicolet Nexus 870 FTIR spectrometer with a smart endurance single bounce diamond ATR cell. Spectra over the 4000–525 cm1 range were obtained by the co-addition of 128 scans with a resolution of 4 cm1and a mirror velocity of 0.6329 cm/s. Spectra were co-added to improve the signal to noise ratio. The infrared spectra are given in the sup-plementary information.
Spectral manipulation such as baseline correction/adjustment and smoothing were performed using the Spectracalc software package GRAMS (Galactic Industries Corporation, NH, USA). Band component analysis was undertaken using the Jandel ‘Peakfit’ soft-ware package that enabled the type of fitting function to be se-lected and allows specific parameters to be fixed or varied accordingly. Band fitting was done using a Lorentzian–Gaussian cross-product function with the minimum number of component bands used for the fitting process. The Gaussian–Lorentzian ratio was maintained at values greater than 0.7 and fitting was under-taken until reproducible results were obtained with squared corre-lations ofr2greater than 0.995.
3. Results and discussion
3.1. Chemical characterization
The BSI images of a natrodufrénite crystal aggregate studied in this work are shown inFig. 1. The quantitative chemical analysis of natrodufrénite is presented inTable 1. The water content was cal-culated by stoichiometry. The chemical composition indicates an intermediate member of the natrodufrénite–dufrénite series with predominance of the natrodufrénite in relation to dufrénite end-member. The results also show variable amounts of Ba that due to the ionic ratio was considered in substitution to Na. and Ca, which partially replaces Mg and Na, respectively.
ðNa0:88Ca0:12ÞR1:00ðFe
2þ
0:72Mn0:11Mg0:08Ca0:04Zr0:01Cu0:01ÞR0:97
ðFe3þ
4:89Al0:02ÞR4:91
ðPO4Þ3:96
ðOH6:15F0:07Þ6:22
2:05ðH2OÞ
3.2. Vibrational spectroscopy
Ra-man bands, their position and relative intensities. It is noted that there are large parts of the spectrum where no intensity is ob-served. Therefore, the spectrum is subdivided into sections where significant intensity is observed, based upon the type of vibration being studied. The infrared spectrum of natrodufrénite is displayed inFig. 2b. This figure shows the position and relative intensities of the infrared bands. There are large spectral regions where no inten-sity is observed; therefore, the spectrum is subdivided into sec-tions depending upon the types of vibration being examined. There has been very little published on the Raman spectrum of duf-rénite. There is a spectrum of natrodufrénite given on the RRUFF data base at http://rruff.info/dufrenite/display=default/. This Ra-man spectrum is shown in Supplemenatry information. However no assignment or description of the bands is given. Also the spec-tral region of the hydroxyl stretching region is not shown. Such bands are important for the determination of the molecular struc-ture of the mineral. Some infrared spectra of dufrénite may be found in some data bases but the data is not readily accessible.
The Raman spectrum of natrodufrénite over the 800–1400 cm1 spectral range is shown inFig. 3a. The spectrum is dominated by an intense somewhat broad peak at 1003 cm1assigned to the PO3
4
m
1 symmetric stretching mode. Two Raman bands are observed at 1059 and 1118 cm1and are attributed to the PO34
m
3 antisym-metric stretching vibrations. The Raman spectrum of anatrodufré-nite from the RRUFF data base is given in Supplementary information. This spectrum shows an intense band at 995 cm1 with a high wavenumber shoulder at 995 cm1. These bands may be assigned to the PO3
4
m
1symmetric stretching mode This RRUFF spectrum also shows three bands at 1053, 1162 and 1186 cm1. These bands may be assigned to the PO34
m
3 antisymmetric stretching vibrations. The Raman bands are broad. This suggests that each peak may be composed of a number of overlapping bands. It is interesting to compare the spectra of natrodufréniteFig. 1.Backscattered electron image (BSI) of a natrodufrénite fragment up to 0.5 mm in length.
Table 1
Chemical composition of natrodufrénite from Minas Gerais (mean of eight electron microprobe analyses). H2O calculated by stoichiometry.
Constituent wt.% Range (wt.%) Number of atoms Probe standard
P2O5 30.94 3.96 Ca2P2O7
FeO 5.70 0.72 Magnetite
Fe2O3 43.01 4.89 Calculated by stoichiometry
MgO 0.37 0.28–0.45 0.08 MgO
Al2O3 0.13 0.07–0.20 0.02 Anorthite100
CaO 0.98 0.85–1.11 0.16 Anorthite100
Na2O 3.00 2.83–3.09 0.88 Albite100
K2O 0.02 0.00–0.05 0.00 Microcline
MnO 0.83 0.71–0.98 0.11 Rodhonite
ZrO2 0.13 0.04–0.21 0.01 Badelleyite
SrO 0.02 0.00–0.04 0.00 Celestite
PbO 0.02 0.00–0.09 0.00 Galena
BaO 0.03 0.00–0.13 0.00 Barite
CuO 0.04 0.00–0.06 0.01 CuS
H2O 10.16 H2O 2.05 Calculated by TG
OH 6.15
F 0.15 0.11–0.17 0.07 Fluorite
Total 96.64 9.90
Fig. 2.(a) Raman spectrum of natrodufrénite over the 100–4000 cm1spectral
range. (b) Infrared spectrum of natrodufrénite over the 500–4000 cm1spectral
range.
with other minerals containing sodium and iron, such as cyrilovite Na(Fe3+)3(PO4)2(OH)4
2(H2O). The Raman spectrum of cyrilovite is
dominated by two intense bands at 992 and 1055 cm1. These two bands are assigned to the
m
1PO34symmetric stretching vibra-tions. Two intense bands are observed reflecting two non-equiva-lent phosphate units in the cyrilovite structure. A comparison may be made with the spectrum of wartdite. The Raman spectrum is dominated by two intense bands at around 995 and 1051 cm1. The spectra appear to differ considerably from that obtained by Breitinger et al.[15]. Breitinger et al. used FT-Raman to obtain their spectrum and found overlapping Raman bands at 999 and 1033 cm1 and assigned these bands to them
1 PO34 symmetric stretching andm
3PO34antisymmetric stretching modes. In the Ra-man spectrum of cyrilovite, a series of low intensity bands are noted at 1105, 1136, 1177 and 1184 cm1. These bands are as-signed to them
3PO34antisymmetric stretching modes. The Raman spectrum of wardite shows a group of low intensity bands are ob-served at 1084, 1108, 1120, 1140 and 1186 cm1. Breitinger et al.[15]did not report any bands in these positions in the Raman spec-trum of synthetic wardite.
The complimentary infrared spectrum of natrodufrénite over the 600–1300 cm1 spectral range is illustrated in Fig. 3b. The spectrum shows a broad band with some spectral features. The infrared band at 1016 cm1may be assigned to the PO3
4
m
1 sym-metric stretching mode. The infrared bands at 1069, 1154 and 1190 cm1are assigned to the PO34
m
3antisymmetric stretching vibrations. Other infrared bands as determined by band compo-nent analysis are observed at 769, 918, 878, 947 and 977 cm1. Some of these bands can be attributed to water librational and hy-droxyl deformation modes.The Raman spectrum of natrodufrénite over the 200–800 cm1 spectral range is reported inFig. 4a and the Raman spectrum of the natrodufrénite in the 100–200 cm1 spectral range is given in
Fig. 4b. This spectrum (Fig. 4a) may be subdivided into sections. The first section is the 600–800 cm1region, the bands around 500 cm1and the bands between 300 and 400 cm1. Raman bands at 560, 582, 619 and 668 cm1are assigned to the
m
4PO34bending modes. Raman bands are found at 557, 580 and 660 cm1in the RRUFF spectrum of natrodufrénite, in harmony with the bands found in this work.The Raman bands at 425, 444, 477 and 507 cm1are due to the
m
2PO34 bending modes. Raman bands found in the RRUFF spec-trum are observed at 422, 475 and 506 cm1. It is again worthwhile to compare the spectra of natrodufrénite with that of cyrilovite. Ra-man bands for cyrilovite are observed at 612 and 631 cm1and are assigned to them
4 out of plane bending modes of the PO34 and HOPO23 units. In the Raman spectrum of wardite, bands are ob-served at 605 and 618 cm1with shoulders at 578 and 589 cm1. Breitinger et al. assigned these bands to
m
(Al(O/OH)6) stretching vibrations. No phosphate bending modes in the work of Breitinger et al. were reported.Raman bands at 668 cm1 are assigned to the out-of-plane vibrations of POH units. Farmer[8]tabled this band at 750 cm1. In the infrared spectrum (Fig. 3b), infrared bands are observed at 769 and 878 cm1. These bands may be due to the out-of-plane vibrations of POH units. The Raman bands at 298, 356 and 376 cm1are attributed to metal–oxygen stretching bands. In the RRUFF spectrum, Raman bands are observed at 287 and 367 cm1. The Raman bands in the 100–200 cm1spectral range (Fig. 4b) are assigned to lattice vibrations. Prominent bands are
ob-Fig. 3.(a) Raman spectrum of natrodufrénite over the 800–1400 cm1spectral
range. (b) Infrared spectrum of natrodufrénite over the 500–1300 cm1spectral
range.
Fig. 4.(a) Raman spectrum of natrodufrénite over the 300–800 cm1spectral
served at 120, 142 and 163 cm1. These bands may be simply de-scribed as lattice vibrations.
The Raman spectrum of natrodufrénite in the 2600–3800 cm1 spectral range is shown inFig. 5a. The Raman spectrum is com-posed of basically two bands at 3187 and 3573 cm1. This latter band is assigned to the OH stretching vibration. The former band is ascribed to water stretching vibrations. Intense Raman bands for cyrilovite are found at 3328 and 3452 cm1with a broad shoul-der at 3194 cm1and are assigned to OH stretching vibrations.
The complimentary infrared spectrum is given inFig. 5b. Two strong bands are observed at 3162 and 3562 cm1. These bands are in harmony with the bands observed in the Raman spectrum. The latter band is assigned to the stretching vibrations of the hydro-xyl units and the former to water stretching vibrations. In the infra-red spectrum of cyrilovite sharp infrainfra-red bands are observed at 3485 and 3538 cm1. Broad infrared bands are found at 2893, 3177 and 3311 cm1. Tarte et al. reported the infrared spectrum of wardite and cyrilovite. They found that O–H stretching frequencies are dis-tributed into 2 spectra regions: 2 very broad bands near 2950 and 3300 cm1, which are due to H2O mols. engaged in short H bonds; and 2 very sharp and strong peaks (3550 and 3495 cm1for pure cyrilovite, 3621 and 3555 cm1for pure wardite) due to the stretch of hydroxyl group. Sharp infrared bands for wardite are observed at 3544 and 3611 cm1and are attributed to the OH stretching vibra-tions of the hydroxyl units. A sharp band in the infrared spectrum is observed at 3480 cm1for the sample from Utah. This band may be due to FeOH stretching vibrations. Breitinger et al.[15]found infrared bands at 3520 (vw), 3545 (s), 3585 (sh) and 3613 cm1 (m). Breitinger et al. states that the
m
(OH) modes in the two indepen-dent pairs of symmetry-correlated OH groups classify as 2a + 2b;with the correlation splitting between a and b species depending on the distances in each of the pairs[15]. The
m
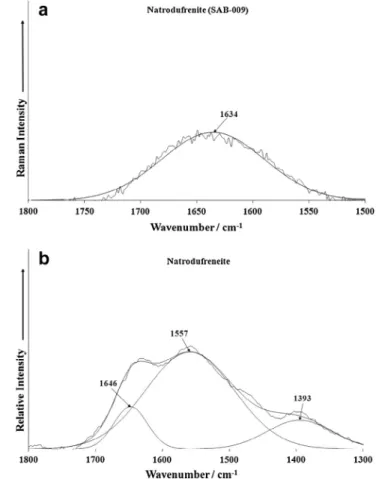
(OH) region of IR spec-tra of wardite shows two sharp bands (3613 and 3545 cm1) with two weak shoulders or satellites (3580 and 3520 cm1). It is likely that the two sharp infrared bands are due to two independent and non-equivalent OH units.The Raman spectrum of natrodufrénite in the 1500–1800 cm1 spectral range is reported inFig. 6a. There appears to be one broad band centered upon 1634 cm1 assigned to the water bending mode. The width of the band is in harmony with the broad bands observed in the OH stretching region. The infrared spectrum in this spectral range is displayed in Fig. 6b. The infrared band at 1646 cm1 is ascribed to the water bending vibration. Raman bands for cyrilovite are observed at 1599 and 1634 cm1. These bands are assigned to water bending modes. In contrast, the infra-red spectrum of cyrilovite shows significant intensity. Water is a very strong infrared absorber. Infrared bands are observed at 1599 and 1650 cm1 and are assigned to water bending modes. Infrared bands for wardite are observed at 1549, 1670 and 1748 cm1. The bands in this region result from correlation split-ting as a result of the short distance and orientation of the H2O molecules. Additional bands for wardite are observed at 1417 and 1476 cm1. The assignment of these bands is due to OH defor-mation modes. The presence or absence of these bands depends upon the Fe/Al ration in the cyrilovite/wardite mineral samples.
4. Conclusions
We have studied the phosphate mineral natrodufrénite, a mem-ber of the dufrénite group that also includes burangaite, matioliite, dufrénite and gayite, using a combination of electron microscopy
Fig. 5.(a) Raman spectrum of natrodufrénite over the 2600–4000 cm1spectral
range. (b) Infrared spectrum of natrodufrénite over the 2600–4000 cm1spectral
range.
Fig. 6.(a) Raman and (b) Infrared spectrum of natrodufrénite in the 1500– 1800 cm1spectral range.
The observation of multiple bands in both the
m
4andm
2PO34 bend-ing spectral range implies some distortion of the phosphate anion. The Raman spectrum of natrodufrénite in the hydroxyl stretch-ing region is composed of two bands at 3187 and 3573 cm1, as-signed to the water and hydroxyl unit stretching vibration. The peaks are quite broad. This suggests some variation in the hydro-gen bond distances between the OH units and the phosphate anion. Certainly, vibrational spectroscopy enables an assessment of the structure of natrodufrenite at the molecular level to be made.Acknowledgements
The financial and infra-structure support of the Discipline of Nanotechnology and Molecular Science, Science and Engineering Faculty of the Queensland University of Technology, is gratefully
[4]M. Baijot, F. Hatert, S. Philippo, Can. Min. 50 (2012) 1531–1554. [5]T.J. Campbell, W.L. Roberts, Min. Rec. 17 (1986) 237–254. [6]O.V. Knorring, E. Condliffe, Geol. J. 22 (1987) 253–270. [7]J.P. Cassedanne, A. Baptista, Min. Rec. 30 (1999) 347–365.
[8]V.C. Farmer, Mineralogical Society Monograph 4: The Infrared Spectra of Minerals, Mineralogical Society, London, 1974.
[9]R.L. Frost, T. Kloprogge, P.A. Williams, W. Martens, T.E. Johnson, P. Leverett, Spectrochim. Acta 58A (2002) 2861–2868.
[10]R.L. Frost, W. Martens, P.A. Williams, J.T. Kloprogge, Min. Mag. 66 (2002) 1063– 1073.
[11]R.L. Frost, W.N. Martens, T. Kloprogge, P.A. Williams, Neues Jahr. Min. (2002) 481–496.
[12]R.L. Frost, P.A. Williams, W. Martens, J.T. Kloprogge, P. Leverett, J. Raman Spectrosc. 33 (2002) 260–263.
[13]R.L. Frost, Spectrochim. Acta 60A (2004) 1439–1445.
[14]R.L. Frost, M.L. Weier, K.L. Erickson, O. Carmody, S.J. Mills, J. Raman Spectrosc. 35 (2004) 1047–1055.