www.atmos-meas-tech.net/7/3783/2014/ doi:10.5194/amt-7-3783-2014
© Author(s) 2014. CC Attribution 3.0 License.
Validation of nine years of MOPITT V5 NIR using
MOZAIC/IAGOS measurements: biases and long-term stability
A. T. J. de Laat1, I. Aben2, M. Deeter3, P. Nédélec4, H. Eskes1, J.-L. Attié4,5, P. Ricaud5, R. Abida5, L. El Amraoui5, and J. Landgraf2
1Royal Netherlands Meteorological Institute, de Bilt, the Netherlands 2Netherlands Space Research Institute, Utrecht, the Netherlands 3National Center for Atmospheric Research, Boulder, USA
4Laboratoire d’Aérologie-OMP, Université de Toulouse – CNRS/INSU, UMR5560, Toulouse, France 5CNRM-GAME Météo-France/CNRS UMR 3589, Toulouse, France
Correspondence to:A. T. J. de Laat ([email protected])
Received: 3 April 2014 – Published in Atmos. Meas. Tech. Discuss.: 2 June 2014 Revised: 19 August 2014 – Accepted: 1 October 2014 – Published: 18 November 2014
Abstract. Validation results from a comparison between Measurement Of Pollution In The Troposphere (MOPITT) V5 Near InfraRed (NIR) carbon monoxide (CO) total col-umn measurements and Measurement of Ozone and Water Vapour on Airbus in-service Aircraft (MOZAIC)/In-Service Aircraft for a Global Observing System (IAGOS) aircraft measurements are presented. A good agreement is found be-tween MOPITT and MOZAIC/IAGOS measurements, con-sistent with results from earlier studies using different vali-dation data and despite large variability in MOPITT CO total columns along the spatial footprint of the MOZAIC/IAGOS measurements. Validation results improve when taking the large spatial footprint of the MOZAIC/IAGOS data into ac-count. No statistically significant drift was detected in the validation results over the period 2002–2010 at global, conti-nental and local (airport) scales. Furthermore, for those situ-ations where MOZAIC/IAGOS measurements differed from the MOPITT a priori, the MOPITT measurements clearly outperformed the MOPITT a priori data, indicating that MOPITT NIR retrievals add value to the MOPITT a pri-ori. Results from a high spatial resolution simulation of the chemistry-transport model MOCAGE (MOdèle de Chimie Atmosphérique à Grande Echelle) showed that the most likely explanation for the large MOPITT variability along the MOZAIC-IAGOS profile flight path is related to spatio-temporal CO variability, which should be kept in mind when using MOZAIC/IAGOS profile measurements for validating satellite nadir observations.
1 Introduction
Carbon monoxide (CO) is an important atmospheric trace gas due to its relevance for the oxidizing capacity of the tropo-sphere (Crutzen and Zimmermann, 1991) as its reaction with the hydroxyl (OH) radical – the atmospheric detergent – is the most important sink of OH. Furthermore, CO also plays a role in regional air quality and air pollution as a precur-sor of tropospheric ozone – an important component of air pollution – and is therefore often used to monitor long-range transport of air pollution (e.g. Guerova et al., 2006; Kono-valov et al., 2010; Nam et al., 2010; Ghude et al., 2011).
has been identified as an Essential Climate Variable precursor by the World Meteorological Organization (WMO/GCOS).
Because of its typical atmospheric residence time of weeks to months, a reliable estimate of the global CO budget can only be provided by the use of satellite measurements. For studying long-term changes in CO, it is vital that satellite measurements do not contain biases either in space or time. It is thus important that the satellite measurements are well calibrated and validated.
One of the longest records of measurements of tropo-spheric constituents from space is actually that of CO by the US/Canadian Measurement Of Pollution In The Tropo-sphere (MOPITT) mission, which has been operational since March 2000. The MOPITT instrument has been providing the vertical distribution of CO from measuring thermal In-fraRed (IR) radiation emitted by Earth and its atmosphere. MOPITT data have been widely used in many applications (e.g. Worden et al., 2013, and references therein; see also http://www2.acd.ucar.edu/mopitt/refereed-publications).
Apart from measuring IR radiation around 4.7 µm, the MOPITT instrument also measures in the 2.3 µm wavelength range (also known as Near InfraRed or NIR). It was al-ready known – based on measurements by the SCIAMACHY instrument – that useful information on CO could be de-rived from NIR wavelengths (e.g. Buchwitz et al., 2004, 2006, 2007; Dils et al., 2006; Sussmann and Buchwitz, 2005; Warneke et al., 2005; Gloudemans et al., 2006). However, due to instrumental issues affecting the data, a useful MO-PITT NIR CO product had been still lacking for some time. Only in 2009 was the NIR CO data product delivered by the MOPITT team (Deeter et al., 2009).
In recent years, MOPITT CO measurements have also been incorporated into data assimilation systems (El Am-raoui et al., 2010; Elguindi et al., 2010; Huijnen et al., 2012; Inness et al., 2013; Stein et al., 2014). The assimilation of CO assists in improving long-range transport of air pollution, for example from biomass burning, for improving understanding of stratosphere–troposphere exchange and its representations in numerical weather forecast models as well as for providing the best analysis of the 3-D global distribution of trace gas concentrations and assessing the quality of historical emis-sion databases.
Since the release of MOPITT NIR CO, a first validation study using NOAA (National Oceanic and Atmospheric Ad-ministration) aircraft data has shown that the NIR measure-ments are in good agreement with observations (Deeter et al., 2013), with an average bias of approximately 5–10 % and a 10-year drift of approximately 0.15 % year−1, both thus be-ing insignificant. However, the NOAA measurements have a limited spatial coverage, only providing data over North America, and more validation of MOPITT NIR would be beneficial (opposite to the MOPITT TIR data, which has been much more extensively validated; Deeter et al., 2013, and references therein). An alternative validation data set is available via regular In-Service Aircraft for a Global
Ob-serving System (IAGOS) measurements on board of several commercial aircraft. IAGOS is a continuation of the Mea-surement of Ozone and Water Vapour on Airbus in-service Aircraft (MOZAIC) project that has been providing mea-surements made on board commercial aircraft since the late 1990s. This data set has already been used for the validation of SCIAMACHY CO measurements (de Laat et al., 2012). Results of validation of MOPITT NIR measurements are pre-sented in this paper. Important aspects of the validation are (1) how our results compare with the validation results of Deeter et al. (2013), (2) can we find indications of spatial biases and (3) is there any long-term drift in the MOPITT measurements, which is important for long-term monitoring of CO.
Furthermore, although used for validation of SCIA-MACHY CO, there still is an important open question with regard to the use of MOZAIC/IAGOS data for satel-lite validation: how representative are the vertically inte-grated MOZAIC/IAGOS CO profile measurements of a true vertical CO column? Because the MOZAIC/IAGOS profile measurements used for validation of CO profiles and to-tal columns are obtained during take-off and landing of air-craft, these profiles cover a certain horizontal distance (typ-ically 200–400 km, the so-called “profile flight path”). Be-cause of the lower data quality of SCIAMACHY CO, con-siderable spatio-temporal averaging of SCIAMACHY was required to reduce SCIAMACHY CO measurement errors to acceptable levels in the study by de Laat et al. (2012). Hence, the question related to the representativity of the MOZAIC/IAGOS CO profiles did not have to be addressed in that study. However, given that MOPITT NIR measure-ments are of higher quality than those of SCIAMACHY – thus not requiring extensive spatio-temporal averaging – and that the size of the MOPITT pixel is considerably smaller (approximately 25 km) than the typical profile flight path dis-tance, the question should be asked whether – and how – a single MOPITT measurement should be compared with the MOZAIC/IAGOS profiles. In Deeter et al. (2013) it is as-sumed that the in situ profile measurements used for val-idation are representative for a certain horizontal distance, which is not further discussed. A clear answer to this ques-tion is important for the use of MOZAIC/IAGOS measure-ments for validation of current (e.g. MOPITT) and future (e.g. TROPOMI) satellite instruments, but has never been ad-dressed before in detail. This validation study will address this fundamental question and aims to serve as a baseline for future studies on how to use MOZAIC/IAGOS profile mea-surements for satellite validation.
there are currently relatively few MOZAIC/IAGOS CO profiles available. Section 4 discusses results for individ-ual MOZAIC/IAGOS airport locations. Section 5 analy-ses high spatio-temporal chemistry-transport model simula-tions from the perspective of the spatial representation of MOZAIC/IAGOS CO profile measurements compared to the MOPITT CO total column measurements. Section 6 ends the paper with a summary and a discussion.
2 Data
2.1 MOPITT V5 NIR
This paper uses the same MOPITT V5 data as in the vali-dation paper of Deeter et al. (2013) which builds on earlier work for MOPITT V4 as outlined in Deeter et al. (2009, 2010) and Worden et al. (2010). We refer to both papers and references therein for the details of the MOPITT V5 re-trievals and data set. We simply make a few remarks here about MOPITT V5 NIR data relevant for this study. MO-PITT is a gas-filter correlation radiometer rather than a more commonly used grating spectrometer like in SCIAMACHY. It measured CO at two wavelengths: the thermal infrared around 4.7 µm and the near infrared around 2.3 µm. The spa-tial resolution of MOPITT measurements is approximately 25 km with a swath width of 640 km and MOPITT is in a po-lar orbit providing global coverage in 3 days. MOPITT has been measuring CO from the year 2000 onwards and is still operational at the moment of writing.
First of all, the MOPITT NIR CO retrievals obtain in-formation from the 2.3 µm first overtone band which is the same wavelength range used by SCIAMACHY. This wave-length range is dominated by reflected solar radiation rather than thermal IR radiation emitted by Earth and the atmo-sphere. An advantage of this wavelength range is that the ver-tical sensitivity of NIR retrievals is much more uniform with height (Gloudemans et al., 2008) than that of IR retrievals, which are particularly sensitive to temperature differences between the Earth’s surface and the atmosphere just above. On the other hand, the NIR measurements are – amongst oth-ers – also determined by the Earth surface NIR reflectance properties. As a result, due to the very low reflectivity of oceans at NIR wavelengths, the signal-to-noise over cloud-free oceans is too low for meaningful NIR retrievals. Hence, only daytime observations over land are available for MO-PITT NIR. Note that the combined use of CO and CH4 re-trievals in SCIAMACHY enables meaningful rere-trievals over clouded ocean scenes as CH4is used to provide information on the cloud height. However, since MOPITT does not pro-vide CH4 measurements, the same methodology cannot be applied for MOPITT NIR.
MOPITT “log(VMR)” CO retrievals are performed on a 10-level retrieval grid from the surface to 100 with 100 hPa intervals. All V5 products are processed using a forward
model in the retrieval algorithm which explicitly accounts for long-term instrumental changes. This was unaccounted for in earlier MOPITT retrieval versions. In addition, the V5 re-trievals account for both instrumental noise and “geophysical noise”, i.e. random errors in the calibrated radiances resulting from the combined effects of field-of-view motion and fine-scale spatial variability in surface radiative properties dur-ing each observation (Deeter et al., 2011), whereas all earlier MOPITT retrieval products only accounted for instrumen-tal noise. Finally, MOPITT V5 uses a priori profiles based on a monthly climatology from the global chemical trans-port model Model for Ozone and Related chemical Tracers, version 4 (MOZART-4). MOZART-4 simulates 100 chem-ical species with relatively detailed hydrocarbon chemistry, has a horizontal resolution of approximately 3◦×3◦and 28
vertical levels up to 2 hPa (Emmons et al., 2010).
2.2 MOZAIC/IAGOS
MOZAIC was initiated in 1993 by European scientists, air-craft manufacturers and airline companies to better under-stand the natural variability of the chemical composition of the atmosphere and how it is changing under the influence of human activity, with a particular focus on the effects of air-craft. IAGOS is both a continuation and an extension of the MOZAIC research infrastructure. MOZAIC/IAGOS consists of automatic and regular measurements of reactive gases by several long-distance passenger airliners. A large database of measurements (about 30 000 flights since 1994) allows studies of chemical and physical processes in the atmosphere and also validation of global chemistry transport models and satellite retrievals. MOZAIC/IAGOS data provide detailed climatologies of trace gases at 9–12 km and also provide fre-quent vertical profiles close to a large number of airports.
the MOZAIC/IAGOS program see Marenco et al. (1998) or http://mozaic.aero.obs-mip.fr and http://www.iagos.org/. 2.3 Post-processing, selection criteria and
error estimates
To compare MOPITT NIR and MOZAIC/IAGOS profile measurements, we use the procedure outlined below, which is based on the methodology presented in de Laat et al. (2012) for the use of MOZAIC/IAGOS profile ments to validate SCIAMACHY CO total column measure-ments. We focus on the period 2002–2010, as after 2010 there are currently few MOZAIC/IAGOS CO profiles avail-able.
2.3.1 Vertical representation
The first filter is to only select MOPITT and MOZAIC/IAGOS profiles for which there are no miss-ing data between 1000 and 300 hPa. The 300 hPa altitude is approximately the maximum altitude of MOZAIC/IAGOS measurements. In order to ensure that the profile mea-surements are representative for a significant part of the troposphere, we only select profiles that start below 800 hPa and measure at least up to 300 hPa. Furthermore, every 100 hPa height interval up to 300 hPa must contain at least one measurement. This is the most relevant for MOZAIC/IAGOS measurements, for which sometimes part of the vertical profile is missing. Approximately 6 % of the MOZAIC/IAGOS profiles do not meet the criterion of having at least one measurement every 100 hPa height interval.
2.3.2 Missing MOZAIC/IAGOS profile information above 300 hPa
The next step is to convert MOZAIC/IAGOS profiles to columns. MOZAIC/IAGOS does not provide measurements above 300 hPa – the flight ceiling of commercial aircraft – and the accumulated profile is thus not yet a true CO total col-umn (see Zbinden et al. (2013) for a discussion of MOZAIC profile measurements in relation to tropopause heights). Fur-thermore, extending the MOZAIC/IAGOS CO profiles to the highest MOPITT level is mandatory for applying the MO-PITT averaging kernel (see Sect. 2.3.4). The missing partial column above the highest altitude where MOZAIC/IAGOS measures is estimated from the MOPITT a priori profile.
De Laat et al. (2012, their Fig. 1) showed that the contribution of the above-MOZAIC/IAGOS profile sub-column contributes less than 20–30 % to the total col-umn. Because we use the MOPITT a priori to extend the MOZAIC/IAGOS profile to match the MOPITT vertical grid, it is important to know the error of assuming that the MOPITT a priori is reality. For this, we can com-pare MOPITT with the MOZAIC/IAGOS profile measure-ments. For 95 % (99 %) of the pixels the differences
tween MOZAIC/IAGOS and MOPITT a priori total columns are less than 20 % (30 %), whereas the average MOPITT a priori bias compared to MOZAIC/IAGOS is approximately 10 %. Furthermore, 20–30 % of the CO total column is lo-cated above 300 hPa – the maximum height reached by MOZAIC/IAGOS. Hence, errors due to adding the MO-PITT a priori to the MOZAIC/IAGOS profile for the miss-ing MOZAIC/IAGOS measurements above the maximum MOZAIC/IAGOS altitude are of the order of approximately 5 % and less: 20–30 % of the CO total column located above 300 hPa multiplied by an average error in the MOPITT a pri-ori of 10 %.
Note that rather than adding the a priori estimate of the missing column to the MOZAIC/IAGOS partial column it is also possible to scale the MOZAIC/IAGOS partial column with the modelled ratio of the modelled (a priori) total col-umn over the modelled (a priori) partial colcol-umn. An evalua-tion of results from both methods yielded very similar total column estimates (de Laat et al., 2012), indicating that re-sults are robust with regard to the choice of correcting for the “missing” part in the MOZAIC/IAGOS profiles.
2.3.3 MOPITT collocations along MOZAIC/IAGOS profile path
Because the MOZAIC/IAGOS profile measurements de facto are not true vertical profiles but rather follow a sort of a slant path through the atmosphere during ascent and descent of the aircraft – see later Sect. 5 and Fig. 5 – the horizontal distance covered by the MOZAIC/IAGOS profiles typically ranges from 200 to 400 km, with minimum and maximum distances covered for the data used in this study varying be-tween 71 and 444 km with a mean and median distances both just over 300 km.
For the comparison with MOPITT NIR measurements, we define a collocation with MOZAIC/IAGOS as follows: mea-surement should be made during the same day (UTC time), and the MOPITT pixel center should be collocated within 25 km of the MOZAIC/IAGOS profile path. The number of MOPITT collocations per MOZAIC/IAGOS profile varies strongly as – apart from the MOPITT pixels size and orbit width – cloud cover and land-sea masks also play a role. For approximately 50 % of the MOZAIC/IAGOS measurements, there are 10 or more MOPITT collocations. This percent-age gradually decreases with increasing number of colloca-tions: for 25/10/5 % of the MOZAIC/IAGOS sub-columns, there are more than 19/27/32 MOPITT collocations, respec-tively (see Supplement Table S1). The maximum number of MOPITT collocations for a MOZAIC/IAGOS profile was 46. Hence, it is important to realize that each MOZAIC/IAGOS profile measurement typically is assigned to multiple MO-PITT measurements.
2.3.4 MOPITT averaging kernels and MOPITT a priori The MOPITT averaging kernels are applied to the loga-rithm of the MOZAIC/IAGOS mixing ratio profiles, follow-ing Rodgers et al. (2000):
comparison profile=xa10 log+AMOP
xMI10 log−xa10 log
, (1) in which xMI is the MOZAIC/IAGOS CO profile, xa is the MOPITT a priori CO profile, 10log indicates the log-arithm of the CO mixing ratio profile and AMOP is MO-PITT the averaging kernel. After this convolution, the pro-file is converted back from 10log values to mixing ratios and vertically integrated to a total column. Subsequently, the higher vertical resolution MOZAIC/IAGOS CO profile is mapped (averaged) onto lower the MOPITT vertical reso-lution, whereby we ensure that the total column value of the averaged MOZAIC/IAGOS CO profiles is not altered.
Furthermore, since each MOPITT profile measurement comes with its own averaging kernel and a priori, the “com-parison profile” as described above will be different for each MOPITT collocation, even though there is only one MOZAIC/IAGOS profile. The variation in the smoothed MOZAIC/IAGOS total columns due to the multiple MO-PITT measurements collocated with MOZAIC/IAGOS is less than 2.5/3.5/6 % for 90/95/99 % of the MOZAIC/IAGOS total column values, respectively. This is roughly equal to or less than the single MOZAIC/IAGOS measurement er-ror. About half of this effect is related to spatial differences in the MOPITT a priori, the other half is related to differ-ences in the MOPITT averaging kernel shape. Thus, varia-tions in MOZAIC/IAGOS CO total columns due to differ-ent MOPITT averaging kernels are relatively small. This ef-fect does not vary with changing number of MOPITT col-locations, i.e. for either more or less collocations between MOZAIC/IAGOS and MOPITT these statistics remain simi-lar. Although this is a small effect, it is not insignificant and should be kept in mind when interpreting the comparison. 2.3.5 Synthesis
In summary, the following steps are taken before MOZAIC/IAGOS and MOPITT measurements are com-pared and the comparisons are analysed:
– MOZAIC/IAGOS profile should reach at least 300 hPa; – MOZAIC/IAGOS profile must have measurement in
ev-ery 100 hPa altitude bin;
– MOZAIC/IAGOS profile above maximum altitude is extended with the MOPITT a priori;
– MOPITT profiles must start below 800 hPa;
– Every single MOPITT measurement collocated with a MOZAIC/IAGOS flight path is considered a colloca-tion with that MOZAIC/IAGOS measurement, resulting in multiple collocations with a single MOZAIC/IAGOS profile measurement;
– MOPITT averaging kernels and a priori profiles are ap-plied to the vertically extended MOZAIC/IAGOS pro-files for each single MOPITT collocation;
– After convolution with the MOPITT averaging kernels and a priori profiles, the MOZAIC/IAGOS profiles are vertically integrated to total columns for comparison with MOPITT total columns.
2.3.6 MOCAGE
To investigate the representation of a CO total column based on the MOZAIC/IAGOS profile measurements – which cov-ers a horizontal distance – compared to true total CO columns as measured by MOPITT, results from a high-resolution (0.2◦×0.2◦) simulation of the regional chemistry-transport
model MOCAGE have also been analysed.
The MOCAGE model (MOdèle de Chimie Atmosphérique à Grande Echelle) (Peuch et al., 1999) is a 3-D CTM which covers the planetary boundary layer, the free tropo-sphere and the stratotropo-sphere. It provides a number of optional configurations with varying domain geometries and resolu-tions, as well as chemical and physical parametrization pack-ages. It has the flexibility to use several chemical schemes for stratospheric and tropospheric studies. For example, the MOCAGE main scheme is a detailed chemical scheme with 89 prognostic variables and 372 reactions.
MOCAGE is used for several applications: operational chemical weather forecasting in Météo-France (Dufour et al., 2004), tropospheric as well as stratospheric research stud-ies (e.g. Josse et al., 2004; Michou et al., 2005; Ricaud et al., 2009a, b), and data assimilation research (e.g. Cathala et al., 2003; Pradier et al., 2006; Clark et al., 2007; Se-mane et al., 2007; El Amraoui et al., 2008a, b; SeSe-mane et al., 2009). MOCAGE can be forced dynamically by external wind and temperature fields from the Météo-France reanal-ysis ARPEGE (Action de Recherche Petite Echelle Grande Echelle).
The MOCAGE simulations used in this paper were per-formed within the ESA-ISOTROP project (see Acknowl-edgements). We only use the results of free runs from the ISOTROP ozone Nature runs over a European do-main (see later Fig. 5) for two periods lasting three months (June 2003–August 2003 and November 2003–Jan-uary 2004). For these simulations, anthropogenic emissions are based on the TNO-MACC emission inventory used for the LOTOS-EUROS model at 0.2◦×0.2◦ resolution
(Kuenen et al., 2011; Denier van der Gon et al., 2010), complemented by EMEP 0.5◦×0.5◦ shipping emissions.
No seasonal variability of these anthropogenic emissions
is assumed. The biogenic emissions are available on the model resolution but fixed per month following Simpson et al. (2003). Biomass burning emissions are based on GFED V3 (daily on 1◦×1◦).
3 Validation statistics
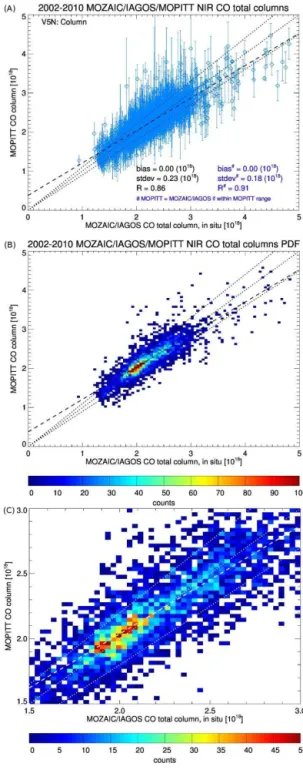
Figure 1a shows the CO total column comparison of all 8980 MOZAIC/IAGOS–MOPITT collocation pairs for the 2002–2010 period. The majority of MOZAIC/IAGOS columns fall within the MOPITT range of measurements along the profile path. Furthermore, the larger the number of MOPITT collocations for a given MOZAIC/IAGOS column, the more likely it becomes that the MOZAIC/IAGOS col-umn falls within the MOPITT range of measurements along the profile path (see Supplement Table S1). Due to the large spatial extent of a single MOZAIC/IAGOS measurement, the number of collocations for a single MOZAIC/IAGOS pro-file measurement can be as large as 46 MOPITT measure-ments. The variability in MOPITT CO total columns along the MOZAIC/IAGOS flight path is represented by the ver-tical bars in Fig. 1a. The results indicate that MOPITT CO variability is very large along the MOZAIC/IAGOS profile path, and this range is larger than the one seen in the compar-ison with the NOAA aircraft data as presented in Deeter et al. (2013; their Fig. 4). Nevertheless, the correlation between MOPITT and MOZAIC/IAGOS CO total columns is still similar between both studies and the bias is slightly smaller (see Table 1).
Due to the large spread of MOPITT CO total columns along the MOZAIC/IAGOS profile path, we also recal-culated the statistics using the following procedure (the so-called “range” data): if the MOZAIC/IAGOS column falls within the range of MOPITT columns along the MOZAIC/IAGOS profile path, we assume that there is no MOPITT bias (in practice one sets the average MOPITT column along the MOZAIC/IAGOS profile path equal to the MOZAIC/IAGOS column). Although by far not a per-fect method to account for the CO total column variability along the MOZAIC/IAGOS profile path, this method pro-vides a first-order estimate of how sub-MOZAIC/IAGOS profile path CO variability affects the validation. When tak-ing this into account, the statistics of the comparison be-tween MOPITT and MOZAIC/IAGOS become very simi-lar to those from Deeter et al. (2013), showing that results are sensitive to the CO total column variability along the MOZAIC/IAGOS profile path.
The scatter distribution shown in Fig. 1b and c provides a better view of the measurement density of Fig. 1a. Most of the MOPITT measurements are actually close to the MOZAIC/IAGOS measurements, and near the 1:1 line.
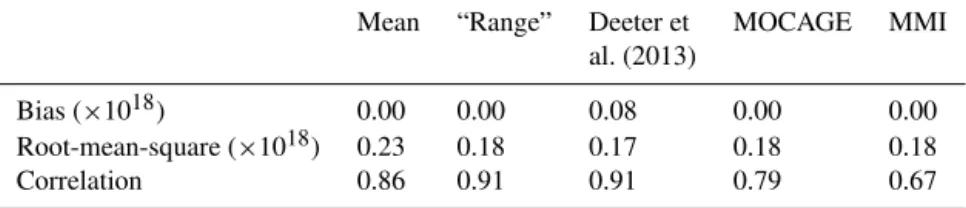
Table 1.Statistics of MOPITT-MOZAIC/IAGOS CO total column comparison for the 2002–2010 period as well as similar validation results from Deeter et al. (2013). For the “mean” comparison, the average of all MOPITT measurements along the MOZAIC/IAGOS profile path is taken. For the “range” comparison, it is assumed that if the MOZAIC/IAGOS column falls within the range of MOPITT total column measurements along the MOZAIC/IAGOS flight path, the MOPITT column equals the MOZAIC/IAGOS column. The last two columns show results from the MOCAGE model simulation sampled for MOPITT/MOZAIC/IAGOS collocations as discussed in Sect. 5 and shown in Fig. 7 (MOCAGE), and the corresponding results for the comparison between MOPITT and MOZAIC/IAGOS (MMI) during the same period and for the same region. Note that the MOCAGE model simulation only covers two 3-month periods in 2003 and 2004. Bias and root-mean-square values are in 1018molecules cm−2.
Mean “Range” Deeter et MOCAGE MMI al. (2013)
Bias (×1018) 0.00 0.00 0.08 0.00 0.00
Root-mean-square (×1018) 0.23 0.18 0.17 0.18 0.18
Correlation 0.86 0.91 0.91 0.79 0.67
Figure 2a shows the time series of all MOZAIC/IAGOS–MOPITT collocation differences. As already indicated in Fig. 1a, there is a considerable variabil-ity in differences for individual comparisons. Nevertheless, calculating the drift based on an ordinary linear regression indicates no statistically significant drift (2σ) in the differ-ences over the period 2002–2010 which is consistent with results from Deeter et al. (2013; see Table 1). Figure 2b shows similar results as in Fig. 2a but for monthly means. Indicated in Fig. 2b is also the number of measurements that constitute the monthly mean. The use of monthly means reduces the variability to a large extent. The regres-sion statistics still indicate no statistically significant drift in the differences, despite considerable month-to-month differences.
To further investigate the MOZAIC/IAGOS–MOPITT comparison, the same analysis was performed for four dif-ferent areas: Europe (Fig. 2c, d), North America (Fig. 2e, f), Asia (Fig. 2g, h) and the rest of the world (Fig. 2i, j). The corresponding time series for a select number of represen-tative airports can be found in Supplement Figs. S1 and S2. Table 2 summarizes the results of the regressions for these regions. For North America, no statistically significant drift in the differences is detected. For Europe we see a statisti-cally significant but very small drift in the raw data but not in the monthly mean data. Note that the significance level of the regression is smaller for the raw data than for the monthly mean data, despite a much larger range in the raw data. This suggests that the use of a standard linear regression is not fully appropriate for the raw data.
For Asia, a statistically significant drift in the differences of−0.04±0.02 1018molecules cm−2is detected in both raw
and monthly mean data. For the rest of the world, excluding Windhoek to avoid that Windhoek dominates the statistics as Windhoek by far provides the most measurement points and has a particularly strong seasonal cycle and thus large range of column values (see Supplement Table S2), there is no significant drift in both the raw data and the monthly mean data.
The data density for Asia is much smaller than for Europe or North America (see probability distributions in Fig. 2d and f). In particular, after 2006 only data from Hyderabad are available. Since Hyderabad shows a small negative bias (see Supplement Fig. S2-F), it is likely that the drift for Asia is artificial. To test this idea, the regression statistics were calculated after correcting the Hyderabad data for bias com-pared to MOZAIC/IAGOS and results are included in Ta-ble 2. Clearly, the drift becomes insignificant after correcting for the Hyderabad bias, confirming that care has to be taken with calculating drifts based on combined data.
4 Individual station data
845
853
858
Table 2.Regression statistics of MOZAIC/IAGOS–MOPITT differences for the period 2002–2010 for all data (Raw) as well as monthly means. For North America, data from the airports of Philadelphia, New York, Washington, Toronto, Montreal, Dallas, Atlanta, Vancouver, Portland and Los Angeles are used. For Europe, data from Frankfurt, Munich, Vienna and London are used. For Asia, data from Osaka, Tokyo, Beijing, Hyderabad and Teheran are used. Values are in molecules cm−2year−1, uncertainties denote the 1σvalue. Figure 2c–j show the figures corresponding to the North America, Europe, Asia and world data in a similar fashion as Fig. 2a and b. Rest-of-the-world data combine all locations not covered by the North America, Europe and Asia statistics and also exclude Windhoek, Namibia.
Raw Monthly Deeter et al. (2013)
Global 0.005±0.003×10¹⁸ 0.003±0.008×10¹⁸ −0.003±0.004×10¹⁸ North America 0.009±0.007×10¹⁸ 0.007±0.011×10¹⁸
Europe 0.014±0.004×10¹⁸ −0.001±0.008×10¹⁸ Asia −0.040±0.013×10¹⁸ −0.044±0.022×10¹⁸ Asia1 −0.007±0.013×10¹⁸ −0.013±0.036×10¹⁸ Rest2 0.006±0.008×10¹⁸ 0.014±0.020×10¹⁸
1Drift statistics after correcting for the Hyderabad bias. 2Drift statistics without Windhoek, Namibia.
’range’
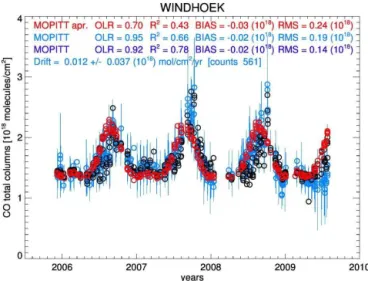
Figure 3.Time series of CO total columns at Windhoek, Namibia, for MOZAIC/IAGOS (black) as well as the MOPITT measurements (blue) and the MOPITT a priori (red). The MOPITT measurements show the mean (circle) and the range of MOPITT measurements (line) that coincide with a single MOZAIC/IAGOS measurement. The statistics represent the Ordinary Linear Regression (OLR) co-efficient, the explained variance (square of correlation coefficient: R2), the bias and the root-mean-square (RMS) differences. For the dark blue statistics (so-called “range”), we assume that if the MOZAIC/IAGOS column falls within the range of MOPITT total column measurements along the MOZAIC/IAGOS flight path, the MOPITT column equals the MOZAIC/IAGOS column. The drift statistics are calculated for the basic MOZAIC/IAGOS–MOPITT comparison without consideration of the MOPITT range along the MOZAIC/IAGOS flight path.
this period. Overall, the agreement between MOPITT and MOZAIC/IAGOS is very good for this particular location: the bias is insignificant, the root-mean-square difference is approximately 10 % of the mean column and the correla-tion is 0.66 (R2), while the statistics improve when taking
the MOPITT flight path variability into account (R2=0.78; smaller root-mean-square difference).
Figure 4a–c show the statistics of the 35 airports with most collocations. Indicated are three parameters: correlation (a), bias (b) and root-mean-square differences (c). Each statistic is calculated for the average MOPITT column, the adjusted average MOPITT columns based on the observed MOPITT variability along the flight path (“range” data, see Sect. 3), and the MOPITT a priori.
In general, correlations are moderate to high, typically be-tween 0.6 and 0.9, and the statistics for the MOPITT “range” data are 0.05 to 0.1 points higher than for the average MO-PITT data. However, correlations between MOZAIC/IAGOS and the MOPITT a priori are comparable to those between MOZAIC/AGOS and MOPITT measurements themselves, which is not surprising given that the MOPITT a priori is based on a 3-D climatology from a chemistry-transport model simulation and includes the seasonal cycle of CO which is the dominant mode of multi-year CO total column variability. Biases are generally smaller for the MOPITT data compared to the MOPITT a priori, and considerably smaller than the root-mean-square differences. Note that none of the drifts found for individual stations are statistically significant (see Supplement Figs. S1 and S2), confirming the results of the drifts calculated for the global and continental data shown in Fig. 2a–j.
Comparing the correlations and root-mean-square differ-ences for the MOPITT a priori and the MOPITT “range” data shows that for about 60 % of the cases the MOPITT “range” data statistics are better than the ones of the MOPITT a priori data (see also Supplement Table 2). Thus, for about 40 % of the stations, even the MOPITT “range” data do not outper-form the MOPITT a priori.
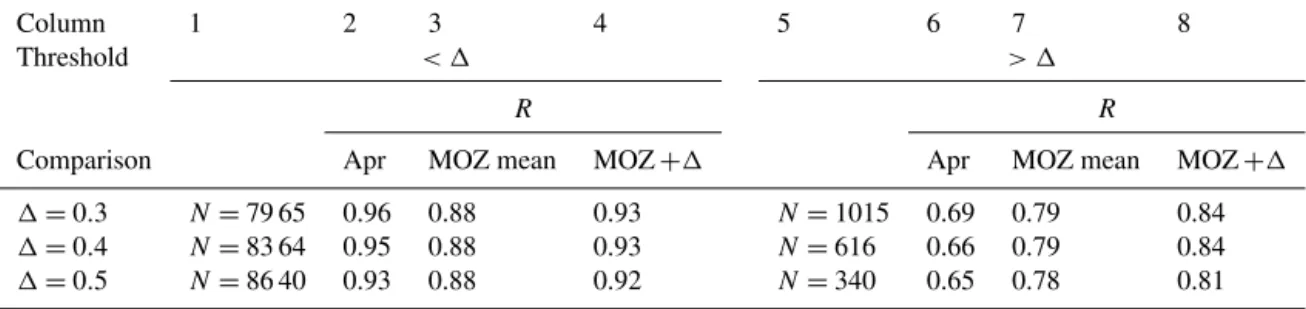
Table 3.Correlation statistics of the comparison between MOPITT and MOZAIC/IAGOS. The sigma value (1018molecules cm−2) indicates the absolute threshold difference between MOZAIC/IAGOS and the MOPITT a priori for which the statistics are calculated. The “Threshold” row indicates whether the statistics are calculated based on the data selection for which the difference between MOZAIC/IAGOS and MOPITT a priori CO total columns is above or below the chosen threshold difference (1=0.3/0.4/0.5). The “Comparison” row indicates for which comparison the statistics are calculated (MOPITT a priori, “Apr”, or MOZAIC/IAGOS, “MOZ”). Furthermore, a distinction is made between whether the mean MOPITT CO total column along the MOZAIC/IAGOS profile path is used (mean) or the MOPITT CO total columns after taking the MOPITT NIR column variability along the MOZAIC/IAGOS profile path into account (Range), as described in Sect. 3.
Column 1 2 3 4 5 6 7 8
Threshold < 1 > 1
R R
Comparison Apr MOZ mean MOZ+1 Apr MOZ mean MOZ+1
1=0.3 N=79 65 0.96 0.88 0.93 N=1015 0.69 0.79 0.84
1=0.4 N=83 64 0.95 0.88 0.93 N=616 0.66 0.79 0.84
1=0.5 N=86 40 0.93 0.88 0.92 N=340 0.65 0.78 0.81
between the MOPITT a priori and MOZAIC/IAGOS, some-thing which is preferred, as otherwise the measurements would not add much to the a priori information.
However, a number of issues must be considered here. First of all, the MOPITT a priori is based on chemistry-transport model simulations of the MOZART model and in-cludes seasonal variations, which is the most important vari-ability in multi-year CO total column variations. Further-more, MOPITT measurements themselves have errors which complicate matters. As a thought experiment, if the MOPITT a priori would perfectly match reality, the MOPITT retrieval would only worsen the measurement due to MOPITT errors from for example instrumental and calibration uncertainties, errors in retrieval parameters and imperfect retrieval method-ologies.
To check whether MOPITT NIR measurements add value compared to the MOPITT a priori, one approach is to investi-gate the biases of the comparison between MOPITT and IA-GOS/MOZAIC. Figure 4b shows that when comparing MO-PITT with MOZAIC/IAGOS the majority of biases are – in the absolute sense – smaller for the MOPITT measurements comparison relative to the MOPITT a priori comparison by a factor of 2 or more (see also Table S2B).
A different approach for evaluating the added value of MOPITT NIR measurements is by assessing those situ-ations where the MOZAIC/IAGOS measurements deviate significantly from the MOPITT a priori. It could be ex-pected that particularly in those situations – the a priori de-viates from reality – MOPITT adds information to the a priori. Based on an analysis similar to the one performed for Fig. 1 we checked the comparison of the MOPITT NIR and MOZAIC/IAGOS measurements for cases where the MOZAIC/IAGOS measurements deviated – in the absolute sense – more than 0.3/0.4/0.5 1018 molecules cm−2 from the MOPITT a priori (corresponding fractions of measure-ments qualifying for these filters are 11, 7 and 4 % of the
to-tal number of MOZAIC/IAGOS measurements, respectively; see also Table 3). These are clearly the “outliers” for which one would expect MOPITT measurements to outperform the MOPITT a priori.
Table 3 shows the results of that comparison: for MOZAIC/IAGOS–MOPITT a priori differences within the threshold range (< 1), the correlations between MOZAIC/IAGOS and the MOPITT a priori (0.93–0.96) are slightly better than the correlations between MOZAIC/IAGOS and the MOPITT NIR measurements (0.88–0.93; columns 3 and 4 in Table 3). However, cor-relations are very high and differences in the correlation coefficients are small (0.01–0.08). On the other hand, for MOZAIC/IAGOS–MOPITT a priori differences outside the threshold (> 1) range the MOPITT NIR measurements clearly outperform the MOPITT a priori: differences in correlation coefficients are 0.15–0.18 larger depending on the threshold value (columns 6/8 in Table 3) for MOPITT NIR measurements compared to the MOPITT a priori. Even the MOPITT measurements that are not corrected for the MOZAIC/IAGOS flight path variability outperform the MOPITT a priori by 0.1–0.13 according to their correlation (columns 6 and 7 in Table 3). This analysis shows that the MOPITT NIR measurements do “add value” to the MOPITT a priori for those conditions where one would expect this to occur.
5 Model analysis: representation error
–
Figure 5. MOCAGE regional chemistry-transport model domain and corresponding MOZAIC/IAGOS profile measurements (flights paths; red) that were made during the two periods for which the MOCAGE simulations were available (June 2003–August 2003 and November 2003–January 2004).
commonly applied for validation of spaceborne vertical pro-files during scientific field campaigns employing aircraft can-not be done. To get some indication of the effect the long hor-izontal distance covered by MOZAIC/IAGOS profiles has on comparisons with satellite CO total column measurements, we present results of a spatio-temporal high-resolution sim-ulation by the MOCAGE model.
The simulations we analyse here were performed for the ISOTROP initiative. The simulation consists of two periods: June 2003–August 2003 and November 2003–January 2004 for a regional domain over Europe (Fig. 5; 16◦W–36◦E,
32◦N–72◦N). For the MOZAIC/IAGOS profile measure-ments made during this period and this region, the corre-sponding modelled CO concentrations collocated in space and time were determined, as well as the MOCAGE pro-files collocated with the MOZAIC/IAGOS flight path. Fig-ure 5 shows all MOZAIC/IAGOS flight paths at the model grid. Clearly the flight paths cover multiple model grids. The model results thus should provide a realistic estimate of the CO variability along MOZAIC/IAGOS flight paths.
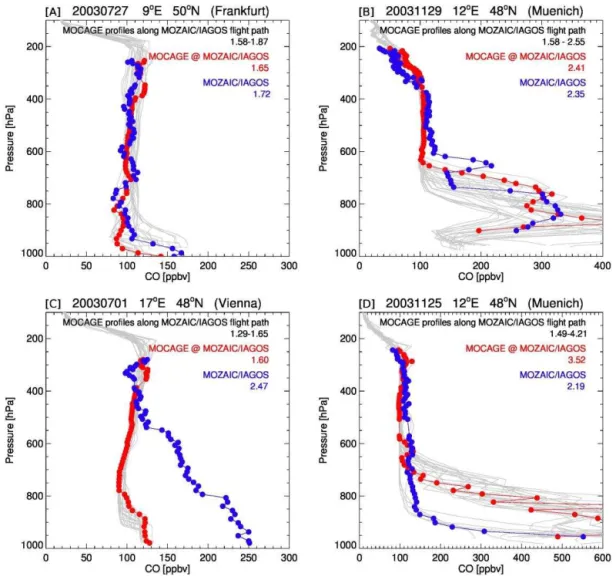
Figure 6 shows an example of contrasting comparisons of MOZAIC/IAGOS and MOCAGE vertical profiles. Indicated in red are MOCAGE results for the true comparison with MOZAIC/IAGOS, and in grey the MOCAGE profiles collo-cated with the MOZAIC/IAGOS profile path. Note that over-all, CO is underestimated in MOCAGE based on the compar-ison with MOZAIC/IAGOS, a common feature in chemistry-transport modelling (i.e. Shindell et al., 2006). The upper graphs (A, B) show two situations where there is relatively good agreement between MOCAGE and MOZAIC/IAGOS, the lower panels (C, D) show two situations where the agree-ment is much worse. The left plots (A, C) show situations where MOCAGE suggests small sub-MOZAIC/IAGOS
pro-file path variability, and the right plots (B, D) show situa-tions where MOCAGE suggests large sub-MOZAIC/IAGOS profile path variability. Clearly situations can differ very much from time to time and location to location. The dif-ference between modelled and measured CO profile in plot C is likely related to Boreal forest fires. Summer 2003 was an active forest fire season in Siberia, in particular during May and June (Yurganov et al., 2005), and CO from these fires can quickly spread over the entire Northern Hemi-sphere (Damoah et al., 2004; Jaffe et al., 2004; Bertschi and Jaffe, 2005). However, the boundary conditions for the MOCAGE simulations are derived from a global simulation using monthly mean emissions, and cannot resolve plumes from single fires. Keep in mind that it is beyond the scope of this paper to analyse in detail the origin of differences be-tween the MOCAGE simulation and MOZAIC/IAGOS (for example, Fig. 6c). We simply note here that, based on the comparison with MOZAIC/IAGOS, on average MOCAGE underestimates boundary layer CO by approximately 30 % and free tropospheric CO up to 300 hPa by approximately 15 % (for the period investigated in the study).
Figure 7 shows the comparison between MOCAGE to-tal columns based on the MOCAGE CO profiles along the MOZAIC/IAGOS flight path, and MOCAGE total columns based on MOCAGE CO profiles collocated with the MOZAIC/IAGOS flight path (similar to the compari-son in Figs. 1 and 2). For convenience the corresponding MOZAIC/IAGOS CO total columns are also shown in red. The comparison shows that, similar to what was seen in the MOZAIC/IAGOS–MOPITT comparison in Figs. 1 and 2, there is a considerable spread among collocated MOCAGE total columns. The root-mean-square differences are simi-lar to what was derived for the MOZAIC/IAGOS–MOPITT comparison. The correlation is somewhat smaller (0.79, com-pared to 0.91) due to the fact that the MOCAGE simulation does not cover a complete season and thus does not repre-sent the full range of CO columns over the course of a sea-son, as also indicated by the lower correlation for the com-parison between MOPITT and MOZAIC/IAGOS for this re-gion and during this period (see column MMI in Table 1). Nevertheless, the statistical similarity between the model re-sults and the MOZAIC/IAGOS–MOPITT comparison indi-cates that the spread among MOZAIC/IAGOS collocated MOPITT NIR columns is indeed very likely related to CO variability.
6 Summary, conclusions and discussion
Figure 6.Comparisons between MOZAIC/IAGOS and MOCAGE CO profile measurements. The MOCAGE profiles collocated with the MOZAIC/IAGOS profile path are displayed in grey, the MOCAGE profile simulations exactly collocated with MOZAIC/IAGOS is in red. The corresponding MOZAIC/IAGOS profile is shown in blue. Indicated are also the date, the approximate geographical location of the MOZAIC/IAGOS profile measurement including departure or landing airport and the values of partial columns for the MOZAIC/IAGOS profile as well as the corresponding MOCAGE profile along the MOZAIC/IAGOS profile and the range of MOCAGE partial columns along the MOZAIC/IAGOS profile path (in 1018molecules cm−2).
of 0.23 1018molecules cm−2 and no bias. When taking the MOPITT observed flight path CO column variability into account these numbers are 0.91 for the correlation, 0.18 1018molecules cm−2 for the root-mean-square differ-ences and no bias. For Deeter et al. (2013) these num-bers are a correlation of 0.91 and a root-mean-square dif-ference of 0.18 1018molecules cm−2, and a bias of 0.08 1018molecules cm−2. No MOPITT V5 NIR bias was iden-tified and no long-term drift – indicative for MOPITT calibration errors – was found, consistent with Deeter et al. (2013). In addition, correlations were similar, and also on regional scales no biases and drifts were found for the MO-PITT–MOZAIC/IAGOS comparison.
Because MOPITT V5 NIR measurements are to some ex-tent determined by the MOPITT a priori, it was also
– – Figure 7.Comparison of all MOCAGE and MOZAIC/IAGOS par-tial CO column measurements made for the periods June 2003–Au-gust 2003 and November 2003–January 2004. No attempt was made to extend the profiles beyond the maximum measurement height; columns here thus represent partial columns. The horizontal axis shows the MOCAGE column based on the MOZAIC/IAGOS profile path collocations, the vertical axis shows the correspond-ing MOZAIC/IAGOS total column (red) and the MOCAGE CO columns collocated with the MOZAIC/IAGOS flight path profile (blue), the latter for which the statistics are also printed.
MOZAIC/IAGOS were – in absolute sense – smaller by a factor of 2 or more than biases between the MOPITT a priori and MOZAIC/IAGOS.
Validation of MOPITT measurements against MOZAIC/IAGOS measurements is hampered by the spatial footprint of MOZAIC/IAGOS measurements. The vertical profile of MOZAIC/IAGOS measurements ob-tained during take-off or landing of commercial aircraft typically covers between 200 and 400 km. Results from high spatio-temporal simulations by the regional chemistry-transport model MOCAGE over Europe and collocated with MOZAIC/IAGOS measurements indicate that indeed there can be large variability in CO columns along the MOZAIC/IAGOS profile path. The CO column based on the MOZAIC/IAGOS profile measurements is thus not fully representative of the true vertical CO column, and this representation error has to be kept in mind. A comparison of MOPITT and MOZAIC/IAGOS using a simple methodol-ogy to assess this representation error indeed shows similar variability. However, there is no uniform general method to quantify the representation error. This error is location spe-cific and depends on typical atmospheric transport patterns, and proximity of emission sources. It is therefore advised to carefully consider use of MOZAIC/IAGOS station by station.
The MOZAIC/IAGOS measurements nevertheless pro-vide a highly valuable data set for validation of MOPITT
NIR CO total column measurements as they cover the en-tire MOPITT measurement period and provide information for locations not covered by the validation results presented in Deeter et al. (2013; only North America). Care has to be taken when comparing single MOZAIC/IAGOS mea-surements with MOPITT meamea-surements due to the differ-ent air masses sampled. In addition, although the represen-tation error of CO total column measurements based on MOZAIC/IAGOS data is not crucial for the comparison of CO total columns, use of MOZAIC/IAGOS measurements of for example ozone (O3) or nitrogen dioxide (NO2) to val-idate tropospheric ozone column measurements from satel-lites may be more sensitive to this representation error due to, for example, larger spatio-temporal variability.
Finally, it is worth mentioning that recent advances in as-similation of satellite measurements of CO can be useful for the validation of MOPITT CO. The assimilation results pro-vide information that can be compared with both satellite as well as in situ measurements. Hence, they may bridge the “representation gap” between satellite and in situ measure-ments.
The Supplement related to this article is available online at doi:10.5194/amt-7-3783-2014-supplement.
Acknowledgements. The MOCAGE model simulation used in this study were performed within the ESA-ISOTROP project (European Space Agency – Impact of Spaceborne Observations on Tropospheric Composition Analysis and Forecast), ESA project 2012–2014, ESA Contract No: 4000105743.
Edited by: M. Portabella
References
Bertschi, I. T. and Jaffe, D. A.: Long-range transport of ozone, carbon monoxide, and aerosols to the NE Pacific troposphere during the summer of 2003: Observations of smoke plumes from Asian boreal fires, J. Geophys. Res., 110, D05303, doi:10.1029/2004JD005135, 2005.
Buchwitz, M., de Beek, R., Bramstedt, K., Noël, S., Bovensmann, H., and Burrows, J. P.: Global carbon monoxide as retrieved from SCIAMACHY by WFM-DOAS, Atmos. Chem. Phys., 4, 1945–1960, doi:10.5194/acp-4-1945-2004, 2004.
Buchwitz, M., de Beek, R., Noël, S., Burrows, J. P., Bovensmann, H., Schneising, O., Khlystova, I., Bruns, M., Bremer, H., Berga-maschi, P., Körner, S., and Heimann, M.: Atmospheric carbon gases retrieved from SCIAMACHY by WFM-DOAS: version 0.5 CO and CH4and impact of calibration improvements on CO2 retrieval, Atmos. Chem. Phys., 6, 2727–2751, doi:10.5194/acp-6-2727-2006, 2006.
comparison with MOPITT and first results related to the de-tection of enhanced CO over cities, Atmos. Chem. Phys., 7, 2399–2411, doi:10.5194/acp-7-2399-2007, 2007.
Cathala, M.-L., Pailleux, J., and Peuch, V.-H.: Improving chemical simulations of the upper troposphere – lower stratosphere with sequential assimilation of MOZAIC data, Tellus B, 55, 1–10, 2003.
Clark, H. L., Cathala, M.-L., Teyssèdre, H., Cammas, J.-P., and Peuch, V.-H.: Cross- tropopause fluxes of ozone using assimi-lation of MOZAIC observations in a global CTM, Tellus, B, 59, 39–49, 2007.
Crutzen, P. J. and Zimmermann, P. H.: The changing photochem-istry of the troposphere, Tellus A/B, 43, 136–151, 1991. Dalsøren, S. B. and Isaksen, I. S. A.: CTM study of
changes in tropospheric hydroxyl distribution 1990–2001 and its impact on methane, Geophys. Res. Lett., 33, L23811, doi:10.1029/2006GL027295, 2006.
Damoah, R., Spichtinger, N., Forster, C., James, P., Mattis, I., Wandinger, U., Beirle, S., Wagner, T., and Stohl, A.: Around the world in 17 days – hemispheric-scale transport of forest fire smoke from Russia in May 2003, Atmos. Chem. Phys., 4, 1311–1321, doi:10.5194/acp-4-1311-2004, 2004.
Deeter, M. N., Edwards, D. P., Gille, J. C., and Drummond, J. R.: CO retrievals based on MOPITT near-infrared observations, J. Geophys. Res., 114, D04303, doi:10.1029/2008JD010872, 2009. Deeter, M., Edwards, D. P., Gille, J. C., Emmons, L., Francis, G. L., Ho, S.-P., Mao, D. Y., Worden, H. M., Drummond, J. R., and Novelli, P. C.: The MOPITT version 4 CO product: Algorithm enhancements, validation, and long-term stability, J. Geophys. Res., 115, D07306, doi:10.1029/2009JD013005, 2010.
Deeter, M. N., Worden, H. M., Gille, J. C., Edwards, D. P., Mao, D., and Drummond, J. R.: MOPITT multispectral CO retrievals: Origins and effects of geophysical radiance errors, J. Geophys. Res., 116, D15303, doi:10.1029/2011JD015703, 2011.
Deeter, M. N., Martínez-Alonso, S., Edwards, D. P., Emmons, L. K., Gille, J. C., Worden, H. M., Pittman, J. V., Daube, B. C., and Wofsy, S. C.: Validation of MOPITT Version 5 thermal-infrared, near-thermal-infrared, and multispectral carbon monoxide pro-file retrievals for 2000–2011, J. Geophys. Res. Atmos., 118, 6710–6725, 2013.
de Laat, A. T. J., Dijkstra, R., Schrijver, H., Nédélec, P., and Aben, I.: Validation of six years of SCIAMACHY carbon monox-ide observations using MOZAIC CO profile measurements, At-mos. Meas. Tech., 5, 2133–2142, doi:10.5194/amt-5-2133-2012, 2012.
Denier van der Gon, H. A. C., Visschedijk, A., van den Brugh, H., and Droge, R., and Vorhaben, F&E: “Strategien zur Vermin-derung der Feinstaubbelastung” – PAREST: a high resolution European emission data base for the year 2005, TNO-Report, TNO-034-UT-2010-01895_RPT-ML, Utrecht, 2010.
Dils, B., De Mazière, M., Müller, J. F., Blumenstock, T., Buchwitz, M., de Beek, R., Demoulin, P., Duchatelet, P., Fast, H., Franken-berg, C., Gloudemans, A., Griffith, D., Jones, N., Kerzenmacher, T., Kramer, I., Mahieu, E., Mellqvist, J., Mittermeier, R. L., Notholt, J., Rinsland, C. P., Schrijver, H., Smale, D., Strandberg, A., Straume, A. G., Stremme, W., Strong, K., Sussmann, R., Tay-lor, J., van den Broek, M., Velazco, V., Wagner, T., Warneke, T., Wiacek, A., and Wood, S.: Comparisons between SCIAMACHY and ground-based FTIR data for total columns of CO, CH4, CO2
and N2O, Atmos. Chem. Phys., 6, 1953–1976, doi:10.5194/acp-6-1953-2006, 2006.
Dufour, A., Amodei, M., Ancellet, G., and Peuch, V.-H.: Observed and modelled “chemical weather” during ESCOMPTE, Atmos. Res., 74 , 161–189, 2004.
El Amraoui, L., Peuch, V.-H., Ricaud, P., Massart, S., Semane, N., Teyssèdre, H., Cariolle, D., and Karcher, F.: Ozone loss in the 2002/2003 Arctic vortex deduced from the Assimilation of Odin/SMR O3 and N2O measurements: N2O as a dynamical tracer, Q. J. Roy. Meteor. Soc., 134, 217–228, 2008a.
El Amraoui, L., Semane, N., Peuch, V.-H., and Santee, M. L.: Inves-tigation of dynamical processes in the polar stratospheric vortex during the unusually cold winter 2004/2005, Geophys. Res. Lett., 35, L03803, doi:10.1029/2007GL031251, 2008b.
El Amraoui, L., Attié, J.-L., Semane, N., Claeyman, M., Peuch, V.-H., Warner, J., Ricaud, P., Cammas, J.-P., Piacentini, A., Josse, B., Cariolle, D., Massart, S., and Bencherif, H.: Midlatitude stratosphere – troposphere exchange as diagnosed by MLS O3 and MOPITT CO assimilated fields, Atmos. Chem. Phys., 10, 2175–2194, doi:10.5194/acp-10-2175-2010, 2010.
Elguindi, N., Clark, H., Ordóñez, C., Thouret, V., Flemming, J., Stein, O., Huijnen, V., Moinat, P., Inness, A., Peuch, V.-H., Stohl, A., Turquety, S., Athier, G., Cammas, J.-P., and Schultz, M.: Cur-rent status of the ability of the GEMS/MACC models to repro-duce the tropospheric CO vertical distribution as measured by MOZAIC, Geosci. Model Dev., 3, 501–518, doi:10.5194/gmd-3-501-2010, 2010.
Emmons, L. K., Walters, S., Hess, P. G., Lamarque, J.-F., Pfister, G. G., Fillmore, D., Granier, C., Guenther, A., Kinnison, D., Laepple, T., Orlando, J., Tie, X., Tyndall, G., Wiedinmyer, C., Baughcum, S. L., and Kloster, S., Description and evaluation of the Model for Ozone and Related chemical Tracers, version 4 (MOZART-4), Geosci. Model Dev., 3, 43–67, doi:10.5194/gmd-3-43-2010, 2010.
Ghude, S. D., Beig, G., Kulkarni, P. S., Kanawade, V. P., Fadnavis, S., Remedios, J. J., and Kulkarni, S. H.: Regional CO pollu-tion over the Indian-subcontinent and various transport pathways as observed by MOPITT, Int. J. Remote Sens., 32, 6133–6148, 2011.
Gloudemans, A. M. S., Krol, M. C., Meirink, J. F., de Laat, A. T. J., van der Werf, G. R., Schrijver, H., van den Broek, M. M. P., and Aben, I.: Evidence for long-range transport of carbon monoxide in the Southern Hemisphere from SCIAMACHY observations, Geophys. Res. Lett., 33, L16807, doi:10.1029/2006GL026804, 2006.
Gloudemans, A. M. S., Schrijver, H., Hasekamp, O. P., and Aben, I.: Error analysis for CO and CH4 total column retrievals from SCIAMACHY 2.3 ?m spectra, Atmos. Chem. Phys., 8, 3999–4017, doi:10.5194/acp-8-3999-2008, 2008.
Guerova, G., Bey, I., Attié, J.-L., Martin, R. V., Cui, J., and Sprenger, M.: Impact of transatlantic transport episodes on sum-mertime ozone in Europe, Atmos. Chem. Phys., 6, 2057–2072, doi:10.5194/acp-6-2057-2006, 2006.
Inness, A., Baier, F., Benedetti, A., Bouarar, I., Chabrillat, S., Clark, H., Clerbaux, C., Coheur, P., Engelen, R. J., Errera, Q., Flem-ming, J., George, M., Granier, C., Hadji-Lazaro, J., Huijnen, V., Hurtmans, D., Jones, L., Kaiser, J. W., Kapsomenakis, J., Lefever, K., Leitão, J., Razinger, M., Richter, A., Schultz, M. G., Simmons, A. J., Suttie, M., Stein, O., Thépaut, J.-N., Thouret, V., Vrekoussis, M., Zerefos, C., and the MACC team: The MACC reanalysis: an 8 yr data set of atmospheric composition, Atmos. Chem. Phys., 13, 4073–4109, doi:10.5194/acp-13-4073-2013, 2013.
Jaffe, D., Bertschi, I., Jaeglé, L., Novelli, P., Reid, J. S., Tanimoto, H., Vingarzan, R., and Westphal, D. L.: Long-range transport of Siberian biomass burning emissions and impact on surface ozone in western North America, Geophys. Res. Lett., 31, L16106, doi:10.1029/2004GL020093, 2004.
Josse, B., Simon, P., and Peuch, V.-H.: Radon global simulation with the multiscale chemistry transport model MOCAGE, Tel-lus, 56, 339–356, 2004.
Kuenen, J., Denier van der Gon, H., Visschedijk, A., van der Brugh, H., and van Gijlswijk, R.: MACC European emission inventory for the years 2003–2007, TNO report, TNO-060-UT-5, 2011-00588, Utrecht, 2011.
Konovalov, I. B., Beekmann, M., Kuznetsova, I. N., Yurova, A., and Zvyagintsev, A. M.: Atmospheric impacts of the 2010 Russian wildfires: integrating modelling and measurements of an extreme air pollution episode in the Moscow region, Atmos. Chem. Phys., 11, 10031–10056, doi:10.5194/acp-11-10031-2011, 2011. Marenco, A., Thouret, V., Nédélec, P., Smit, H., Helten, M.,
Kley, D., Karcher, F., Simon, P., Law, K., Pyle, J., Poschmann, G., Wrede, R. V., Hume, C., and Cook, T.: Measurements of ozone and water vapour by Airbus in-service aircraft: The MOZAIC airborne program, An overview, J. Geophys. Res., 103, 25631–25642, 1998.
Michou M., Laville, P., Serça, D., Fotiadi, A., Bouchou, P., and Peuch, V.-H.: Measured and modeled dry deposition velocities over the ESCOMPTE area, Atmos. Res., 74 , 89–116, 2005. Montzka, S. A., Krol, M., Dlugokencky, E., Hall, B., Jöckel, P.,
and Lelieveld, J.: Small Interannual Variability of Global Atmo-spheric Hydroxyl, Science, 331, 67–69, 2011.
Nam, J., Wang, Y., Luo, C., and Chu, D. A.: Trans-Pacific transport of Asian dust and CO: accumulation of biomass burning CO in the subtropics and dipole structure of transport, Atmos. Chem. Phys., 10, 3297–3308, doi:10.5194/acp-10-3297-2010, 2010. Nédélec, P., Cammas, J.-P., Thouret, V., Athier, G., Cousin, J.-M.,
Legrand, C., Abonnel, C., Lecoeur, F., Cayez, G., and Marizy, C.: An improved infrared carbon monoxide analyser for routine measurements aboard commercial Airbus aircraft: technical vali-dation and first scientific results of the MOZAIC III programme, Atmos. Chem. Phys., 3, 1551–1564, doi:10.5194/acp-3-1551-2003, 2003.
Peuch, V.-H., Amodei, M., Barthet, T., Cathala, M.-L., Josse, B., Michou, M., and Simon, P.: MOCAGE, MOdèle de Chimie At-mosphérique à Grande Echelle , Proceedings of Météo-France workshop on atmospheric modelling, 33–36, 1999.
Pradier, S., Attié, J.-L., Chong, M., Escobar, J., Peuch, V.-H., Lamarque, J.-F., Kattatov, B., and Edwards, D.: Evaluation of 2001 springtime CO transport over West Africa using MOPITT CO measurements assimilated in a global chemistry transport model, Tellus B, 58, 163–176, 2006.
Ricaud, P., Attié, J.-L., Teyssèdre, H., El Amraoui, L., Peuch, V.-H., Matricardi, M., and Schluessel, P.: Equatorial total column of nitrous oxide as measured by IASI on MetOp-A: implications for transport processes, Atmos. Chem. Phys., 9, 3947–3956, doi:10.5194/acp-9-3947-2009, 2009a.
Ricaud, P., Pommereau, J.-P., Attié, J.-L., Le Flochmoen, E., El Am-raoui, L., Teyssèdre, H., Peuch, V.-H., Feng, W., and Chipper-field, M. P.: Equatorial transport as diagnosed from nitrous oxide variability, Atmos. Chem. Phys., 9, 8173–8188, doi:10.5194/acp-9-8173-2009, 2009b.
Rodgers, C. D. (Ed.): Inverse methods for atmospheric sounding: theory and practice, Series on Atmospheric Oceanic and Plane-tary Physics, World Scientific Publishing, Singapore, 2, 256 pp., ISBN: 9789812813718, 2000.
Semane, N., Peuch, V.-H., El Amraoui, L., Bencherif, H., Massart, S., Cariolle, D., Attié, J.-L., and Abida, R.: An observed and analysed stratospheric ozone intrusion over the high Canadian Arctic UTLS region during the summer of 2003, Q. J. Roy. Me-teor. Soc., 133, 171–178, 2007.
Semane, N., Peuch, V.-H., Pradier, S., Desroziers, G., El Amraoui, L., Brousseau, P., Massart, S.,Chapnik, B., and Peuch, A.: On the extraction of wind information from the assimilation of ozone profiles in Météo-France 4-D-Var operational NWP suite, At-mos. Chem. Phys., 9, 4855–4867, doi:10.5194/acp-9-4855-2009, 2009.
Shindell, D. T., Faluvegi, G., Stevenson, D. S., Krol, M. C., Emmons, L. K., Lamarque, J.-F., Petron, G., Dentener, F. J., Ellingsen, K., Schultz, M. G., Wild, O., Amann, M., Atherton, C. S., Bergmann, D. J., Bey, I., Butler, T., Cofala, J., Collins, W. J., Derwent, R. G., Doherty, R. M., Drevet, J., Eskes, H. J., Fiore, A. M., Gauss, M., Hauglustaine, D. A., Horowitz, L. W., Isaksen, I. S. A., Lawrence, M. G., Montanaro, V., Muller, J.-F., Pitari, G., Prather, M. J., Pyle, J. A., Rast, S., Rodriguez, J. M., Sanderson, M. G., Savage, N. H., Strahan, S. E., Sudo, K., Szopa, S., Unger, N., van Noije, T. P. C., and Zeng, G.: Multimodel sim-ulations of carbon monoxide: comparison with observations and projected near-future changes, J. Geophys. Res., 111, D19306, doi:10.1029/2006JD007100, 2006.
Simpson, D., Fagerli, H., Jonson, J. E., Tsyro, S., Wind, P., and Tuovinen, J. P.: Transboundary acidification, eutrophication and ground level ozone in Europe, part 1: unified EMEP model de-scription, Technical report, EMEP Report 1/2003, Norwegian meteorological Insitute, 2003.
Stein, O., Schultz, M. G., Bouarar, I., Clark, H., Huijnen, V., Gaudel, A., George, M., and Clerbaux, C.: On the wintertime low bias of Northern Hemisphere carbon monoxide in global model studies, Atmos. Chem. Phys. Discuss., 14, 245–301, doi:10.5194/acpd-14-245-2014, 2014.
Sussmann, R. and Buchwitz, M.: Initial validation of EN-VISAT/SCIAMACHY columnar CO by FTIR profile retrievals at the Ground-Truthing Station Zugspitze, Atmos. Chem. Phys., 5, 1497–1503, doi:10.5194/acp-5-1497-2005, 2005.
Warneke, T., de Beek, R., Buchwitz, M., Notholt, J., Schulz, A., Velazco, V., and Schrems, O.: Shipborne solar absorption mea-surements of CO2, CH4, N2O and CO and comparison with SCIAMACHY WFM-DOAS retrievals, Atmos. Chem. Phys., 5, 2029–2034, doi:10.5194/acp-5-2029-2005, 2005.
monoxide from space using MOPITT multispectral retrievals, J. Geophys. Res., 115, D18314, doi:10.1029/2010JD014242, 2010. Worden, H. M., Deeter, M. N., Frankenberg, C., George, M., Nichi-tiu, F., Worden, J., Aben, I., Bowman, K. W., Clerbaux, C., Co-heur, P. F., de Laat, A. T. J., Detweiler, R., Drummond, J. R., Edwards, D. P., Gille, J. C., Hurtmans, D., Luo, M., Martínez-Alonso, S., Massie, S., Pfister, G., and Warner, J. X.: Decadal record of satellite carbon monoxide observations, Atmos. Chem. Phys., 13, 837–850, doi:10.5194/acp-13-837-2013, 2013.
Yurganov, L. N., Duchatelet, P., Dzhola, A. V., Edwards, D. P., Hase, F., Kramer, I., Mahieu, E., Mellqvist, J., Notholt, J., Novelli, P. C., Rockmann, A., Scheel, H. E., Schneider, M., Schulz, A., Strandberg, A., Sussmann, R., Tanimoto, H., Velazco, V., Drum-mond, J. R., and Gille, J. C.: Increased Northern Hemispheric carbon monoxide burden in the troposphere in 2002 and 2003 detected from the ground and from space, Atmos. Chem. Phys., 5, 563–573, doi:10.5194/acp-5-563-2005, 2005.