HESSD
2, 265–288, 2005Variability in riparian zone potential and
actual evapotranspiration
R. M. Petrone et al.
Title Page
Abstract Introduction
Conclusions References
Tables Figures
◭ ◮
◭ ◮
Back Close
Full Screen / Esc
Print Version
Interactive Discussion
EGU
Hydrol. Earth Syst. Sci. Discuss., 2, 265–288, 2005 www.copernicus.org/EGU/hess/hessd/2/265/ SRef-ID: 1812-2116/hessd/2005-2-265 European Geosciences Union
Hydrology and Earth System Sciences Discussions
Variability in riparian zone potential and
actual evapotranspiration in a 1
st
order
agricultural catchment in Southern
Ontario, Canada
R. M. Petrone, C. Smith, and M. C. English
Department of Geography and Environmental Studies, Wilfrid Laurier University, Waterloo, Ontario, Canada
Received: 23 December 2004 – Accepted: 18 January 2005 – Published: 1 February 2005 Correspondence to: R. M. Petrone (rpetrone@wlu.ca)
HESSD
2, 265–288, 2005Variability in riparian zone potential and
actual evapotranspiration
R. M. Petrone et al.
Title Page
Abstract Introduction
Conclusions References
Tables Figures
◭ ◮
◭ ◮
Back Close
Full Screen / Esc
Print Version
Interactive Discussion
EGU
Abstract
Micrometeorological and hydrological measurements were made over one growing season using automatic weather stations and weighing lysimeters at several locations within a multiple land-use agricultural catchment in Southern Ontario. This paper com-pares modelled potential evapotranspiration (PET) and measured actual
evapotranspi-5
ration (AET) values obtained from the soil weighing lysimeters, and determines the spatial variability in riparian zone AET in a multiple land-use agricultural watershed in Southern Ontario. Two sites were chosen in two different riparian areas of the water-shed, representing the surface conditions dominant in the upper and lower reaches of the basin.
10
The results indicated that AET was higher in the northern end of the basin than in the southern portion of the basin, while the hydrological and energy balance compo-nents were similar at both sites. The causes of the different rates are attributed to the surrounding vegetation on adjacent fields and the differing wind regimes.
1. Introduction 15
Accurate estimates of evapotranspiration (ET) are required, and often lacking, for many management and engineering, field and modelling applications. Further, there is little information about actual ET (AET) from river basins with variable topographies and land use types, typical of temperate agricultural basins (Kotoda, 1989). This lack of information is often due to logistical costs of obtaining accurate AET measurements in
20
large, spatially variable catchments.
Evapotranspiration (ET) is extremely important in the water balance of agricultural watersheds as it can affect stream water export and moisture availability for crops. Knowledge of AET from the field is critical to estimating how much water should be applied to a particular field. However, determining the water quality of streams
com-25
HESSD
2, 265–288, 2005Variability in riparian zone potential and
actual evapotranspiration
R. M. Petrone et al.
Title Page
Abstract Introduction
Conclusions References
Tables Figures
◭ ◮
◭ ◮
Back Close
Full Screen / Esc
Print Version
Interactive Discussion
EGU
existence of the stream and associated vegetation depends on groundwater and sur-face water being accessible to the riparian vegetation. However, there remains little information available on the evaporative loss of these ecologically important strips of riparian vegetation. (Unland et al., 1998).
The riparian zone has been defined as an area where groundwater interacts with
5
surface water and vegetation (Odum, 1971). There are direct and indirect influence of riparian zone ET on a basin’s surface and groundwater resources that have been well documented (Goodrich et al., 2000), such as a significant impact on streamflow (Bowie and Kam, 1968; Federer, 1973). Further, quantification of the atmospheric ex-change of water through ET from the riparian zone is essential to the basin-wide water
10
balance and the groundwater recharge/depletion process, which make it critical to up-slope moisture status available to crops (Maddock et al., 1998). Although the ET of the riparian zone vegetation is a critical component of the overall catchment water balance, it is still poorly understood (Chehbouni et al., 2000). Much of this lack of information is due none of the typical micrometeorological approaches for measuring ET being
ap-15
propriate for the narrow riparian corridor (Chehbouni et al., 2000). One approach to overcoming this challenge is to base AET measurements on some estimation of evap-orative power or demand (potential or potential equilibrium evapotranspiration) (Hillel, 1998).
As such, many studies are concerned with potential evapotranspiration (PET), which
20
is the maximum rate of ET from a vegetated catchment under the condition of un-limited moisture supply and without advection or heat storage effects (Thomas, 2000; Jacobs et al., 2002). Estimating evaporation by this approach has the advantages of being relatively simple and direct, and makes use of easily measured atmospheric, soil and vegetation variables (Granger and Gray, 1989). Furthermore, PET is a commonly
25
used approach to provide efficient, cost effective estimates of evaporative losses for agricultural and engineering applications (Brutsaert, 1988).
HESSD
2, 265–288, 2005Variability in riparian zone potential and
actual evapotranspiration
R. M. Petrone et al.
Title Page
Abstract Introduction
Conclusions References
Tables Figures
◭ ◮
◭ ◮
Back Close
Full Screen / Esc
Print Version
Interactive Discussion
EGU
factor is humidity, which can be a significant control on the contribution of plant tran-spiration to AET through its influences on stomatal activity (Hornberger et al., 1998). If the overlying atmosphere is close to saturated then stomata will close limiting moisture loss from the plants (Jones, 1994).
Wind also has an influence on both ET and PET (Hanson, 1991). Wind flow over a
5
surface draws water molecules away from that surface and moves the water molecules with greater efficiency than calm air. For example, an 8 km h−1wind can increase still-air evapotranspiration by as much as 20% and a 24 km h−1 wind by 50% (Hanson, 1991). Finally, the albedo of the surface may also be a significant influence through its control on net radiation, and therefore available energy. Therefore, the rate of
evapo-10
ration is controlled by: (1) the availability of both water and energy; (2) the strength of the surface-to-air vapour gradient; and (3) the intensity of turbulent motion (Brutsaert, 1984).
The physical characteristics of different land use types will influence these controls and as such rates of ET. However, plants with similar physical characteristics and
ap-15
proximately the same spectral reflectance exhibit similar PET rates, irrespective of plant or soil type (Thornthwaite and Hare, 1965). In most agricultural catchments, in addition to a range in vegetated surfaces, there can exist a significant amount of bare ground, which can account for as much as 50% of the area (Seyfried, 2001). On such terrain, ET will be limited by soil water availability as well as the distribution characteristics of
20
plant species at any given site (Seyfried, 2001). Thus, in a system dominated by agri-cultural activities, ET values from different terrain elements that comprise that system can differ greatly. This is especially the case when comparing evaporative losses from riparian areas relative to those that are cropped. Quantifying riparian zone ET is es-sential to developing a better understanding of stream-aquifer-vegetation interactions,
25
improving our ability to simulate these systems (MacNish et al., 2000). That is, ac-curate estimates of ET in the riparian zone is essential to quantifying biogeochemical processes within this zone.
ob-HESSD
2, 265–288, 2005Variability in riparian zone potential and
actual evapotranspiration
R. M. Petrone et al.
Title Page
Abstract Introduction
Conclusions References
Tables Figures
◭ ◮
◭ ◮
Back Close
Full Screen / Esc
Print Version
Interactive Discussion
EGU
tained from soil weighing lysimeters to determine coefficients representative of riparian zone surfaces, and determines the spatial variability of AET within the apparently ho-mogenous riparian zone of an agricultural watershed.
2. Study site
This study was conducted in the Strawberry Creek watershed, a small multiple
land-5
use agricultural watershed located in southern Ontario. Strawberry Creek is a peren-nial, first order stream located in Maryhill, Ontario, approximately 20 km north east of Waterloo, Ontario (42◦33′N, 80◦23′W) (Fig. 1). The creek is approximately 2 km in length and drains a watershed of about 3 km2 (Harris, 1999). Strawberry Creek then flows eastward into Hopewell Creek, which subsequently drains into the Grand River
10
through to Lake Erie.
Strawberry Creek is located in a humid continental climate region (Brown, et al., 1980). There are approximately 3200 growing degree-days and 130 frost-free days with a mean annual temperature of 6.7◦C (Brown, et al., 1980). The mean annual precipitation is 858 mm, with approximately 16% of precipitation falling as snow. The
15
mean annual PET for this region is approximately 590 mm, and mean annual AET is approximately 558 mm (Brown, et al., 1980).
The Strawberry Creek watershed contains a variety of vegetation types. The agricul-tural fields contain soybean (Heterodera glycines), and corn (Zea mays). In the lower portion of the watershed approximately 60% of the arable land has been in fallow for
20
nine years, the remaining fraction is under corn and strawberry cultivation. In the up-per portion of the watershed corn and soybean are planted. The source of Strawberry Creek is a deciduous swamp and there are two smaller woodlots within the watershed. The riparian areas that line Strawberry Creek are 10–15 wide and of low gradient. These riparian zones are dominated by tall grasses (Graminae spp.) but also
con-25
HESSD
2, 265–288, 2005Variability in riparian zone potential and
actual evapotranspiration
R. M. Petrone et al.
Title Page
Abstract Introduction
Conclusions References
Tables Figures
◭ ◮
◭ ◮
Back Close
Full Screen / Esc
Print Version
Interactive Discussion
EGU
carota), Common Burdock (Arctum minus), and a few trees (primarilySalix spp.). Two measurement sites were established in the watershed (Fig. 1). The first is lo-cated in the northern end of the basin, and will be herein referred to as the “Upper site”. Here the vegetation consists of riparian flora and the soils at this site are char-acterized as a sandy loam with the top 30 cm of soil having an average bulk density of
5
0.85±0.16 g/cm3, with a bulk density of 1.14±0.16 g/cm3at the 30–40 cm depth. The
upper layers of the soil (0–30 cm) had an average organic content of approximately 24%, while the bottom layer had an organic content of only 8%. The Upper site is also closest to the headwaters of Strawberry Creek where stagnant water frequently pools on the adjacent cornfield, which would help to slow decomposition, increasing
10
the carbon content and porosity of the Upper soil (Brady and Weil, 1999).
The second study site, referred to herein as the “Lower site”, is located in the southern end of the basin and contains riparian vegetation and the soil at this site is also characterized as a sandy loam, with an average bulk density of approximately 1.06±0.09 g/cm3, and a porosity of 53%. The soils at the Lower site were composed 15
of 8% organic material over most of the profile.
3. Methodology
Lysimeters have been used extensively to measure the net movement of water across the soil-atmosphere boundary (Tanner, 1967; Seyfried et al., 2001). A lysimeter is an artificially enclosed volume of soil that can be placed in the field and filled with
repre-20
sentative soil and/or vegetation (Brutsaert, 1988). There are two types of lysimeters: (1) a non-weighing lysimeter in which changes in soil water content are measured in-directly; and (2) a weighing lysimeter in which soil water changes are measured by mass, which is the type used in this study.
For this study lysimeters were constructed from a rectangular enclosure (1090 cm3)
25
HESSD
2, 265–288, 2005Variability in riparian zone potential and
actual evapotranspiration
R. M. Petrone et al.
Title Page
Abstract Introduction
Conclusions References
Tables Figures
◭ ◮
◭ ◮
Back Close
Full Screen / Esc
Print Version
Interactive Discussion
EGU
to maintain the same mechanical properties of the soil, it was placed in the bucket as an undisturbed block (monolith), as suggested by Brutsaert (1988). The enclosure con-taining the soil/plant monolith had holes drilled into the bottom to facilitate the drainage of water, which was then collected by the second enclosure. Each lysimeter was placed in the hole from which the monolith was extracted.
5
At the upper and lower sites duplicate lysimeters of bare soil and vegetation were installed (Fig. 1). The first location was at the northern end (Upper site) of the basin located in a riparian area adjacent to a corn field, where one lysimeter contained ripar-ian vegetation and the other bare soil. The second location was also in a riparripar-ian area (adjacent to a soybean field) in the lower portion (Lower site) of the basin.
10
Each lysimeter was weighed with a precision Chatillon® spring balance (Ametak Inc.). The weight of each lysimeter enclosure was recorded and the water that had drained (if any) into the bottom enclosure was also measured by emptying the con-tents into a one litre graduated cylinder. Soil moisture was also recorded in each lysimeter, and in the immediate area surrounding the lysimeter using a portable Time
15
Domain Reflectometry (TDR) instrument (Hydrosense, Campbell Scientific, Ltd.). This allowed the soil moisture to be monitored to ensure that the soil in the lysimeters was comparable to the surrounding soil. AET from lysimeters is quantified via,
AET=P−(VL+VR+ ∆VS)/A, (1)
whereP is precipitation (mm),VLis the volume of drainage loss (mm3),VRis the volume
20
of net surface water exchange (mm3), ∆VS is the change in the water storage in the
lysimeters (mm3), andA is the area of the lysimeter (mm2) (Tanner, 1967). ∆VS was measured by collecting the water that drained through the contents of the lysimeter and differences in weight of the lysimeter. Lysimeter AET obtained in this manner is then compared with modelled PET values for the same sites.
25
HESSD
2, 265–288, 2005Variability in riparian zone potential and
actual evapotranspiration
R. M. Petrone et al.
Title Page
Abstract Introduction
Conclusions References
Tables Figures
◭ ◮
◭ ◮
Back Close
Full Screen / Esc
Print Version
Interactive Discussion
EGU
equipped with a tipping bucket rain gauge, which was used to record basin precipitation to be used in the lysimeter calculations. Soil moisture TDR probes were also buried 10 cm and 50 cm below the surface at both sites to assess moisture conditions.
A vegetation count and survey was conducted in the immediate vicinity of each lysimeter and meteorological station. The area of the vegetation survey was
deter-5
mined by the height of the net radiometer, and the ratio of 10:1 m, where a circular area (or tower footprint) with a radius of 10 m is observed by a radiometer at a height of 1 m (Oke, 1987). The height of the radiometers were 1.5 m and 2 m at the Lower and Upper sites, respectively. Therefore, a radius of 15 m and 20 m was used at the Lower and Upper sites, respectively. The vegetation area within these footprints was recorded
10
along with the coverage of bare soil and then used to areally weight the lysimeter val-ues.
The Priestley-Taylor equation is classified as a radiation-based approach to estimat-ing ET, usestimat-ing net radiation and air temperature, to evaluate equilibrium evaporation, which assumes that an air mass moving over a homogeneous, well-watered surface
15
would become saturated (Dingman, 1994; Priestley and Taylor, 1972). Under these ideal conditions ET would eventually reach a rate of equilibrium (equilibrium potential evapotranspiration, PETeq) (Priestley and Taylor, 1972). Radiation is a very effective parameter to use in measuring equilibrium evaporation or PET. In a review of 30 studies it was commonly found that, in vegetated areas with very small, or no, water deficits
ap-20
proximately 95% of the annual evaporative demand was supplied by radiation (Stagnitti et al., 1989). The Priestley-Taylor model obtains PETeqvia,
PETeq= ∆ ∆−γ (Q
∗
−QG), (2)
where∆ is the slope of the saturated vapour pressure curve (◦C/kPa), γ is the psy-chrometric constant (Pa K−1), Q∗ is net radiation (Wm−2
), QG is the soil heat transfer
25
HESSD
2, 265–288, 2005Variability in riparian zone potential and
actual evapotranspiration
R. M. Petrone et al.
Title Page
Abstract Introduction
Conclusions References
Tables Figures
◭ ◮
◭ ◮
Back Close
Full Screen / Esc
Print Version
Interactive Discussion
EGU
generally solved using,
α=AET/PETeq, (3)
where AET is the total measured evaporation and PETeq is the total equilibrium evap-oration (Wilson and Baldocchi, 2000). However, equilibrium rarely occurs, as there is almost always horizontal advection and deviations from a “wet” surface (Wilson and
5
Baldocchi, 2000).
In many studies 1.26 is the value used forα, which is based on conditions of mini-mum advection and no edge effects (Dingman, 1994; Jacobs et al., 2002). However, general estimates forα have been made with respect to certain surfaces. For example, Morton (1983) suggested that anαvalue of 1.32 should be used for vegetated surfaces
10
due to surface roughness, and in arid regionsαshould be increased to 1.74. However, a daily average value of 1.26 has been found to be appropriate for most humid climates (Priestley and Taylor, 1972; Rouse and Stewart, 1972).
4. Results
4.1. Evapotranspiration
15
Precipitation and energy balance components varied very little within the basin, yet evapotranspiration differed between the two sites. The total PET for the Lower site was 201.1±0.1 mm, and for the Upper site was 204.9±0.1 mm. However, the AET at the
two sites, obtained using the lysimeters, differed significantly. The Lower site had a total AET of 82.9±3.9 mm, whereas the Upper site had a total of 111.5±5.4 mm. At 20
both sites AET from the vegetation contributed the bulk of the AET. These seasonal AET rates translated to average daily AET rates of 1.05 and 1.14 mm d−1for the Lower and Upper sites, respectively (Fig. 2).
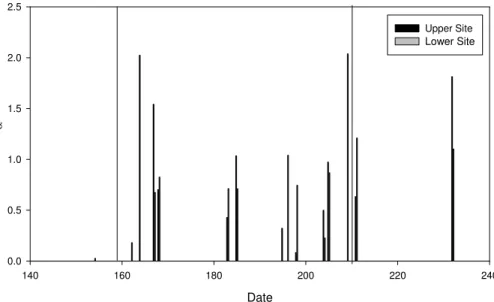
Using the lysimeter data along with energy balance measurements, the Priestley-Taylor coefficient (α) was determined for both sites. As observed with the AET values,
HESSD
2, 265–288, 2005Variability in riparian zone potential and
actual evapotranspiration
R. M. Petrone et al.
Title Page
Abstract Introduction
Conclusions References
Tables Figures
◭ ◮
◭ ◮
Back Close
Full Screen / Esc
Print Version
Interactive Discussion
EGU
theα values also varied between the two sites. Theαvalues used are a compilation of all the vegetation in the area and the soil, weighted accordingly to their respective land cover within the footprint of the respective net radiometers. Therefore, over the study periodα averaged 0.72 at the Lower site, and 0.88 at the Upper site. A wide range of alpha values were observed over the study period (Fig. 3). At the Lower site the values
5
ranged from 0.26 to 2.04 and at the Upper site the values ranged from 0.08 to 2.03.
4.2. Basin hydrology and climatology
The temperature of the basin is presented as an arithmetic mean of temperature data from three meteorological stations placed throughout the basin (Fig. 1). The mean temperature of the basin over the study period was 18.9±2.6◦C, which is comparable to 10
the 30-year normal of 18.6◦C over the same three-month period (Environment Canada, 2004). The temperature over the study period ranged from a low of 12.0◦C on 4 June, to a high of almost 24.0◦C on 4 July, after which temperatures generally decreased over the course of the season (Fig. 4a). However, during this period of decline a second maximum of 22.8◦C was recorded for a brief period on 13 August.
15
As observed with temperature, the two sites followed a similar seasonal pattern for relative humidity (RH) (Fig. 4e). The Lower site had a slightly higher mean RH of 82.4±19.3%, whereas the Upper site had a mean of approximately 77.0±17.9%
(Fig. 4e). Daily averages for the Lower site ranged from a minimum of 41.8% to a maximum of 100%. For the Upper site, the daily values ranged from 51.9% to 94.9%.
20
A total of 178 mm of precipitation was recorded over the study period, with the largest single day total of 16.5 mm occurring on 15 July (Fig. 4f). This is considerably lower than the 30-year normal of 259.4 mm over the same time period (Environment Canada, 2004). Precipitation in the basin was classified into three wet periods separated by distinct drier periods noted by a lack of rainfall (Fig. 4f). The three wet periods spanned
25
2–18 June, 5–21 July and 2–16 August, respectively.
HESSD
2, 265–288, 2005Variability in riparian zone potential and
actual evapotranspiration
R. M. Petrone et al.
Title Page
Abstract Introduction
Conclusions References
Tables Figures
◭ ◮
◭ ◮
Back Close
Full Screen / Esc
Print Version
Interactive Discussion
EGU
study period the discharge was low and responses to periodic precipitation events were minimal. However, discharge from the middle wet period did not respond in the same manner as the other two rain events (Fig. 4d). This lack of a response in discharge can be explained by dry soil moisture conditions in the basin during that period, where much of the precipitation went into storage or AET. Soil moisture data indicate that both
5
sites had a significant potential for moisture to be stored in the soil during the middle of the season (Figs. 4b and 4c). Figures 4b and 4c show that the upper soil layers were much drier than the deeper layers during this middle period. Thus, during this time the soils had dried enough that the middle wet period produced no response in soil moisture in the lower layer, only the upper layer was affected as soil moisture storage
10
was replenished. During this middle wet period the rain infiltrated rapidly to raise the water table, rather than entering the stream as discharge.
Towards the end of the study period the soil moisture in the upper layers of the soil increased at both the Upper and Lower sites (Figs. 4b and 4c). Over a four-day period (2–6 August) the soil moisture increased from 0.22 to 0.38 and 0.21 to 0.35 at the Lower
15
and Upper sites, respectively. This was followed by a decrease during a reprieve in the precipitation, and then an increase to the highest moisture level of the study period in response to the second largest rain event of the season (12 August). The Lower site reached maximum values of 0.40 and 0.43 for the deeper and shallower layer, respectively, while the Upper site reached 0.39 and 0.44 for the deeper and shallower
20
layer, respectively (Figs. 4b and 4c).
4.3. Energy balance
Figures 5a and 5b show similar net radiation (Q∗) and ground heat flux (Q
G) values
for the two sites. The mean QG was 0.09 and 0.10 W m−
2
at the Lower and Upper sites, respectively, and ranged from approximately −0.2 to 0.55 W m−2 at both sites 25
over the study period. Mean Q* values were 106.3 and 100.2 W m−2at the Lower and Upper sites, respectively. Both the Q∗ and Q
HESSD
2, 265–288, 2005Variability in riparian zone potential and
actual evapotranspiration
R. M. Petrone et al.
Title Page
Abstract Introduction
Conclusions References
Tables Figures
◭ ◮
◭ ◮
Back Close
Full Screen / Esc
Print Version
Interactive Discussion
EGU
variability over the study season, but exhibited strong daily fluctuations. The lack of a clear seasonal trend is the result of the study period not spanning the shoulder seasons (spring and autumn).
Wind speed varied the most between the two sites, and was much higher at the Upper site than at the Lower site (Fig. 5d). The average wind speed at the Lower
5
site was 1.5±1.1 m s−1, and the Upper site was 1.7±1.4 m s−1 (a difference of 13%).
However, the maximum daily wind speed was 3.2 m s−1and 5.7 m s−1for the Lower and Upper sites, respectively. Furthermore, the Upper site wind gusts were observed to exceed 9 m s−1, while at the Lower site the highest wind gust observed was 6.6 m s−1.
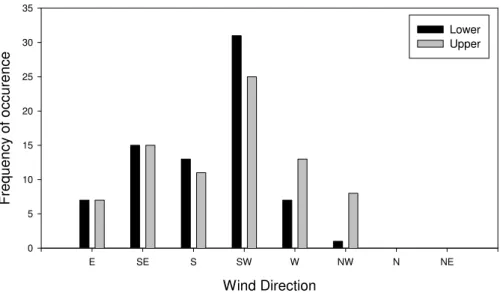
Wind direction varied little between the two sites (Fig. 6), with the predominant wind
10
direction being from the southwest. Other wind directions that were less dominant, but occurred equally, were observed from the southeast, south and west. No observations were recorded, at either site, for winds from the north or northeast for any significant amount of time.
5. Discussion 15
AET rates and α values obtained in this study are comparable with other studies on similar agricultural grass and riparian areas. The daily AET rates of 1.05 and 1.14 mm/day for both sites are well within the range of 0.5 to 4 mm/day reported in a similar terrain by Unland et al. (1998). Measurements ofα are a useful tool for ir-rigation planning purposes, and as such many studies have presented values for a
20
variety of agricultural land-use types. While few have focused primarily on riparian ar-eas the range reported here (0.08 to 2.03) is also well within the range of 0.06 to 2.10 presented for various agricultural grass-dominated sites (Ritchie, 1972; Wallace and Holwill, 1997; Katal and Parlange, 1992; Hares and Novak, 1992b).
The α values also differed between the two sites. The controlling factor of α is
25
HESSD
2, 265–288, 2005Variability in riparian zone potential and
actual evapotranspiration
R. M. Petrone et al.
Title Page
Abstract Introduction
Conclusions References
Tables Figures
◭ ◮
◭ ◮
Back Close
Full Screen / Esc
Print Version
Interactive Discussion
EGU
inα.
The data show that the amount of moisture that could be stored in the soil was highest inthe middle of the season. Immediately prior to this period, there was a lack of rain allowing the soil to dry out. During the next wet period, the precipitation was able to infiltrate the soil fairly rapidly and remain there, rather then being discharged
5
throughout the basin as lateral groundwater flow (Fig. 2d). During this second wet period the soil moisture graphs indicate that there was more potential for moisture storage at the Upper site than at the Lower site, which can be attributed to the soil properties of the site (high porosity and a high carbon content). This also suggests that more water was available at the Upper site for AET. Theα values for the Upper
10
site support this, as they are higher than at the Lower site, indicating that the AET at the Upper site was not as moisture-limited, which seems to be the case at the Lower site. That is, the soil properties at this site permitted easier access to soil moisture for atmospheric exchange.
Although the energy balance at the Lower and Upper sites are very similar, the
15
rates of AET are much higher at the Upper than the Lower site (38% greater). As the other controlling meteorological variables are also similar between the two sites, the only variable that significantly differs between the Lower and Upper sites are the wind parameters (speed and direction), which directly affects turbulent transport, possibly accounting for the observed differences in AET.
20
Wind speed has already been shown to be a determining factor in estimating evapo-ration (Thomas, 2000). In a study undertaken in China, Thomas (2000) illustrated that PET was controlled primarily by wind. In desert areas, and in northern areas of the country wind was a more important factor than temperature or relative humidity alone. In desert regions wind is a dominant influence because it is constant force in such
re-25
gions. In addition, the advection of hot air from the surrounding bare lands could create an “oasis effect” affecting PET rates more than under undisturbed conditions (Thomas, 2000).
HESSD
2, 265–288, 2005Variability in riparian zone potential and
actual evapotranspiration
R. M. Petrone et al.
Title Page
Abstract Introduction
Conclusions References
Tables Figures
◭ ◮
◭ ◮
Back Close
Full Screen / Esc
Print Version
Interactive Discussion
EGU
the Lower site, where wind gusts exceeded 9 m s−1 and 7 m s−1, respectively. Daily averages of wind speed were also higher at the Upper site. However, AET was negligi-ble at both sites when wind speeds were lower than 1 m s−1
. With wind speeds below 1 m s−1evaporation from the surface leads to a build-up of the moisture content of the air immediately adjacent to the surface (Brutsaert, 1988). When wind speeds increase,
5
drier air is able to replace the saturated air, therefore, horizontal advection is an impor-tant process to introduce drier air and increase ET (Brutsaert, 1988). Consequently, with an increase in advective activity, theα will increase.
Wind speed was higher at the Upper site because of the surrounding vegetation. At this site the fields to the southwest, west, northwest and north consisted of short
10
grasses, which was routinely cut, leaving a low and uniform ground cover. Immediately following a cut, bare soil was exposed, and the remaining vegetation was sparse. Un-der these conditions warmer and drier air would be advected over the location of the Upper lysimeters increasing AET values here relative to the Lower site.
At the Lower site the areas to the north and northwest of the station contained corn
15
and dense riparian grasses, which due to increased friction would reduce wind speeds. This explains why AET was highest at the Lower site when the wind direction was from the south, southwest and west (however, these directions only account for 69% of the time).
6. Conclusions
20
AET is quite variable within a single terrain unit within a small catchment. This data illustrates that AET is greater at the site in the upper portion of the basin. Therefore, even within the short distances of a small agricultural watershed spatial variability be-tween the two riparian zone sites exists. This further emphasizes the difficulty in quan-tifying AET rates in multiple land use basins, such as the Strawberry Creek watershed,
25
HESSD
2, 265–288, 2005Variability in riparian zone potential and
actual evapotranspiration
R. M. Petrone et al.
Title Page
Abstract Introduction
Conclusions References
Tables Figures
◭ ◮
◭ ◮
Back Close
Full Screen / Esc
Print Version
Interactive Discussion
EGU
the difference in AET rates between the sites are differences in wind speed and direc-tion, which also interacts with the differing vegetation of the area to produce contrasting turbulent regimes.
The importance of advective influences and the location’s turbulence regime is also illustrated through the differingαvalues within this basin. Theαvalues at the two sites
5
also indicate that AET at the Lower site is more moisture-limited than the Upper site. This is reflected in the soil parameters at each site, which affect moisture storage that is higher at the Upper site.
Thus, in order to accurately quantify riparian zone AET, it is important to first examine the study site on smaller scales as it has been demonstrated that ET rates can be
10
highly variable at these scales, and must be evaluated as such. While rigorous study of larger sites may be difficult, less intensive research methods could be used such as the Priestley-Taylor model, which can be carried out using automated instruments, once relationships between PET and AET are quantified for the various representative land-use types comprising the system. However, in any study that requires quantifying
15
AET values the controlling parameters of spatial variability must be taken into account, even within the seemingly homogeneous land-use types in a catchment.
Acknowledgements. Funding for this research was provided by the Natural Science and Engi-neering Research Council of Canada, the Canadian Foundation for Innovation, and a Wilfrid Laurier University Short-term Research Grant. The field assistance of P. Chahill and J. R.
Van-20
Haarlem is gratefully acknowledged, as is the technical input of M. L. Macrae.
References
Bowie, J. E. and Kam, W.: The use of water by riparian vegetation, Cottonwood Wash, Arizona, US Geological Survey Water Supply Paper 1858, 1968.
Brady, N. C. and Weil, R. R.: The Nature and Properties of Soils USA, Prentice Hall, 1999.
25
HESSD
2, 265–288, 2005Variability in riparian zone potential and
actual evapotranspiration
R. M. Petrone et al.
Title Page
Abstract Introduction
Conclusions References
Tables Figures
◭ ◮
◭ ◮
Back Close
Full Screen / Esc
Print Version
Interactive Discussion
EGU
Brutseart, W.: Gas Transfer at Water Surfaces, Dordrecht, D. Reidel Publishing Company, 1984. Brutsaert, W.: Evaporation into the Atmosphere: Theory, History, and Applications, Dordrecht:
D. Reidel Publishing Company, 1988.
Chehbouni, A., Goodrich, D. C., Moran, M. S., Watts, C. J., Kerr, Y. H., Dedieu, G., Kepner, W. G., Shuttleworth, W. J., and Sorooshian, S.: A preliminary synthesis of major scientific results
5
during the SALSA program, Agricultural and Forest Meteorology, 105, 311–323, 2000. Dingman, S. L.: Physical Hydrology. New Jersey: Prentice-Hall, Inc., 1994.
Environment Canada: “Canadian Climate Normals 1971–2000”, Toronto, Environemnt Canada National Climate Archive, 2004.
Federer, C. A.: Forest transpiration greatly speeds streamflow recession, Water Resources
10
Research, 9, 6, 1599–1604, 1973.
Goodrich, D. C., Scott, R., Qi, J., and Ni, W.: Seasonal estimates of riparian evapotranspiration using remote and in situ measurements, Agricultural and Forest Meteorology, 105, 281–309, 2000.
Granger, R. J. and Gray, D. M.: Assessment of Morton’s Model for Estimating Areal
Evapotran-15
spiration, Saskatoon, Environment Canada, 1989.
Hanson, R. L.: “Evapotranspiration and Droughts”, in: Compilers, National Water Summary 1988–1989, edited by Paulson, R. W., Chase, E. B., Roberts, R. S., and Moody, D. W., Hydrologic Events and Floods and Droughts: U.S. Geological Survey Water-Supply Paper 2375, 99–104, 1991.
20
Hares, M. A. and Novak, M. D.: Simulation of surface energy balance and soil temperature under strip tillage II. Field test, Soil Science Society of America Journal, 56, 22–29, 1992b. Harris, M.: Nitrate attenuation in a narrow non-forested riparian buffer zone in an agricultural
watershed in Southern Ontario, MES Thesis, Wilfrid Laurier University, 1999. Hillel, D.: Environmental Soil Physics, USA, Academic Press, 1998.
25
Hornberger, G., Raffensperger, J. P., Wiberg, P. L., and Eshleman, K. N.: Elements of Physical Hydrology, Baltimore, The John Hopkins University Press, 1998.
Jacobs, J. M., Mergelsberg, S. L., Lopera, A., and Myers, D. A.: Evapotranspiration from a wet prairie wetland under drought conditions: Paynes Prairie Preserve, Florida, USA, Wetlands, 22, 2, 374–385, 2002.
30
Jones, H. G.: Plants and Microclimate, New York, NY, Cambridge University Press, 1994. Katul, G. G. and Parlange, M. B.: Estimation of bare soil evaporation using skin temperature
HESSD
2, 265–288, 2005Variability in riparian zone potential and
actual evapotranspiration
R. M. Petrone et al.
Title Page
Abstract Introduction
Conclusions References
Tables Figures
◭ ◮
◭ ◮
Back Close
Full Screen / Esc
Print Version
Interactive Discussion
EGU
Kotoda, K.: Estimation of river basin evapotranspiration from consideration of topographies and land use conditions, in Estimation of Areal Evapotranspiration, 1989.
MacNish, R. D., Unkrich, C. L., Smythe, E., Goodrich, D. C., and Maddock III, T.: Comparison of riparian evapotranspiration estimates based on a water balance approach and sap flow measurements, Agricultural and Forest Meteorology, 271–279, 2000.
5
Maddock III, T., MacNish, R., Goodrich, D. C., and Chehbouni, A.: An overview of atmospheric and surface water coupling to regional groundwater models in semi-arid basins, In Proceed-ings of the American Meteorological Society of Special Symposium on Hydrology, Phoenix, AZ, 38–42, 1998.
Morton, F. I.: Operational estimates of areal evapotranspiration and their significance to the
10
science and practice of hydrology, Journal of Hydrology, 66, 1–76, 1983. Odum, E. P.: Fundamentals of Ecology, Saunders, Philadelphia, PA, 1971. Oke, T. R.: Boundary Layer Climates. 2ndEdition, Cambridge, Routledge, 1987.
Priestley, C. H. B. and Taylor, R. J.: On the assessment of surface heat flux and evaporation using large scale parameters, Monthly Weather Review, 100, 81–92, 1972.
15
Ritchie, J. T.: Model for predicting evaporation from a crop with incomplete cover, Water Re-sources Research, 8, 1204–1213, 1972.
Rouse, W. R. and Stewart, R. B.: A Simple Model For Determining Evaporation From High-Latitude Upland Sites, Journal of Applied Meteorology, 11, 7, 1063–1070, 1972.
Seyfried, M. S., Hanson, C. L., Murdock, M. D., and Van Vactor, S.: Long-term lysimeter
20
database, Reynolds Creek Experimental Watershed, Idaho, United States, Water Resources Research, 37, 11, 2853–2856, 2001.
Stagnitti, F., Parlange, J. Y., and Rose, C. W.: Hydrology of a small wet catchment, Hydrological Processes, 3, 137–150, 1989.
Tanner, C. B.: Measurement of evapotranspiration, in Irrigation of Agricultural Lands, edited
25
by Hagan, R. M., Haise, H. R., and Edminster, T. W., American Society of Agronomists, Madison, Wisconsin, 534–741, 1967.
Thomas, A.: Spatial and temporal characteristics of potential evapotranspiration trends over China, International Journal of Climatology, 20, 381–396, 2000.
Thornthwaite, C. W. and Hare, F. K.: The loss of water to the air, Agricultural Meteorology, 6,
30
28, 163–180, 1965.
HESSD
2, 265–288, 2005Variability in riparian zone potential and
actual evapotranspiration
R. M. Petrone et al.
Title Page
Abstract Introduction
Conclusions References
Tables Figures
◭ ◮
◭ ◮
Back Close
Full Screen / Esc
Print Version
Interactive Discussion
EGU
Wallace, J. S. and Holwill, C. J.: Soil evaporation from tiger-bush in southwest Niger, Journal of Hydrology, 188/189, 426–442, 1997.
Wilson, K. B. and Baldocchi, D. D.: Seasonal and interannual variability of energy fluxes over a broadleaved temperate deciduous forest in North America, Agricultural and Forest Meteo-rology, 100, 1–18, 2000.
HESSD
2, 265–288, 2005Variability in riparian zone potential and
actual evapotranspiration
R. M. Petrone et al.
Title Page
Abstract Introduction
Conclusions References
Tables Figures
◭ ◮
◭ ◮
Back Close
Full Screen / Esc
Print Version
Interactive Discussion
EGU
0 500 m N
Basin Outflow
X
X X
Stream Roads Basin Edge Forest Cropped
Met Tower Buildings
X
Lysimeter
Upper site
Lower site
0 150km
O n t a r i o Lake
Huron
Lake Er ie
Lake Onta rio
Study Site Grand River
Basin
HESSD
2, 265–288, 2005Variability in riparian zone potential and
actual evapotranspiration
R. M. Petrone et al.
Title Page
Abstract Introduction
Conclusions References
Tables Figures
◭ ◮
◭ ◮
Back Close
Full Screen / Esc
Print Version
Interactive Discussion
EGU FR AET (mm/day)
0 5 10 15
U
p
per
AET (
mm/day
)
0 10 20 30 40
R2 = 0.75
Upper AET = 0.05 + 1.51(FR AET)
HESSD
2, 265–288, 2005Variability in riparian zone potential and
actual evapotranspiration
R. M. Petrone et al.
Title Page
Abstract Introduction
Conclusions References
Tables Figures
◭ ◮
◭ ◮
Back Close
Full Screen / Esc
Print Version
Interactive Discussion
EGU Date
140 160 180 200 220 240
α
0.0 0.5 1.0 1.5 2.0 2.5
Upper Site Lower Site
HESSD
2, 265–288, 2005Variability in riparian zone potential and
actual evapotranspiration
R. M. Petrone et al.
Title Page Abstract Introduction Conclusions References Tables Figures ◭ ◮ ◭ ◮ Back Close
Full Screen / Esc
Print Version Interactive Discussion EGU RH (%) 20 40 60 80 100 Upper Lower Date
140 160 180 200 220 240
Pr ecipi tation ( m m) 0 2 4 6 8 10 12 14 16 18 Di s c harg e ( L /s ) 0.0 0.2 0.4 0.6 0.8 1.0 1.2 Volumet ir c Soil M o is tu re (%) Low er 0.15 0.20 0.25 0.30 0.35 0.40 0.45 V o lu m e tr ic S o il M o is tu re (%) Upper 0.15 0.20 0.25 0.30 0.35 0.40 0.45 5 cm 50 cm Air T e m per at ur e ( oC) 10 12 14 16 18 20 22 24 26 (a) (b) (c) (d) (e) (f)
Fig. 4. Basin hydrology and climatology for Strawberry Creek, 3 June to 22 August 2003.
HESSD
2, 265–288, 2005Variability in riparian zone potential and
actual evapotranspiration
R. M. Petrone et al.
Title Page
Abstract Introduction
Conclusions References
Tables Figures
◭ ◮
◭ ◮
Back Close
Full Screen / Esc
Print Version
Interactive Discussion
EGU
Date
140 160 180 200 220 240
W
indspeed (m
/s)
0 1 2 3 4 5 6
Ta (
o C)
10 15 20 25 30 Q g
(W
/m
2)
-0.4 -0.2 0.0 0.2 0.4 0.6
Q* (W
/m
2)
-50 0 50 100 150 200 250 300
(a)
(b)
(c)
(d)
HESSD
2, 265–288, 2005Variability in riparian zone potential and
actual evapotranspiration
R. M. Petrone et al.
Title Page
Abstract Introduction
Conclusions References
Tables Figures
◭ ◮
◭ ◮
Back Close
Full Screen / Esc
Print Version
Interactive Discussion
EGU Wind Direction
E SE S SW W NW N NE
Frequency
of
o
ccu
re
nce
0 5 10 15 20 25 30 35
Lower Upper