www.atmos-chem-phys.net/12/2381/2012/ doi:10.5194/acp-12-2381-2012
© Author(s) 2012. CC Attribution 3.0 License.
Chemistry
and Physics
A new method to determine the mixing state of light absorbing
carbonaceous using the measured aerosol optical properties and
number size distributions
N. Ma1, C. S. Zhao1, T. M ¨uller2, Y. F. Cheng3, P. F. Liu1, Z. Z. Deng4, W. Y. Xu1, L. Ran1, B. Nekat2, D. van Pinxteren2, T. Gnauk2, K. M ¨uller2, H. Herrmann2, P. Yan5, X. J. Zhou1,5, and A. Wiedensohler2
1Department of Atmospheric and Oceanic Sciences, School of Physics, Peking University, Beijing, China 2Leibniz Institute for Tropospheric research, Leipzig, Germany
3College of Environmental Sciences and Engineering, Peking University, Beijing, China
4Key Laboratory of Middle Atmosphere and Global Environment Observation, Institute of Atmospheric Physics, Chinese Academy of Sciences, Beijing, China
5Chinese Academy of Meteorological Sciences of CMA, Beijing, China
Correspondence to:C. S. Zhao ([email protected])
Received: 13 July 2011 – Published in Atmos. Chem. Phys. Discuss.: 7 October 2011 Revised: 12 January 2012 – Accepted: 22 January 2012 – Published: 2 March 2012
Abstract. In this paper, the mixing state of light absorbing carbonaceous (LAC) was investigated with a two-parameter aerosol optical model and in situ aerosol measurements at a regional site in the North China Plain (NCP). A closure study between the hemispheric backscattering fraction (HBF) mea-sured by an integrating nephelometer and that calculated with a modified Mie model was conducted. A new method was proposed to retrieve the ratio of the externally mixed LAC mass to the total mass of LAC (rext-LAC)based on the as-sumption that the ambient aerosol particles were externally mixed and consisted of a pure LAC material and a core-shell morphology in which the core is LAC and the shell is a less absorbing material. A Monte Carlo simulation was applied to estimate the overall influences of input parameters of the algorithm to the retrievedrext-LAC. The diurnal variation of
rext-LACwas analyzed and the PartMC-MOSAIC model was used to simulate the variation of the aerosol mixing state. Re-sults show that, for internally mixed particles, the assump-tion of core-shell mixture is more appropriate than that of homogenous mixture which has been widely used in aerosol optical calculations. A significant diurnal pattern of the re-trievedrext-LACwas found, with high values during the day-time and low values at night. The consistency between the retrievedrext-LACand the model results indicates that the di-urnal variation of LAC mixing state is mainly caused by the diurnal evolution of the mixing layer.
1 Introduction
Atmospheric aerosols influence the Earth’s radiative balance directly by scattering and absorbing solar radiation, and in-directly by changing the albedo, cloud amount, lifetime of clouds, and precipitations (Twomey, 1974; Albrecht, 1989; Charlson et al, 1992; Rosenfeld, 1999, 2000; Zhao et al., 2006). The largest uncertainty in estimating the radiative forcing results from aerosols (IPCC, 2007). Light absorbing carbonaceous (LAC), as one of the most important compo-nents of aerosols, is considered as the dominant absorber of visible solar radiation in the atmosphere (Ramanathan and Carmichael, 2008), and hence has a positive radiative forc-ing on the climate system (Jacobson, 2001). Due to the lack of horizontal and vertical distributions of LAC, insufficient emission inventory and the rather limited knowledge on the mixing state of LAC, the quantity of positive radiative forc-ing caused by LAC is yet uncertain.
The LAC has been assigned various names in the lit-erature, such as “black carbon (BC)”, “elemental carbon (EC)”, and “soot”. “BC” is mostly used to emphasize its light-absorbing property. However, following Bond and Bergstrom (2006), “LAC” is used in the current study.
cooking with biofuels (Ramanathan and Carmichael, 2008). The freshly emitted LAC often stays unmixed, while there are many processes that cause LAC to mix with other chem-ical components, such as coagulation with other particles, condensation of vapors onto the surface forming a coating layer, reactions with gases, and cloud processes. The mix-ing state of LAC is quite complicated and the optical proper-ties of LAC are very sensitive to the mixing state (Khalizov et al., 2009). It is suggested that different mixing states of LAC affect its global direct radiative forcing by a factor of 2.9 (+0.27 Wm−2for an external mixture, +0.54 Wm−2for a core-shell mixture with LAC core, and +0.78 Wm−2for ho-mogeneously internal mixture) (Jacobson, 2000, 2001).
Winkler (1973) suggested a definition of external and in-ternal mixture of aerosols. For an exin-ternal mixture, differ-ent compounds are separated as differdiffer-ent particles, while in an internal mixture, all particles consist of the same mix-ture of compounds. The external and internal mixmix-tures are two limiting cases with all intermediate states between them to be possible. Three conceptual models are usually used to describe the mixing state of LAC and other aerosol com-ponents: external mixture, homogeneously internal mixture, and core-shell internal mixture (a LAC core surrounded by a well-mixed less absorbing shell) (Seinfeld and Pandis, 1998; Jacobson, 2001). Most of the models for estimating the di-rect aerosol radiative forcing, as well as aerosol optical clo-sure studies (Wex et al., 2002b; Mallet et al., 2004; Cheng et al., 2006; Ma et al., 2011) are based on the assump-tion of external mixture or homogeneously internal mixture for LAC and less absorbing components. However, many studies have suggested that internally mixed LAC is usually coated with a shell of less absorbing component to form a core-shell structure rather than “well mixed”. Images ob-tained from TEM supported that LAC particles could become coated once emitted (Katrinak et al., 1992, 1993; Martins et al., 1998). Volatility tandem DMA (differential mobility an-alyzer) measurements showed that the majority of particles are comprised of a non-volatile core and a volatile outer layer during heavily polluted days (Wehner et al., 2009). Many studies also suggested that the use of a single particle optical model assuming an absorbing spherical core surrounded by a mantle of non-absorbing material is appropriate in the es-timation of the aerosol direct radiative forcing (Jacobson et al., 2000, 2001; Chandra et al., 2004; Bond and Sun, 2005).
Many efforts have been undertaken to investigate how LAC is mixed with other aerosol components. In general, the mixing state of LAC can be obtained through two kinds of methods: direct measurements and inferences via optical closure studies.
A transmission electron microscopy (TEM) can be used for single particle analysis. The mixing state of soot particles was observed by Katrinak et al. (1992, 1993) and Clarke et al. (2004) with the TEM. A Single-particle soot photometer can be used to distinguish the coated soot particles (Schwarz et al., 2008) by measuring the incandescence and
scatter-ing at infrared wavelengths of sscatter-ingle particles. Moffet et al. (2008, 2009) used an aerosol time-of-flight mass spec-trometer to yield the mixing state of soot in real-time, and a diurnal variation was found. In recent years, Tandem DMA-based techniques were widely applied in aerosol measure-ments. A high humidity tandem DMA (Hennig et al., 2005) can provide size-resolved fractions of externally mixed hy-drophobic particles (Liu et al., 2011), while a volatility tan-dem DMA can be used to yield size-resolved fractions of particles with different volatility that usually indicate differ-ent mixing states of LAC (Wehner et al., 2009; Cheng et al., 2009).
Besides the direct measurements, some studies inferred the LAC mixing state via optical closure studies. Most of them were based on the Mie model and the dependence of mass absorption efficiency of LAC on its mixing state. Mal-let et al. (2004) calculated the single scattering albedo (ω)
from in situ aerosol data with the assumption of external and homogeneously internal mixture for LAC and other compo-nents, and compared the two calculated ωwith the values of Aerosol Robotic Network (AERONET) sun-photometer measurements. They found that LAC was externally mixed in the urban area. Dey et al. (2008) did a similar optical clo-sure study in India to infer the mixing states and made an im-provement by assuming six cases of aerosol mixing state in the calculation. They found that the probable aerosol mixing state had seasonal variations. Based on in situ aerosol micro-physical and chemical measurements and a two-parameter aerosol optical model, Cheng et al. (2006) developed an in-ternally consistent algorithm to yield the ratio of exin-ternally mixed LAC to the total mass of LAC. The aerosol absorp-tion coefficients were calculated using aerosol particle num-ber size distributions (PNSDs) and size-resolved chemical information with a variable mass ratio of externally mixed LAC. The best estimation of the mass ratios was derived from minimizing the difference between the calculated absorption coefficients and the values measured by MAAP (multi-angle absorption photometer, Petzold et al., 2002). However, due to the low temporal resolution of the aerosol chemical com-position data, only two ratio values could be retrieved for each day.
with high aerosol loading and concentrations of gases pol-lutants, aerosol aging processes may be quite different from what has been previously recognized, thus the mixing state of LAC might be much more complicated. However, studies addressing the mixing state of LAC in this region are cur-rently very limited (Cheng et al, 2006; Wehner et al., 2009).
In this paper, an optical closure study was performed us-ing in situ aerosol data measured at a regional site in the NCP. The hemispheric backscattering fractions (HBFs) calculated with three assumed LAC mixing states were compared with the measured values. A new algorithm was applied to infer the mass ratio of externally mixed LAC to the total mass of LAC (rext-LAC), assuming the mixing state of LAC as par-tially externally mixed and parpar-tially core-shell mixed.
In Sect. 2, the site and instruments of the campaign are introduced. The new method for inferring therext-LACis de-scribed in Sect. 3. Sect. 4 presents the retrievedrext-LAC, a three-day case study, as well as the uncertainty study. The summary and conclusions are presented in Sect. 5.
2 Measurements
2.1 The field site
The HaChi (Haze in China) campaign took place in sum-mer 2009 (12 July to 14 August, 193–226 DOY) in Wuqing, a suburban site in the Northern NCP and well representa-tive of regional anthropogenic aerosols. The Wuqing town is situated between two megacities: Beijing (16 million in-habitants, 80 km away in the NW of Wuqing) and Tianjin (10 million inhabitants, 30 km away in the SSW of Wuqing) with about 0.8 million inhabitants. The map of the site and the area around can be found in Xu et al. (2011). During the campaign, particle number size distributions, aerosol light scattering coefficients, as well as LAC mass concentrations were continuously measured.
The measurements were conducted in a container, in which the temperature was maintained at 22◦C. Air samples were collected with a PM10inlet (16.67 l min−1)installed on the top of a stainless steel tube with a diameter of 3/4 inch (19 mm) and 7 m a.g.l. The samples were split into several flows inside the container, passing through stainless steel tub-ing, to different instruments. The residence time for samples in the inlet system was about 5 s. An automatic aerosol dif-fusion dryer (Tuch et al., 2009) was installed upstream all of the instruments to keep the relative humidity (RH) of the measured sample below 30 %.
2.2 Instrumentation
A Twin Differential Mobility Particle Sizer (TDMPS, IfT, Leipzig, Germany) (Birmili et al., 1999) and an Aerody-namic Particle Sizer (APS Model 3320, TSI, Inc., Shore-view, MN USA) were employed to measure PNSDs. Both were operated at RH<30 %. The raw TDMPS and APS data were inverted and merged to yield the PNSDs with the range of equivalent diameter from 3 nm to 10 µm. Details can be found in Ma et al. (2011). The temporal resolution of the PNSD data was 10 min.
The scattering coefficients (σsp) and hemispheric backscattering coefficients (σbsp) for dry aerosols were measured by a total scatter/back scatter, integrating neph-elometer at the wavelengths of 450, 550 and 700 nm (TSI, Inc., Shoreview, MN USA, Model 3563) (Anderson et al., 1996, 1998), with a temporal resolution of 1 min. The neph-elometer was calibrated beforehand using CO2(Anderson et al., 1996). Particle free air checks were performed once a day.
A multi-angle absorption photometer (MAAP Model 5012, Thermo, Inc., Waltham, MA USA) was employed to measure the absorption coefficients (σap) for dry particles with a sampling frequency of 1 min. The instrument deter-minesσapvia simultaneous measurements of light (637 nm) passing through its filter and scattered back from particles accumulated on its surface. It operates at two detection an-gles to resolve the influence of light-scattering aerosol com-ponents on the angular distribution of the back-scattered ra-diation (Petzold and Sch¨onlinner, 2004). The MAAP deter-mines absorption coefficients directly and converts them to LAC mass concentrations with an assumed mass absorption efficiency (MAE) of 6.6 m2g−1. This constant has been val-idated by the comparison between the impactor-derived el-emental carbon mass and the MAAP measurements, which will be discussed in Sect. 4.4.2.
3 Methodology
3.1 Two-parameter aerosol model
2002a). This aerosol model is also widely used in aerosol di-rect radiative forcing estimations (Myhre et al., 1998; Krist-jansson, 2002), but usually only LAC and sulfates were in-cluded.
The refractive indices of LAC and less absorbing compo-nents in the aerosol model were selected from related litera-tures (Ouimette and Flagan, 1982; Hasan and Dzubay, 1983; Sloane, 1984; Seinfeld and Pandis, 1998; Covert et al., 1990; Tang and Munkelwitz, 1994). The real part of the refrac-tive index for LAC was chosen to be 1.80, and the imaginary part was set to be 0.54i, which was the average value for the wavelengths of 450, 550 and 700 nm (d’ Almeida et al., 1991). The refractive index of the less absorbing components was set to be 1.55–1e–7i.
For the mixing state of LAC, new evidences support-ing the core-shell structure of LAC aerosols have been found in the simulation of nephelometer measurements. The nephelometer-measured HBF was simulated based on three assumed mixing states of LAC: external mixture, homoge-neously internal mixture, and core-shell mixture. The HBF calculated with the assumption of core-shell mixture gives the highest results, which are about 30 % higher than those calculated with the assumption of external mixture. While the HBF calculated with the assumption of homogeneously internal mixture are the lowest, about 10 % lower than those calculated with the assumption of external mixture. The HBF given by nephelometer are always between the values cal-culated with the assumptions of external mixture and core-shell mixture. It definitely suggests that the sampled aerosols might be partially externally mixed and partially core-shell mixed rather than externally mixed and homogeneously in-ternally mixed. More details will be discussed in Sect. 4.1.
Consequently, aerosols are divided into two kinds in this study: the completely externally mixed LAC and a LAC core surrounded by a less absorbing component shell. To quan-tify the mixing state of LAC,rext-LACis defined as the mass fraction of externally mixed LAC (Mext-LAC)in total LAC (MLAC):
rext-LAC=
Mext-LAC MLAC
(1) If all LAC is externally mixed and there is no core inside the less absorbing component,rext-LAC is 1; whilerext-LAC
is 0 if all LAC is covered by less absorbing component. For atmospheric aerosols,rext-LACvaries between 0 and 1.
3.2 Mie code
To simulate the measurements of TSI 3563 nephelometer, a modified BHMIE code and a modified BHCOAT code (Bohren and Huffman, 1983; Cheng et al., 2009) are utilized for homogeneous spherical particles and core-shell mixed spherical particles, respectively.
In the Mie theory (Mie, 1908), the scattering efficiency (Qsp)and the hemispheric back scattering efficiency (Qbsp)
can be calculated by integrating the intensity function |S (θ,x,m)˜ |from 0◦ to 180◦and from 90◦ to 180◦, respec-tively:
Qsp,bsp= 1
x2
Z
θ
|S (θ,x,m)˜ |2sinθ dθ (2)
where,x=πDp/λ. Dp is the volume equivalent diameter of particles. λ is the wavelength of radiation. θ is the scat-tering angle. However, the integrating angle of TSI 3563 nephelometer is from 7◦to 170◦for scattering and from 90◦ to 170◦ for hemispheric backscattering, respectively. And the light source of the nephelometer is not strictly Lamber-tian and shows a non-ideal angular response (Anderson et al., 1996). These two effects are considered in the modified BH-MIE code and BHCOAT code. The sinθ term in Eq. (2) is replaced by angular sensitivity curvesf(θ )spandf(θ )bsp, de-rived from a characterization study of TSI 3563 nephelome-ter (Anderson et al., 1996). Then theσspandσbspcould be calculated following:
σsp,bsp=
Z
Dp
1
x2
Z
θ
|S (θ,x,m)˜ |2f (θ )sp,bspdθ
·π 4D
2 p
·N logDp·dlogDp (3)
whereN (logDp)is the PNSD.
3.3 Retrieval algorithm
As shown in Sect. 4.1, the HBF measured by the nephelome-ter is always between the values calculated with assumptions of external mixture and core-shell mixture of LAC. The cal-culated HBF is found to be sensitive torext-LAC. Therefore, based on the aerosol model described in Sect. 3.1, it is pos-sible to retrieverext-LACby matching the measured HBF and the HBF calculated from measured PNSD and LAC mass concentration with the modified Mie model.
The PNSD of externally mixed LAC particles and core-shell mixed particles, as well as the radii of the LAC core of core-shell mixed particles, are need to calculate the HBF. For a givenrext-LAC, the PNSD of externally mixed LAC parti-cles can be calculated by
N logDpext-LAC=N logDpmeasure·fLAC·rext-LAC (4) where,N logDpmeasureis the PNSD measured by TDMPS and APS.fLACis the volume fraction of LAC, which can be calculated by
fLAC=
MLAC,measure
ρLAC·P
Dp
N logDpmeasure·
π
6·D3p
where, MLAC,measure is the LAC mass concentration mea-sured by MAAP. ρLAC is the density of LAC, which is reported in literature with a range from 1.00 g cm−3 to 2.00 g cm−3 (Sloane et al., 1983, 1984, 1991; Sloane and Wolff, 1985; Ouimette and Flagan, 1982; Seinfeld and Pan-dis, 1998). A median value of 1.5 g cm−3 is used in this study.
Accordingly, the PNSD of core-shell mixed particles can be calculated as:
N logDpcore-shell=N logDpmeasure·(1−fLAC·rext-LAC)(6) Another critical parameter for calculating the optical proper-ties of core-shell mixed particles is the size of the LAC core. Core-shell mixed particles with the same diameter might dif-fer in the size of their cores. As a simplified optical aerosol model, the core-shell mixed particles with the same diame-ter are assumed to be the same in the size of the LAC core, which can be calculated as:
Dcore=Dp·
f
LAC−fLAC·rext-LAC 1−fLAC·rext-LAC
13
(7) As shown in Eqs. (4), (6) and (7), the input parameters of the Mie model are the functions ofrext-LAC. Therefore, the HBF calculated with the Mie model is a function ofrext-LAC. The best estimation ofrext-LAC is the one which minimizes the differences between the calculated HBF and the correspond-ing measured value. The deviationχ2is quantified by linear least squares in the form of:
χ2= 3
X
i=1
HBFcalc
,i−HBFmeasure,i
HBFmeasure,i
2
(8)
whereidenotes the three operation wavelengths of the TSI 3563 nephelometer. HBFcalc,i is the HBF calculated with
Mie model, while HBFmeausre,i is the HBF measured by
nephelometer. The relationship between measured and cal-culated HBF at 700 nm is quite different from that at 450 and 550 nm. The measured HBF at 700 nm is too high, so most of them are around the calculated values of core-shell mix-ture. Heintzenberg et al. (2006) performed a laboratory com-parison study for 12 commercial nephelometers. Compared to calculated values, a systematic deviation of about –20 % was found for σsp,700 nm of TSI 3563 nephelometer. Such large underestimation ofσsp,700 nm would lead to a signifi-cant overestimation of HBF at 700 nm. Thus, only the HBF at 450 and 550 nm are used here to retrieve therext-LAC.
During the entire period of the HaChi summer campaign, 1-min-resolution data measured by nephelometer and MAAP were averaged to match the time of the 10-min-resolution PNSD records. Therext-LACwas subsequently retrieved by minimizing theχ2defined in Eq. (8).
It should be noted that therext-LACdefined in Sect. 3.1 is a parameter in a simplified aerosol optical model and would only be valid under some assumptions mentioned before.
The actual mixing state of aerosols in the atmosphere is far more complicated beyond the model capabilities. Thus, the retrievedrext-LACis an “effective parameter” and should not be used for quantitative analysis for the mixing state of LAC. However, the retrievedrext-LAC can be considered as an in-dicator for the variation of LAC mixing state and used in aerosol optical calculations, which is of great value in the re-search of aerosol and the estimation of the direct radiative forcing.
3.4 PartMC-MOSAIC model
The PartMC-MOSAIC model (Riemer et al., 2009) was ap-plied to simulate the diurnal variation of the mixing state of LAC. The PartMC-MOSAIC is a stochastic particle-resolved aerosol box model, capable of resolving the composition of an individual particle. A Monte Carlo approach is used in the PartMC model to simulate the coagulation process stochas-tically. Emissions and dilutions within the lower free tro-pospheric above the nocturnal boundary layer on a regional scale are also modeled in a stochastic manner. And a new aerosol chemistry model MOSAIC (Model for Simulating Aerosol interactions and Chemistry, Zaveri et al., 2008) is coupled in the PartMC to simulate the gas- and particle-phase chemistry, particle particle-phase thermodynamics, and dy-namic gas-particle mass-transfer in a deterministic manner. The PartMC-MOSAIC model can predict number, mass and composition distributions of the aerosol population.
4 Results and discussion
4.1 Calculated HBF based on the limiting mixing states of LAC: a closure study
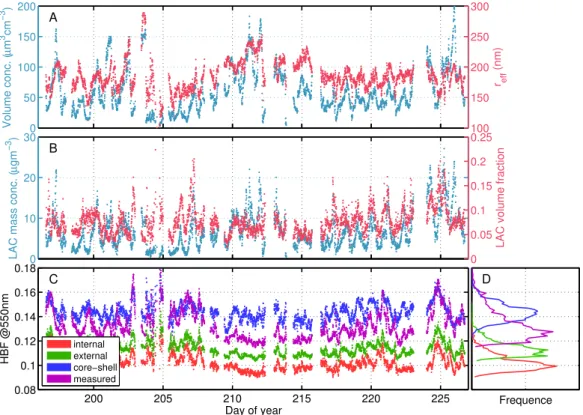
During the HaChi summer campaign, the PNSDs, LAC mass concentrations, scattering and hemispheric backscatter-ing coefficients for dried aerosols were continuously mea-sured on-line. An optical closure study on aerosol scatter-ing and absorption coefficients has been conducted by Ma et al. (2011), which showed that the data are of high quality. The time series of aerosol volume concentrations, effective radii, LAC mass concentrations, as well as the LAC volume fractions for the whole period of the campaign are shown in Fig. 1a and b. It can be seen that all of these parameters vary greatly with time, mainly in response to synoptic weather systems. Diurnal cycles are also present during some peri-ods. The average aerosol volume concentration for the di-ameter range from 3 nm to 10 µm is 59.74 µm3cm−3, with a 5th percentage value of 15.92 µm3cm−3and a 95th percent-age value of 137.49 µm3cm−3. The average aerosol effective radius, defined as reff=Rrrmax
min n(r)r
3dr.Rrmax rmin n(r)r
0 50 100 150 200
Volume conc. (
µ
m
3 cm
−3
)
100 150 200 250 300
r eff
(nm)
0 10 20 30
LAC mass conc. (
µ
gm
−3
)
0 0.05 0.1 0.15 0.2 0.25
LAC volume fraction
200 205 210 215 220 225
0.08 0.1 0.12 0.14 0.16 0.18
Day of year
HBF @550nm
internal external core−shell measured
Frequence A
B
C D
Fig. 1.Time series of selected parameters during the HaChi summer campaign:(A)aerosol volume concentration, effective radius,(B)LAC mass concentration, LAC volume fraction,(C)HBF measured by nephelometer and HBF calculated with three limiting mixing states of LAC at the wavelength of 550 nm.(D)frequency distributions of measured and calculated HBF. All the data have been averaged corresponding to the time of TDMPS measurement with time resolution of 10 min.
1.59 µg m−3 and a 95th percentage value of 15.87 µg m−3. Futher details on aerosol optical properties for the HaChi summer campaign can be found in Ma et al. (2011).
To simulate the measurements of nephelometer, the HBF was calculated with the Mie model and the aerosol model in-troduced in Sect. 3 based on the measured PNSDs and LAC mass concentrations. The mixing state of LAC and less ab-sorbing component was also needed in the simulation. Since there was no information on the mixing state of ambient aerosols available, the HBF was calculated for three limit-ing mixlimit-ing states of LAC: external mixture, homogeneously internal mixture and core-shell mixture. Figure 1c shows the calculation results at the wavelength of 550 nm, as well as the HBFs yielded from nephelometer measurements. Figure 1d presents the frequency of each time series of HBFs in Fig. 1c. It can be seen that the three calculated HBFs vary with time, which is caused by the variations of PNSDs and LAC mass concentrations. The relative standard deviations of cal-culated HBFs at 550 nm are respectively 5.2 %, 6.3 % and 5.1 % for the three assumptions of LAC mixing state men-tioned above. However, it should be noted that the differ-ences between the three time series of calculated HBF are more significant than the variations of each time series. The mean values of the three calculated HBF are shown in
Ta-ble 1. For 550 nm, the calculated HBF under the external mixture assumption (HBFcalc,external)is 11.4 % higher than that under the homogeneously internal mixture assumption (HBFcalc,internal). The calculated HBF under the core-shell mixture assumption (HBFcalc,core-shell)is even 41.0 % higher
than that under the homogeneously internal mixture assump-tion. These differences are much higher than the variations of each time series caused by the variations of PNSDs and LAC mass concentrations. Therefore, the calculated HBF is more sensitive to the mixing state of LAC rather than the variations of PNSDs and LAC mass concentrations. This sensitivity of HBF provides an approach to retrieve the mixing state of LAC, as described in Sect. 3.
In Fig. 1c, the purple dots denote the HBF yielded from the nephelometer measurements (HBFneph), i.e. the ratio of measured hemispheric backscattering coefficients to measured scattering coefficients. If the widely-used assumption that the atmospheric aerosol is a partial mixture of externally mixed and homogeneously internally mixed particles is appropriate, the HBFneph values should fall between the HBFcalc,external and the HBFcalc,internal.
How-ever, for 550 nm, almost all of the HBFneph are higher than the HBFcalc,external and HBFcalc,internal, and distributed
shows the averages of HBFcalc,external, HBFcalc,internal,
HBFcalc,core-shell and HBFneph at the three operation wave-lengths of the TSI 3563 nephelometer. It can be seen that the relationship of the calculated and measured HBF is HBFcalc,core-shell>HBFneph>HBFcalc,external>HBFcalc,internal.
The HBFneph at 700 nm is higher than all of the calculated ones. This might be caused by the underestimation of the TSI 3563 nephelometer on σsp,700 nm, as mentioned in
Sect. 3.3.
The mixing state of atmospheric aerosols is considered as an intermediate state between external and internal (Winkler, 1973). The internal mixture are usually treated as a homoge-neously internal mixture in aerosol optical calculations (Wex et al., 2002b; Mallet et al., 2004; Cheng et al., 2006). In that case, external mixture and homogeneously internal mix-ture are two limiting cases of mixing state. The aerosol op-tical properties calculated with the assumptions of external mixture and homogeneously internal mixture should be the boundaries of the measured values. However, as presented in this study, the HBFneph is significantly higher than both the HBFcalc,external and HBFcalc,internal, and is close to the
HBFcalc,core-shell. This means that the former assumptions of
LAC mixing state, which have been widely used in aerosol optical calculations, are generally not appropriate. In the NCP, the ambient aerosols seem to be more similar to core-shell mixtures, rather than to homogeneously internal mix-tures. The aerosols can be considered as a partial mixture of externally and core-shell mixed particles.
4.2 Retrieved mixing state of LAC
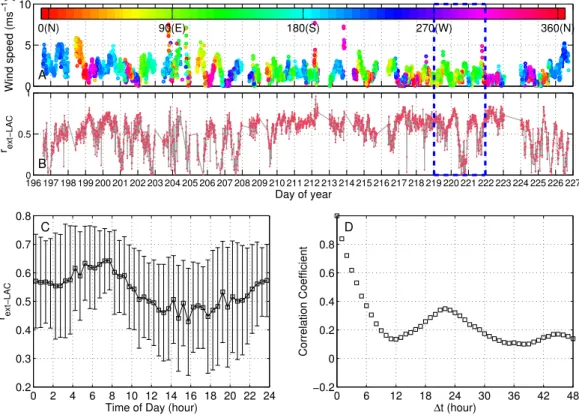
Therext-LAC was retrieved with the new method introduced in Sect. 3 for the whole period of the HaChi summer cam-paign. The time series ofrext-LAC is presented in Fig. 2b. The corresponding wind direction and wind speed measured by an automatic weather station are illustrated in Fig. 2a.
For the whole period, rext-LAC varied between 0 and 1, with an average of 0.51±0.21, indicating that the mixing state of LAC is a combination of external and core-shell mix-ture. Pronounced variation can be found in the time series of
rext-LAC, reflecting the large variation of LAC mixing state with time. Moreover, significant diurnal cycles ofrext-LAC can be discerned during some periods. The time-scale of the measured variability can be also revealed by autocorrelation analysis (Cheng et al., 2008). Figure 2d depicts the result of the autocorrelation analysis for the entire time series of
rext-LAC. When1t= 24 h, The autocorrelation coefficient of
rext-LAC shows a peak with a value of about 0.3, indicating the existence of pronounced diurnal cycles in the variation of
rext-LAC.
The average diurnal variation ofrext-LAC is illustrated in Fig. 2c, with error bar of one standard deviation. Consistent with the result of the autocorrelation analysis, a pronounced diurnal pattern can be found. Around midnight, the aver-agerext-LAC is around 0.58 and increases from 04:00 LT. A
Table 1. The average of calculated HBF under the assumptions of externally, homogeneously internally and core-shell mixture, as well as the averaged HBF measured by nephelometer.
λ(nm) HBFcalc,external HBFcalc,internal HBFcalc,core-shell HBFneph
450 0.1099 0.0967 0.1424 0.1292
550 0.1138 0.1023 0.1438 0.1329
700 0.1251 0.1152 0.1498 0.1569
maximum is reached at about 06:00 LT. And then rext-LAC decreases rapidly after 08:00 LT with the minimum appear-ing in the afternoon. Durappear-ing the night, the averagerext-LAC
increases again. This distinct diurnal pattern of average
rext-LAC reflects the diurnal variation of the mixing state of LAC and less absorbing component. During the night, the high level ofrext-LACindicates that the freshly emitted LAC, which is considered to be externally mixed with aged parti-cles, accumulates in the nocturnal boundary layer. The low value ofrext-LAC during daytime reflects the dominance of core-shell mixed particles in the boundary layer. Similar di-urnal pattern of aerosol mixing state was reported by Moffet and Prather (2009) and Liu et al. (2011).
4.3 Diurnal variation of LAC mixing state: a case study
To better understand the diurnal pattern of the rext-LAC re-trieved with this method, a period of 3 days (219-221 DOY) was selected for a case study. During this period, the syn-optic conditions were relatively stable, dominated by east-erly winds with speeds lower than 3 ms−1. The weather was cloud-free with no precipitation event occurred. Therefore, the aerosols in the boundary layer were mostly from local and regional emissions sources. With no obvious pollutant transport under this meteorological situation, this period was appropriate for investigating the diurnal variation of LAC mixing state caused by the evolution of boundary layer, emis-sions and corresponding chemical processes.
The time series of retrievedrext-LAC during this period is presented in Fig. 3b. A similar diurnal pattern, with high
rext-LAC during night and lowrext-LAC during daytime, can be found in all of the three days.
sizes, the number fraction of NH particles remains at a high level during the night and begins to decrease at 06:00 LT. During the daytime, the number fraction of NH stays at low level. And a rapid rise occurs around 18:00 LT. The high number fraction of NH particles during the night indicates that the freshly emitted hydrophobic particles have accumu-lated in the surface layer, apparently externally mixed with the hygroscopic particles. During the daytime, the low frac-tion of NH mode indicates that aged aerosol was dominant in the atmosphere near the surface (Liu et al., 2011). This result yielded from HHTDMA is well consistent with the di-urnal variation of retrievedrext-LAC.
In Liu’s (2011) work, a stochastic, particle-resolved aerosol model PartMC-MOSAIC was applied to simulate the aerosol hygroscopicity for the same period as in this study. A good agreement between the model results and the measure-ments indicates that the model can be well representative of the hygroscopicity of ambient aerosols. To investigate how the chemical and meteorological processes affect the diurnal variation of the mixing state of LAC, the same model was ap-plied in this study. The simulated scenario represented a La-grangian air parcel over a large megacity region. The model was initialized 12 h before the simulation period for model adjustment. The mixing layer height was set according to the boundary layer height simulated by the Weather Research and Forecasting (WRF) model. The temperature and wa-ter vapour mixing ratio were set based on the measurement. The initial gas phase concentrations and emission rates were set according to Riemer et al. (2009). Based on the PNSDs measured by TDMPS and APS, a tri-modal distribution was used as the initial PNSD. The initial aerosols were assumed to consist of (NH4)2SO4, primary organic aerosol and LAC, with mass fractions of 60 %, 35 % and 5 %, respectively. The aerosol emission pattern and chemical composition was set according to Riemer et al. (2009), while some modification was made to better represent the pollution in the North China Plain. More details about the parameter settings of the model can be found in Liu et al. (2011).
The model results are shown in Fig. 3c. The mass of the modelled externally mixed LAC is compared to the to-tal mass of the modelled LAC to yield therext-LAC,model. It
can be seen that the simulatedrext-LAC,model for all the size ranges match well with the retrievedrext-LAC, indicating that the variation of the modelled result is well consistent with that of retrievedrext-LAC. This means the diurnal pattern of retrievedrext-LAC can be explained by the mechanisms in-cluded in the model, such as emissions, aging processes and the entrainment by the increase of the mixing layer height. During the night, the freshly emitted LAC aerosols accumu-late in the shallow nocturnal boundary layer and the aging processes are relatively weak. Under such a condition, the fraction of the externally mixed LAC to the total LAC mass is relatively high. As illustrated in Fig. 3c, more than 80 % of LAC mass is externally mixed for the particles smaller than 125 nm. In the morning during 07:00 LT to 12:00 LT,
the development of the mixing layer causes a downward en-trainment of aged aerosol from aloft, resulting in a decrease of the fraction of externally mixed LAC. The aging processes may also make contributions. Only less than 40 % of LAC is externally mixed at noon. The fraction of externally mixed LAC remains low until the evening. The collapse of the mix-ing layer and the high emission rate due to rush hours cause a rapid increase in the fraction of externally mixed LAC, and the fraction remains high in the stable shallow nocturnal boundary layer. A sensitivity study of the modelled aerosol mixing state to the chemical and meteorological processes was performed by Liu et al. (2011). The results suggested that the diurnal evolution of the mixing layer was decisive in explaining the diurnal cycle of aerosol mixing state. Other processes such as condensation, photochemical aging and coagulation processes also made contributions but were not as effective as the evolution of the mixing layer. A similar boundary layer mechanism was also suggested by Rissler et al. (2006).
In Fig. 3c, therext-LAC,model for large particles are much lower than that for small ones. In the model, the initial aerosol for all size range is assumed to consist of LAC as 5 % in mass, and the freshly emitted LAC particles are assumed to be distributed as a log-normal distribution with geometric average diameter of 50 nm. Therefore, during the daytime as well as during the nighttime, the fraction of externally mixed LAC decreases with increasing particle size.
4.4 Sensitivity study
The input parameters of the new method include in situ mea-sured data (PNSDs, LAC mass concentrations, aerosol scat-tering and hemispheric backscatscat-tering coefficients) and some constants assumed beforehand (the refractive indices of LAC and less absorbing component, the density of LAC and the mass absorption efficiency (MAE)). The retrieved rext-LAC
would no doubt be influenced by the uncertainties of these variables. Also, some assumptions included in the model, such as spherical particles and constant fraction of LAC mass for all size, would introduce uncertainties to the retrieved
rext-LAC. In order to quantify the influences of the uncer-tainties of these input parameters and assumptions on the retrievedrext-LAC, a sensitivity study was performed. The potential uncertainties introduced by the assumptions in the model are discussed first. The sensitivity of the rext-LAC to the input parameters was determined by varying them individually and evaluating the changing of the retrieved
0 5 10
Wind speed (ms
−1
)
0(N) 90(E) 180(S) 270(W) 360(N)
196 197 198 199 200 201 202 203 204 205 206 207 208 209 210 211 212 213 214 215 216 217 218 219 220 221 222 223 224 225 226 2270 0.5
1
rext−LAC
Day of year
0 2 4 6 8 10 12 14 16 18 20 22 24
0.2 0.3 0.4 0.5 0.6 0.7 0.8
r ext−LAC
Time of Day (hour)
0 6 12 18 24 30 36 42 48
−0.2 0 0.2 0.4 0.6 0.8
Correlation Coefficient
∆t (hour)
A
B
C D
Fig. 2. (A)Time series of wind speed and wind direction (denoted by the colour of dots).(B)Time series of retrievedrext-LAC.(C)Average diurnal pattern ofrext-LAC.(D)Result of autocorrelation analysis ofrext-LAC. The dash-line box denotes the period selected as a case study.
4.4.1 Potential uncertainties introduced by the assumptions in the model
The most important assumption in the Mie theory is that all particles are spherical. This assumption simplifies the mathe-matical treatment. However, atmospheric aerosols are some-times non-spherical. Soot aggregates and mineral dust parti-cles are typical and often observed as non-spherical aerosols (Katrinak et al., 1993; Okada et al., 2001; Kaaden et al., 2009). The shape of the particles may influence their op-tical properties. If the responses of theσsp andσbsp to the particle shape are different, a large uncertainty will be in-troduced in the retrievedrext-LAC. Unfortunately, no liter-ature mentioning the dependence ofσbsp on particle shape was found. Therefore, it is difficult to quantify the influence of non-spherical particles on the retrievedrext-LAC.
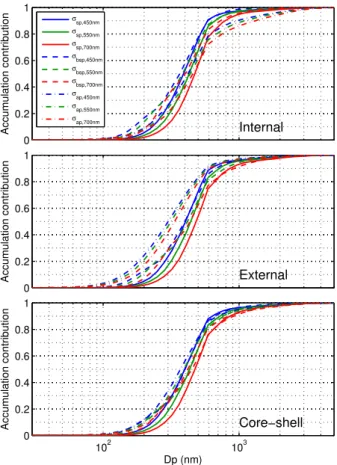
However, there is some indirect evidence from which we may estimate the influence. Figure 4 shows the cumulative contributions of aerosols with different size to the optical properties (i.e.σsp,σbsp andσap), which were derived with the Mie model, average PNSD and LAC mass concentration, and three assumed mixing states. It can be seen that at the wavelengths of 450 and 550 nm, the scattering and hemi-spheric backscattering are dominated by the particles with the size range from 100 to 600 nm in diameter, which are also the main part of the accumulation mode (Hussein et al.,
2005). Freshly generated soot exists in the form of chain-like aggregates. However, during aging processing, a marked change in morphology of soot particles occurs. It was found that a transformation of the soot aggregates to spherical par-ticles occurs as sulphuric acid and water condense onto fresh soot. Also, the soot core was restructured to more compact form (Zhang et al., 2008; Pagels et al., 2009). Therefore, the optical properties are thus considered to be mainly dominated by spherical particles.
For larger sizes, mineral dust particles with non-spherical shape exist. However, due to the huge concentrations of the fine particles in the NCP, the relative optical contribution is less than 20 % for particles larger than 600 nm, and is only about 5 % for super-micron particles. There was no strong dust event observed during the HaChi summer campaign. The influence of the non-spherical mineral dust particles is thus ignored. It should be noted that LAC is usually observed to be non-spherical and in the form of aggregate structures (Katrinak et al., 1993). However, there is not enough infor-mation available to evaluate the influence of these agglomer-ates on the retrievedrext-LAC.
0 2 4 6 8 10
Wind speed (ms
−1
)
N E S W N
0 0.2 0.4 0.6 0.8 1
rext−LAC
2190 6:00 12:00 18:00 220 6:00 12:00 18:00 221 6:00 12:00 18:00 222
0.2 0.4 0.6 0.8 1
rext−LAC,model
Time
15−30nm 30−60nm 60−125nm 125−250nm 250−500nm
A
B
C
Fig. 3. Time series of parameters for the selected period:(A)wind speed and wind direction (denoted by the colour of dots),(B)the retrieved
rext-LAC,(C)the fraction of externally mixed LAC at different size ranges yielded from the PartMC-MOSAIC model.
Table 2.rext-LACretrieved from assumed LAC volume fractions and measured LAC volume fractions.
case Inputs rext-LAC(assumed rext-LAC(measured (period for average) LAC volume LAC volume fractions) fractions)
average Whole period 0.587 0. 555
highrext-LAC DOY 220 – 220.25 0.744 0.724 lowrext-LAC DOY 220.5–220.75 0.183 0.102
information on the fractions of particles under different mix-ing states. In a field campaign near Beijing, Wehner et al. (2009) used a volatility tandem DMA to determine the aerosol volatility based on the changes in particle diameter between 25◦C and 300◦C. They found that most of the par-ticles had a low to moderate volatile fraction, correspond-ing to the externally mixed LAC and core-shell mixed LAC. Around 40 % of the particles with diameters smaller than 300 nm were found to have a large volatile fraction with over 55 % decrease in diameter after heating. If the non-volatile core in the high volatile particles is very small, it might not consist of LAC but of low-volatile organic material (Kalberer et al., 2004), since freshly emitted LAC particles are usually at least 50 nm in diameter (e.g., Harris and Maricq, 2001). Therefore, there are some externally mixed less absorbing
particles included in the high volatile group, with a num-ber fraction lower than 40 %. To estimate the influence on therext-LAC, therext-LAC was retrieved with the assumption that the externally mixed less absorbing particles exist with assumed number fractions. It was found that the retrieved
0 0.2 0.4 0.6 0.8 1
Accumulation contribution Internal
σ sp,450nm
σ sp,550nm σ
sp,700nm
σ bsp,450nm σ
bsp,550nm
σ bsp,700nm σ
ap,450nm
σ ap,550nm σ
ap,700nm
0 0.2 0.4 0.6 0.8 1
Accumulation contribution External
102 103
0 0.2 0.4 0.6 0.8 1
Dp (nm)
Accumulation contribution Core−shell
Fig. 4. The cumulative contributions of aerosols with different size to the optical properties:σsp,σbspandσap. The results is based on the Mie model, average PNSD and LAC mass concentration, and three assumed mixing states.
Another assumption included in the retrieving model is that the volume fraction of LAC is independent of particle size. This is no doubt the simplest description for LAC vol-ume size distribution. The real situation in the atmosphere is much more complicated. Freshly emitted LAC particles are usually concentrated at around 100 nm in diameter (Moffet and Prather, 2009). During coagulations and condensation processes, the LAC mass will be transferred to larger parti-cles. In order to evaluate the influence of this assumption on the retrievedrext-LAC, the average EC volume fractions ob-tained from the Berner impactor measurements were used, which are shown in Fig. 5. The size-dependent volume frac-tions of LAC were assumed to be the same as that of EC. The
rext-LAC was retrieved from the size-independent LAC vol-ume fractions and the average measured size-dependent LAC volume fractions, respectively. The calculations were carried out for three cases: average condition (using the average val-ues for the whole period as the inputs of the model), high
rext-LAC case (using the average values for the period from DOY 220 to DOY 220.25 as the inputs), and low rext-LAC
case (using the average values for the period from DOY
Table 3. Uncertainties of the input parameters for the retrieving algorithm, giving in terms of one standard deviation.
Parameter Standard
deviation (σ, %)
Dp,TDMPS 1.1
Dp,APS 3
NTDMPS,3−20 nm 10
NTDMPS,20−200 nm 3.3
NTDMPS,200−700 nm 8.3
NAPS 3.3
HBFneph 6.6
σap 4
MAE = 6.6 m2g−1 9.1
ρLAC= 1.5 g cm−3 11
nnon= 1.55 0.5
inon= 1e–7 0
nLAC= 1.80 4
iLAC= 0.54 6.6
220.5 to DOY 220.75 as the inputs). The results are pre-sented in Table 2.
The values retrieved with the measured size-dependent fractions are always higher than those retrieved with the size-independent fractions. The sensitivity of retrievedrext-LACto the assumption of LAC volume fraction distribution is also found to be insignificant. For the average case, the differ-ence between the two retrieved rext-LAC is 0.032. The dif-ference for the highrext-LAC case is only 0.02. But for the lowrext-LACcase, the difference reaches up to 0.081, which is relatively high. It seems that the lower therext-LACis, the more sensitive it becomes.
101 102 103 104
0 0.05 0.1 0.15 0.2 0.25 0.3 0.35
Dp (nm)
EC volume fraction
101 102 103 104
0 0.2 0.4 0.6 0.8 1 1.2 1.4
Dp (nm)
EC mass concentration (
µ
gm
−3
)
Fig. 5.The average distribution of EC mass concentration and EC volume fraction yielded from Berner impactor measurements.
4.4.2 Uncertainties of input parameters
All of the input parameters for the retrieving algorithm are listed in Table 3. The possible values of each parameter are assumed to be normally distributed with standard deviations presented in Table 3.
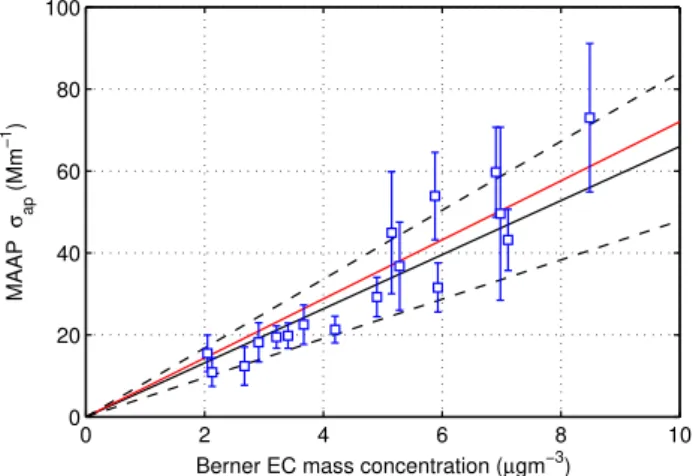
The uncertainty of the measured PNSD originates from the uncertainties of the TDMPS and APS measurements. From a comparison test reported by Wiedensohler et al. (2011), the maximum uncertainty of the particle size measured by mo-bility size spectrometers reaches 3.5 %, and the maximum uncertainty of the number concentration is 30 %, 10 % and 25 % for the size range of 3–20 nm, 20–200 nm and 200– 700 nm, respectively. These values are used as the uncer-tainties of the TDMPS measurement. For the size and num-ber concentration measured by APS, the uncertainty is re-spectively estimated as 9 % and 10 % (Wex et al., 2002b). The uncertainty of σap measured by MAAP is reported as about 12 % (Petzold et al., 2004). To convert σap to LAC mass concentration, a MAE of 6.6 m2g−1 is used in the MAAP. In order to estimate the uncertainty of this value, the Berner impactor-derived EC mass concentrations were com-pared with the MAAP-measuredσap, as shown in Fig. 6. It should be noted that LAC and EC are two different defini-tions and have slightly different thermal, optical and chem-ical behaviour. However, they share a similar fraction of the carbonaceous aerosol and are supposed to be comparable (Lavanchy et al., 1999). Thus, the LAC mass concentration is assumed to be the same as the Berner impactor-derived EC mass concentration. It can be seen that all data points locate around the line of MAE = 6.6 m2g−1, with determina-tion coefficientR2of 0.837. The coefficient of linear regres-sion is 7.20 m2g−1, which is close to the MAE value used in MAAP. Since there is no direct way to evaluate the un-certainty of MAE, the difference between the recommended value and the value yielded from the regression is taken as one standard deviation of the MAE, which is 9.1 %. This
Table 4.rext-LACretrieved with each input parameter varying from its original value to the original value plusσ, as well as the differ-ences (1)between each newrext-LACand original value.
Parameters average highrext-LAC lowrext-LAC
original 0.587 (0) 0.744 (0) 0.183 (0)
DTDMPS 0.566 (–0.021) 0.731 (–0.013) 0.136 (–0.047)
NTDMPS 0.545 (–0.042) 0.716 (–0.028) 0.097 (–0.086)
DAPS 0.600 (+0.013) 0.750 (+0.006) 0.195 (+0.012)
NAPS 0.586 (–0.001) 0.743 (–0.001) 0.180 (–0.003) HBFneph,450 nm 0.464 (–0.123) 0.667 (–0.077) 0 (–0.183) HBFneph,550 nm 0.479 (–0.108) 0.670 (–0.074) 0 (–0.183)
σap 0.604 (+0.017) 0.755 (+0.011) 0.216 (+0.033)
MAE 0.548 (–0.039) 0.719 (–0.025) 0.105 (–0.078) LAC density 0.540 (–0.047) 0.713 (–0.031) 0.089 (–0.094)
nnon 0.612 (+0.025) 0.760 (+0.016) 0.219 (+0.036) nLAC 0.611 (+0.024) 0.760 (+0.016) 0.240 (+0.057)
iLAC 0.610 (+0.023) 0.759 (+0.015) 0.229 (+0.046)
value is an empirical estimation and only valid in this study. The corresponding uncertainty of the MAE (3σ ) is also il-lustrated in Fig. 6 as dash lines. In literature (Sloane et al., 1983, 1984, 1991; Sloane and Wolff, 1985; Ouimette and Flagan, 1982; Seinfeld and Pandis, 1998),ρEC is reported as a range from 1.00 g cm−3 to 2.00 g cm−3. Accordingly, the uncertainty ofρECis set to be 33 % to cover the above mentioned range. The uncertainties for the refractive indices of LAC and less absorbing component are chosen according to Cheng et al. (2006). Their estimated uncertainties for the real part of refractive index of the less absorbing component, the real part and imaginary part of refractive index of LAC are 1.5 %, 12 % and 20 %, respectively. The uncertainty of the HBF derived from the nephelometer measurements is es-timated as 20 % (Anderson et al., 1996).
4.4.3 Sensitivities of retrievedrext-LACto the uncertainties of input parameters
The sensitivities of the retrievedrext-LACto the uncertainty of each input parameter were investigated for three cases: aver-age condition (using the averaver-age values for the whole period as the inputs of the model), highrext-LACcase (using the av-erage values for the period from DOY 220 to DOY 220.25 as the inputs), and lowrext-LAC case (using the average values for the period from DOY 220.5 to DOY 220.75 as the in-puts). Therext-LACwas retrieved with one parameter varying from its original value to the original plus oneσ, while keep-ing other parameters fixed. The difference between the new
0 2 4 6 8 10 0
20 40 60 80 100
Berner EC mass concentration (µgm−3)
MAAP
σap
(Mm
−1
)
Fig. 6.Comparison of theσapmeasured by MAAP and the Berner impactor-derived EC mass concentrations. The result of linear re-gression is shown as red line (b = 7.20 m2g−1,R2=0.837). The black line corresponds with MAE = 6.6 m2g−1. The error bar of each data point denotes the standard deviation of theσapaveraged to yield the data, since the time resolution ofσapis much higher than that of the impactor-derived EC mass concentrations.
Table 3 that, among all of the input parameters, the largest influence on retrievedrext-LACstems from the uncertainty of HBF. A shift of 6.6 % in HBF leads to a shift of more than 0.1 inrext-LACfor the average case. However, it should be noted that there is no reference in the literature to the uncertain-ties ofσbspor HBF measured by the TSI 3563 nephelometer. Only one reference (Anderson et al., 1996) mentioned that the uncertainty of HBF derived by the TSI 3563 nephelome-ter is within 20 %. Therefore, the influence of the uncertainty of measured HBF should be reconsidered after getting a bet-ter estimation of the uncertainty of the measurement.
The second largest influence on retrievedrext-LAC comes from the uncertainty of LAC density. Due to the large range of LAC density reported in the literature, the standard devia-tion of LAC density is estimated as 11 %, which is the highest among all of the input parameters. This high standard devi-ation of LAC density induces a shift of 0.047 inrext-LACfor the average case.
Following the LAC density, the uncertainty of measured LAC mass concentration also makes a great contribution. The uncertainty of LAC mass concentration is separated into two parts, the uncertainty of the measuredσapand the uncer-tainty of the MAE, and treated separately. For the average case, a shift of 4 % in measuredσapleads to a shift of 0.017 inrext-LAC, while a shift of 9.1 % in MAE leads to a shift of 0.039 inrext-LACfor the average case.
The influences of the uncertainties in the refractive indices on rext-LAC are of the same magnitude. A shift of one σ in each of the three assumed refractive indices respectively causes a shift of around 0.024 inrext-LACfor the average case.
For the PNSD, a shift of oneσin the size and number con-centration of TDMPS measurement leads to a shift of 0.021 and 0.042 inrext-LACfor the average case, respectively. How-ever, it can be seen that the influence of the uncertainties in the APS data onrext-LACis weak. Since an averaged PNSD was used in this sensitivity study, the contribution of parti-cles in the size range of the APS measurements to the overall aerosol optical properties is relatively small. During certain heavy pollution periods, the contribution of coarse particles to the overall aerosol optical properties might be significant. In those cases, the influence of the uncertainties in the APS measurement torext-LACmight become higher.
It should be noted that the influences of the uncertain-ties of model inputs onrext-LACalso depend on the levels of
rext-LAC. The lower therext-LACis, the more significant the influence would be. It means that therext-LACwith low val-ues have more uncertainty than those with high valval-ues. This also can be seen in Fig. 3b,rext-LACwith lower values show much larger variability than those with higher values.
Overall, the retrievedrext-LACshows the highest sensitiv-ity to the HBF yielded from the nephelometer measurements, followed by the assumed LAC density. The uncertainty in the LAC mass concentration also makes great contribution. The uncertainties in the refractive indices of less absorbing com-ponent and LAC cause similar responses inrext-LAC. And the influence of the uncertainties in measured PNSD onrext-LAC is relatively low among the input parameters. Therefore, un-der current method, an accurate measurement ofσspandσbsp is most important to retrieverext-LAC. A better estimation of the uncertainties in measuredσbspor HBF is urgently needed. Furthermore, more accurate estimations of the LAC density and the refractive indices are required to reduce the uncer-tainty of retrievedrext-LAC.
4.4.4 Monte Carlo variations
A Monte Carlo simulation was applied to investigate the overall influence of input parameters on the retrievedrext-LAC for the three cases mentioned in Sect. 4.4.3. The retrieving algorithm was repeated using a randomly varying set of in-put parameters. The random values of the inin-put parameters were generated independently. The values of each input pa-rameter were normally distributed, with the original value used in Sect. 4.4.3 as the mean value, and the standard devi-ation listed in Table 3. 2000 runs were carried out to yield a stable distribution of the retrievedrext-LAC. The retrieved
5 Summary and conclusions
In this paper, a new method was proposed to retrieve infor-mation on the mixing state of LAC from measured PNSDs, LAC mass concentrations and HBFs.
Based on a two-parameter optical aerosol model, an aerosol optical closure was conducted using independent in situ measured data. The HBFs yielded from the neph-elometer were compared with the values calculated from the PNSDs and LAC mass concentrations with a modified Mie model. Three limiting mixing states of LAC were assumed in the calculation: external mixture, homogeneously internal mixture and core-shell mixture. It was found that the HBF is more sensitive to the assumption of LAC mixing state, rather than to the variations of the PNSDs or the LAC mass con-centrations. The HBFs calculated based on core-shell mix-ture are much higher than those based on external mixmix-ture or homogeneously internal mixture. Moreover, almost all of the HBFs yielded from the nephelometer locate between the values calculated based on core-shell mixture and external mixture, but are much higher than the values calculated un-der the homogeneously internal mixture assumption. This finding indicates that the assumption of LAC mixing state which has been widely applied in aerosol optical calcula-tions cannot be used properly in the NCP. In this area, the internally mixed aerosols are rather core-shell mixed than ho-mogeneously mixed. Thus, an assumption of a system con-sisting of externally mixed LAC and core-shell mixed LAC and less absorbing component is more appropriate in aerosol optical calculations.
With the new method, a high-resolution time series of the mass fraction of the externally mixed LAC was retrieved from in situ measurements of PNSDs and LAC mass con-centrations. A pronounced diurnal cycle was found. During the night, the average rext-LAC is around 0.58, and reaches its maximum around 06:00 LT, indicating the accumulation of the freshly emitted LAC in the nocturnal boundary layer. During the daytime,rext-LACremains at a relatively low level, reflecting the dominance of aged aerosol in the boundary layer. This diurnal variation ofrext-LACis mainly caused by the diurnal evolution of the mixing layer. Other processes, such as condensation, coagulation and photochemical aging, also make contributions. As a case study, a three-day period with constant synoptic situation was selected. A stochastic, particle-resolved aerosol model PartMC-MOSAIC was ap-plied to yield the information of LAC mixing state during this period. The retrievedrext-LACand the model results showed a very similar variation patterns. This good agreement fur-ther proves our explanations for the diurnal pattern of the retrievedrext-LAC.
A sensitivity study was carried out to investigate the sen-sitivities of the retrievedrext-LAC to the input parameters of the algorithm. The retrievedrext-LACshows the highest sen-sitivity to the HBF yielded from the nephelometer measure-ments, followed by the assumption of the LAC density. The
uncertainties in the LAC mass concentrations and the refrac-tive indices also cause great influences onrext-LAC. It was found thatrext-LAC with low values have more uncertainty than those with high values. The overall uncertainty of the retrievedrext-LACwas derived via the Monte Carlo approach. Considering the uncertainties of all input parameters of the algorithm, the standard deviation of the retrieved rext-LAC
was found to be 0.20 for average case.
Acknowledgements. This work is supported by the National Natural Science Foundation of China (NSFC) under Grant No. 40875001 and by the German Science Foundation under grant DFG WI 1449/14-1. Funds for this experiment were also provided by: China 973 project 2011CB403402, NSFC project 40975083 and Basic Research Fund of China Academy of Meteorological Sciences 2008Z011.
Edited by: D. Covert
References
Anderson, T. L. and Ogren, J. A.: Determining aerosol radiative properties using the TSI 3563 Integrating Nephelometer, Aerosol Sci. Technol., 29, 57–69, 1998.
Anderson, T. L., Covert, D. S., Marshall, S. F., Laucks, M. L., Charlson, R. J., Waggoner, A. P., Ogren, J. A., Caldow, R., Holm, R. L., Quant, G., Sem, J., Wiedensohler, A., Ahlquist, N. A., and Bates, T. S.: Performance characteristics of a High-sensitivity, three-wavelength total scatter/backscatter nephelometer, J. At-mos. Ocean. Tech., 13, 967–986, 1996.
Albrecht, B. A.: Aerosols, cloud microphysics, and fractional cloudiness, Science, 245, 1227–1230, 1989.
Bohren, C. F. and Huffman, D. R.: Absorption and Scattering of Light by Small Particles, John Wiley, Wiley, New York, USA, 1983.
Bond, T. C. and Bergstrom, R. W.: Light absorbing by carbona-ceous particles: An investigative review, Aerosol Sci. Tech., 40, 27–67, 2006.
Bond, T. C. and Sun, H. L.: Can reducing black carbon emission counteract global warming?, Environ. Sci. Technol., 39, 5921– 5926, 2005.
Bond, T. C., Streets, D. G., Yarber, K. F., Nelson, S. M., Woo, J.-H., and Klimont, Z.: A technology-based global inventory of black and organic carbon emissions from combustion, J. Geo-phys. Res., 109, D14203, doi:10.1029/2003jd003697, 2004. Chandra, S., Satheesh, S. K., and Srinivasan, J.: Can the state of
mixing of black carbon aerosols explain the mystery of “ex-cess” atmospheric absorption?, Geophys. Res. Lett., 31, L19109, doi:10.1029/2004GL020662, 2004.
Charlson, R. J., Schwartz, S. E., Hales, J. M., Cess, R. D., Coakley Jr., J. A., Hansen, J. E., and Hofmann, D. J.: Cli-mate forcing by anthropogenic aerosols, Science, 255, 423–430, doi:10.1126/science.255.5043.423, 1992.
derived from in situ particle optical properties at Xinken in Pearl River Delta of China, J. Geophys. Res., 111, D20204, doi:10.1029/2005JD006929, 2006.
Cheng, Y. F., Wiedensohler, A., Eichler, H., Su, H., Gnauk, T., Br¨uggemann, E., Herrmann, H., Heintzenberg, J., Slanina, J., Tuch, T., Hu, M., and Zhang, Y. H.: Aerosol optical proper-ties and related chemical apportionment at Xinken in Pearl River Delta of China, Atmos. Environ., 42, 6351–6372, 2008. Cheng, Y. F., Berghof, M., Garland, R. M., Wiedensohler, A.,
Wehner, B., M¨uller, T., Su, H., Zhang, Y. H., Achtert, P., Nowak, A., P¨oschl, U., Zhu, T., Hu, M., and Zeng, L. M.: Influ-ence of soot mixing state on aerosol light absorption and sin-gle scattering albedo during air mass aging at a polluted regional site in northeastern China, J. Geophys. Res., 114, D00G10, doi:10.1029/2008JD010883, 2009.
Clarke, A. D., Shinozuka, Y., Kapustin, V. N., Howell, S., Huebert, B., Doherty, S., Anderson, T., Covert, D., Anderson, J., Hua, X., Moore II, K. G., McNaughton, C., Carmichael, G., and We-ber, R.: Size distributions and mixtures of dust and black carbon aerosol in Asian outflow: Physiochemistry and optical proper-ties, J. Geophys. Res, 109, D15S09, doi:10.1029/2003JD004378, 2004.
Cooke, W. F., Liousse, C., Cachier, H., and Feichter, J.: Con-struction of a 1×1 fossil fuel emission data set for carbona-ceous aerosol and implementation and radiative impact in the ECHAM4 model, J. Geophys. Res., 104, 22137–22162, 1999. Covert, D. S., Heintzenberg, J., and Hansson, H. C.: Electro-optical
detection of external mixtures in aerosols, Aerosol Sci. Technol., 12, 446–456, 1990.
d’Almeida, G. A., Koepke, P., and Shettle, E. P.: Atmospheric Aerosols–Global Climatology and Radiative Characteristics, A. Deepak, Hampton, Va, 1991.
Dey, S., Tripathi, S. N., and Mishra, S. K.: Probable mixing state of aerosols in the Indo-Gangetic Basin, northern India, Geophys. Res. Lett., 35, L03808, doi:10.1029/2007GL032622, 2008. Harris, J. S. and Maricq, M. M.: Signature size distributions for
diesel and gasoline engine exhaust particulate matter, J. Aerosol Sci., 32, 749–764, 2001.
Hasan, H. and Dzubay, T. G.: Apportioning light extinction coeffi-cients to chemical species in atmospheric aerosol, Atmos. Envi-ron., 17, 1573–1581, 1983.
Heintzenberg, J., Wiedensohler, A., Tuch, T. M., Covert, D. S., Sheridan, P., Ogren, J. A., Gras, J., Nessler, R., Kleefeld, C., Kalivitis, N., Aaltonen, V., Wilhelm, R. T., and Havlicek, M.: Intercomparsions and aerosol calibrations of 12 commercial in-tegrating nephelometer of 15 three manufacturers, J. Atmos. Ocean. Tech., 23, 902–914, 2006.
Hennig, T., Massling, A., Brechtel, F. J., and Wiedensohler, A.: A tandem DMA for highly temperature-stabilized hy-groscopic particle growth measurements between 90 % and 98 % relative humidity, J. Aerosol Sci., 36, 1210–1223, doi:10.1016/j.jaerosci.2005.01.005, 2005.
Hussein, T., Dal Maso, M., Petaja, T., Koponen, I. K., Paatero, P., Aalto, P. P., Hameri, K., and Kulmala, M.: Evaluation of an auto-matic algorithm for fitting the particle number size distributions, Boreal Environ. Res., 10, 337–355, 2005.
IPCC: Climate Change 2007 – The Physical Science Basis, edited by: Solomon, S., Cambridge University Press, New York, USA, 2007.
Jacobson, M. Z.: A physically-based treatment of elemental car-bon optics: Implications of 25 global direct forcing of aerosols, Geophys. Res. Lett., 27, 217–220, 2000.
Jacobson, M. Z.: Strong radiative heating due to the mixing state of black carbon in atmospheric aerosols, Nature, 409, 695–697, 2001.
Kaaden, N., Massling, A., Schladitz, A., M¨uller, T., Kandler, K., Sch¨utz, L., Weinzierl, B., Petzold, A., Tesche, M., Leinert, S., Deutscher, C., Ebert, M., Weinbruch, S., Wiedensohler, A.: State of mixing, shape factor, number size distribution, and hygro-scopic growth of the Saharan anthropogenic and mineral dust aerosol at Tinfou, Morocco, Tellus, 61B, 51–63, 2009.
Kalberer, M., Paulsen, D., Sax, M., Steinbacher, M., Dommen, J., Prevot, A. S. H., Fisseha, R., Weingartner, E., Frankevich, V., Zenobi, R., Baltensperger, U.: Identification of polymers as ma-jor components of atmospheric organic aerosols, Science, 303, 1659–1662, 2004.
Katrinak, K. A., Rez, P., and Buseck, P. R.: Structural variations in individual carbonaceous particles from an urban aerosol, Envi-ron. Sci. Technol., 26, 1967–1976, 1992.
Katrinak, K. A., Rez, P., Perkes, P. R., and Buseck, P. R.: Frac-tal geometry of carbonaceous aggregates from an urban aerosol, Environ. Sci. Technol, 27, 539–547, 1993.
Khalizov, A. F., Xue, H., Wang, L., Zheng, J., and Zhang, R.: En-hanced light absorption and scattering by carbon soot aerosol in-ternally mixed with sulfuric acid, J. Phys. Chem. A, 113, 1066– 1074, doi:10.1021/jp807531n, 2009.
Kristjansson, J. E.: Studies of the aerosol indirect effect from sul-fate and black carbon aerosols, J. Geophys. Res., 107, 4246, doi:10.1029/2001JD000887, 2002.
Lavanchy, V. M. H., G¨aggeler, H. W., Nyeki, S., and Baltensperger, U.: Elemental carbon (EC) and black carbon (BC) measurements with a thermal method and an aethalometer at the high-alpine research station Jungfraujoch, Atmos. Environ., 33, 2759–2769, 1999.
Liu, P., Zhao, C., Zhang, Q., Deng, Z., Huang, M., Ma, X., and Tie, X.: Aircraft study of aerosol vertical distributions over Beijing and their optical properties, Tellus B, 61, 756–767, 2009. Liu, P. F., Zhao, C. S., G¨obel, T., Hallbauer, E., Nowak, A., Ran,
L., Xu, W. Y., Deng, Z. Z., Ma, N., Mildenberger, K., Henning, S., Stratmann, F., and Wiedensohler, A.: Hygroscopic properties of aerosol particles at high relative humidity and their diurnal variations in the North China Plain, Atmos. Chem. Phys., 11, 3479–3494, doi:10.5194/acp-11-3479-2011 2011.
Ma, N., Zhao, C. S., Nowak, A., M¨uller, T., Pfeifer, S., Cheng, Y. F., Deng, Z. Z., Liu, P. F., Xu, W. Y., Ran, L., Yan, P., G¨obel, T., Hallbauer, E., Mildenberger, K., Henning, S., Yu, J., Cheng, L. L., Zhou, X. J., Stratmann, F., and Wiedensohler, A.: Aerosol op-tical properties in the North China Plain during HaChi campaign: an in-situ optical closure study, Atmos. Chem. Phys. Discuss., 11, 9567–9605, doi:10.5194/acpd-11-9567-2011, 2011. Mallet, M., Roger, J. C., Despiau, S., Putaud, J. P., and Dubovik.
O.: A study of the mixing state of black carbon in urban zone, J. Geophys. Res., 109, D04202, doi:10.1029/2003JD003940, 2004. Mie, G.: Beitr¨age zur optic tr¨uber Medien speziell kolloidaler
Met-all¨osungen, Ann. Phys., 25, 377–445, 1908.