www.adv-geosci.net/29/27/2011/ doi:10.5194/adgeo-29-27-2011
© Author(s) 2011. CC Attribution 3.0 License.
Geosciences
Forecast convergence score: a forecaster’s approach to analysing
hydro-meteorological forecast systems
F. Pappenberger1, K. Bogner3, F. Wetterhall4,2, Y. He5,2, H. L. Cloke2, and J. Thielen3
1European Centre For Medium Range Weather Forecasts, Reading, UK 2Department of Geography, King’s College London, London, UK 3EU Joint Research Center, Ispra, Italy
4Swedish Meteorological and Hydrological Institute, Norrk¨oping, Sweden 5Tyndall Centre for Climate Change Research, University of East Anglia, UK
Received: 23 June 2010 – Revised: 18 October 2010 – Accepted: 11 November 2010 – Published: 25 February 2011
Abstract. In this paper the properties of a hydro-meteorological forecasting system for forecasting river flows have been analysed using a probabilistic forecast conver-gence score (FCS). The focus on fixed event forecasts pro-vides a forecaster’s approach to system behaviour and adds an important perspective to the suite of forecast verification tools commonly used in this field. A low FCS indicates a more consistent forecast. It can be demonstrated that the FCS annual maximum decreases over the last 10 years. With lead time, the FCS of the ensemble forecast decreases whereas the control and high resolution forecast increase. The FCS is in-fluenced by the lead time, threshold and catchment size and location. It indicates that one should use seasonality based decision rules to issue flood warnings.
1 Introduction
Analysing the performance of a hydro-meteorological fore-cast system is one important component in establishing trust in the forecast results. If the forecasting system is designed to issue early flood warnings for medium to severe events such as the European Flood Alert System (EFAS, Thielen, 2009a) then this presents a particular challenge due to the low frequency of extreme events and the non-stationary of river flows (Cloke and Pappenberger, 2009). The perfor-mance of EFAS has recently been analysed over a 10 year period (Pappenberger et al., 2010) and the skill of the EFAS forecasts has been shown to steadily increase. This study concentrated mainly on “rolling event forecasts” where the properties of a series of forecasts with a fixed lead time are
Correspondence to:F. Pappenberger ([email protected])
analysed (Holden et al., 1985). Although this gives impor-tant insights into the performance of a hydro-meteorological forecasting system, it is somewhat counter-intuitive as the process of issuing a forecast focuses on a particular event in the future. In contrast, a “fixed-event forecast” analyses the performance with respect to a given event and thus compares forecasts with different lead times using a probabilistic fore-cast convergence score (FCS) (Nordhaus, 1987; Clements, 1997; Clements and Taylor, 2001). Such an analysis can be used to understand the “Jumpiness”, “Turning points”, “Con-tinuity”, “Swings” or “Inconsistency” of a forecast time se-ries (Zoster et al., 2009; Mills and Pepper, 1999; Lashley et al., 2008), which is a sequence of forecasts with change in behaviour. Understanding such a change in forecast be-haviour is an intrinsic part of any decision making process. Strongly changing consecutive forecasts may make it more difficult to derive a decision. This is compounded by the issue that decision makers know that the number of false alarms must be minimised as in the case of flood forecast-ing (see Demeritt et al., 2007).
performance measures (Kay, 2004). However, it is as im-portant as measuring forecast quality and can add value for forecast customers (Lashley et al., 2008)
The objective of this paper is to analyse the system proper-ties of the EFAS focusing on fixed events. It will concentrate on three main questions: (1) Did the FCS change over a 10 year period? (2) What is the impact of forecast lead time on the FCS? and (3) what is the impact of different thresholds on the FCS? This is the first application of the FCS concept to a hydro-meteorological forecasting chain and probabilistic forecasts.
2 Setting of this study
In this paper we analyse forecasts from the EFAS, which aims at increasing preparedness for floods in trans-national European river basins by providing local water authorities with medium-range and probabilistic flood forecasting in-formation 3 to 10 days in advance (Thielen et al., 2009a, b), complementary to Member State forecasting systems. For this study, EFAS river discharge forecasts have been re-forecasted every week for a period of 10 years using the weather forecast available at the time as input. Here we use the control (the central unperturbed analysis), Ensemble (Ensemble Prediction Systems (EPS), 50 forecasts with per-turbed initial conditions) and high-resolution weather fore-casts of European Centre for Medium Range Weather Fore-casts (ECMWF). An EPS accounts for the sensitivity of the non-linear set of equations of the numerical weather pre-diction (NWP) models to errors in the initial conditions as well as errors introduced through imperfections in the model. All simulations are evaluated for a total of 1025 river gaug-ing stations distributed across Europe. The selected sta-tions are sufficiently separated in space to avoid crosscor-relation of station time series. Further details of the 10 year re-forecasts and the European set-up are available in Pappenberger et al. (2010).
3 Probabilistic forecast convergence score
The properties of fixed event forecasts have been analysed in economics, particularly in fields such as inflation and growth forecasting, using several different measures ranging from regression, root mean squared error and bias-based ap-proaches (Nordhaus, 1987; Clements, 1997; Clements and Taylor, 2001; Mills and Pepper, 1999; Bakhshi et al., 2005) to pseudo-maximum likelihood estimators (Clements and Taylor, 2001). In weather forecasting a latitude weighted root mean squared error (Zsoter et al., 2009) and the Ruth-Glahn forecast convergence score (Ruth et al., 2009) have been used. So far no application in hydro-meteorological forecasting or for probabilistic forecasts exists.
A drawback of the previous studies is that none has calcu-lated probabilistic measures of FCS although this is straight
forward. The most important consideration in selecting which performance measure to use in the FCS calculation is that the score is fit for purpose (Cloke and Pappenberger, 2008). This paper will only show one single type of mea-sure to introduce the concept. However, it should be made clear that no single measure can completely describe this at-tribute. In this application, the FCSBSis based on the Brier Score and measures the mean squared probability difference between two forecasts from different lead times. Any other probabilistic score could be used such as the (Continuous) Rank Probability Score (FCSCRPS), Ignorance Score (FCSIS)
or ROC Area (FCSROC−Area)and hence allows the FCS max-imum flexibility. We use 7 different river discharge thresh-olds (4 EFAS threshthresh-olds representing return periods of 1, 2, 5 and 20 years andQ90,Q50,Q10 as explained below). FCSBS= 1
N N
X
i=0
(fi,t,l−fi,t−d,l−d)
2 (1)
N: length of time series and/or number of stations
f: probability of forecast exceeding a certain river dis-charge threshold with lead timelissued at timet
d: delay
Low (high) values of FCSBS, indicate consistency (incon-sistency) between the compared forecasts. This measure in-dicates a system attribute rather than a system performance, thus there is no optimal or sub-optimal behaviour. It can be compared to the natural variability of for example scores of observations with a distance d, which in fact is a measure of autocorrelation. The score can be extended to measure the number of significant swings or turning points by defining a FCSBS level above which represents the minimum change necessary to count as a swing (extending the concept of Ruth et al., 2009 to probabilistic scores). It is also possible to in-tegrate over several lead times. However, this is beyond the scope of this paper.
EFAS uses four thresholds to issue flood warnings, namely severe, high, medium and low. These are generated from the model climatology of a 17-year run (1990–2006) with ob-served data on a daily time step. In this study, we have also analysed all percentiles from 5 to 95 percentile, and the re-sults section will concentrate on theQ90,Q50 andQ10 to represent the typical flow statistics of a hydrological time se-ries. The selected quantiles are of course not directly flood related and are more relevant for water management, how-ever, they allow some conclusions on the general behaviour of a forecasting system.
4 Results
4.1 Did the FCS change over a decade?
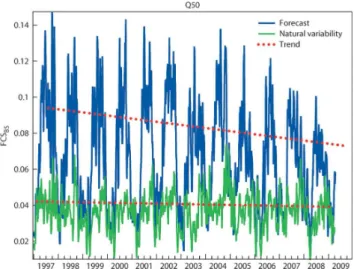
be observed with other lead days). In an early warning sys-tem such as EFAS these are the most important lead-times as they are outside the reach of deterministic predictability (for the medium-size catchments) and not yet in the range of high uncertainty. The figure shows a seasonal cycle with higher inconsistencies in the forecast (high FCSBS)during the rainy period and lower values during drier episodes. The figure also indicates natural variability derived from the ob-servations for comparison. Although one does not expect the forecast to fully follow this natural variability, it still will influence the forecast. Such a fluctuation would have to be reflected in any decision rules for flood warnings. There is no significant trend in the annual mean or the minimum. How-ever the FCSBSdecreases in the maximum over 13 years in-dicating an increased consistency (minimum trend and maxi-mum trend are indicated by dotted lines in Fig. 1). One might expect that the analysis will be influenced by major hydro-logical events. In 2000, 2002, 2005 and 2006 more than the average number of floods occurred in Europe. In addi-tion there has been one large drought (2003) in the evalua-tion period and several minor ones (EM-DAT, 2010). More-over, there have been changes to the ECMWF weather fore-casts: 2 increases in resolution (November 2000 and Febru-ary 2006) and two major changes to the convection scheme (January 2003 and November 2007). The two changes intro-duced to ECMWF forecasts seem to have improved consis-tency during wet seasons when one considers above-average flood events actually occurred in 2000, 2002, 2005 and 2006. However, individually none of these factors seems to have had a major impact on the results. Thus the increase in con-sistency is most probably the accumulated effect of changes in the NWP system and the effect of ever improving data as-similation over the years.
4.2 Impact of forecast lead time on the FCSBS
Figure 2 shows a clear impact of lead time on the FCSBS forQ50 (all other thresholds show the same behaviour). For the EPS the index decreases over time as the EPSs are ap-proaching climatological distribution and as such become in-creasingly similar in the threshold exceedance values. The High resolution and Control forecast show the opposite be-haviour with an increasing FCSBSover lead time. The error of these forecasts increases with lead time and thus there is a higher probability of the forecast jumping. This means a larger forecast discrepancy can be expected between day 9 and 10 than day 2 and 3. In other words, the probability of the forecasts being different between days 9 and 10 is greater than discrepancies between days 2 and 3. The control fore-cast has a lower FCSBSbecause of its coarser resolution and is therefore smoother (see also results in Zsoter et al., 2009). The EPS has even in the beginning a lower FCSBS which should make it more suitable for flood forecasting decision-making. It should be noted that EPSs also have a higher skill than deterministic forecasts (see Pappenberger et al., 2010).
Fig. 1. FCSBS averaged over Europe from 1 January 1997 to 31 April 2009 for the Q50 threshold comparing forecasts of day 5 and 6. The straigth-dotted lines indicate the trends in the max-ima and minmax-ima of this time series. The bottom line shows natural variability.
Fig. 2. Comparison of FCSBSover different lead times and fore-casts driven by different NWP systems for theQ50 threshold.
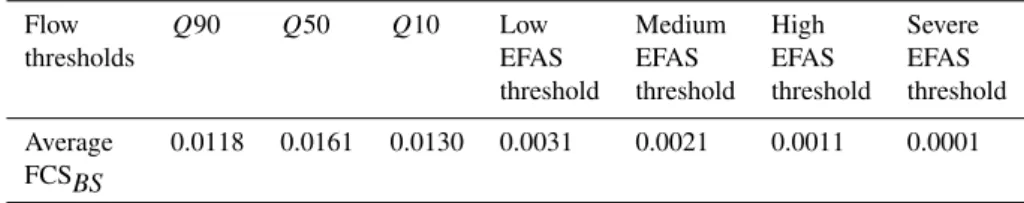
Table 1.Impact of different thresholds on FCSBS.
Flow Q90 Q50 Q10 Low Medium High Severe
thresholds EFAS EFAS EFAS EFAS
threshold threshold threshold threshold
Average 0.0118 0.0161 0.0130 0.0031 0.0021 0.0011 0.0001 FCSBS
Table 2.Impact of catchment size on FCSBS.
Catchment size <4000 km2 4000 km2–8000 km2 8000 km2–12 000 km2 >12000 km2
High-resolution 0.037∗ 0.037 0.034∗ 0.028∗
Control 0.036∗ 0.035 0.033∗ 0.025∗
Ensemble 0.009 0.008 0.008 0.006∗
*FCSBSindicates a significant difference to surrounding values
4.3 Impact of different thresholds on the FCSBS
So far all results have been based on using theQ50 threshold for illustration purposes. Although there are some minor dif-ferences between the thresholds, all other thresholds exhibit a broadly similar behaviour and would not lead to different conclusions (Table 1). The EFAS alert levels clearly show low values indicating a high consistency in comparison to
Q10,Q50 andQ90. However, this is misleading as the alert levels are rarely exceeded and thus have a substantial number of correct rejections. OtherwiseQ50 shows the highest num-ber of FCSBSwithQ10 andQ90 indicating lower numbers.
4.4 Impact of catchment size and catchment location
The impact of catchment size and catchment location has also been studied (see Table 2). The smaller the catchment the higher the FCSBSas smaller catchments usually have a quicker response time. The differences are more prominent in the high-resolution and control run than in the EPS. This indicates that a persistence criterion used in a flood warn-ing will work well for large catchments but may struggle for smaller catchments given the present EPS horizontal resolu-tion. Location of the catchment is paramount as it is corre-lated to the stability of synoptic patterns (not shown).
5 Discussion
5.1 The role of inconsistency in a forecast chain
The consistency of forecasts becomes especially important if this attribute is used and incorporated into a decision mak-ing process. Consistent forecasts may in some cases improve forecasting ability. For example, Bartholmes et al. (2009) demonstrated a reduced false alarm rate in combination with
limited impact on correct forecast rate through the combi-nation of fixed event forecasts. Consistency of results from one forecast to another has become an important element in decision making for EFAS forecasters. Persson and Grazz-ini (2007) argue that many meteorological forecasters are very well adept in handling inconsistent forecasts. Such in-consistency prevents the forecaster from relying on the lat-est NWP forecast. In addition, they argue that a consistent forecast may lull forecasters into a false sense of reliability, which makes it even more difficult to deal with sudden un-expected forecasts. The magnitude of the inconsistency is of particular importance as a gradually changing forecast may contribute to a higher sense of reliability than an abruptly changing one (Lashley et al., 2008).
Inconsistency can be an asset as it can point to certain types of events e.g. for typically convective situations, small scale phenomena and flash flood the forecasts are less con-sistent than for largely synoptic scale driven floods, e.g. 5B weather types. In addition, it alerts forecasters to possible forecast problems and highlights alternative developments (see full details in Persson and Grazzini, 2007). If fore-casts are inconsistent it may be best practise to rely more heavily on the most recent, or a synthesis of the two – but over-interpretation and non-issue of warnings remain pitfalls with inconsistent forecasts. In flood forecasting there is a requirement for a complex decision making framework as forecasters have a necessary adversity to false alarms and un-willingness to change flood warning levels (Demeritt et al., 2007) as well as the decision rules when to issue a forecast (Bartholmes et al., 2009).
deal with inconsistency whereas it may cause a loss of con-fidence in untrained audiences (Lashley et al., 2008). These issues need further exploration in future research.
5.2 Consistency and forecast skill
Although consistency should not be used as a proxy for fore-cast accuracy (Hamill, 2003), the inconsistency of an en-semble of successive forecasts is taken in many cases to be an indication of forecast uncertainty (Hamill, 2003; Hoff-man and Kalnay, 1983; Dalcher et al., 1988; Palmer and Tibaldi, 1988). Nevertheless, there is a clear relationship be-tween forecast consistency and forecast error. Persson and Grazzini (2007) demonstrate that correlation between fore-cast jumpiness and forefore-cast errors (typically 30% according to investigations by Hoffman and Kalnay, 1983; Dalcher et al., 1988; Palmer and Tibaldi, 1988, Roebber, 1990 and oth-ers) is a statistical artefact. They further demonstrate that this correlation increases with a decreasing forecast skill with a peak at 50% for completely skill-less forecasts (see Ap-pendix B in Persson and Grazzini, 2007).
Probabilistic forecasts require that a correct forecast can also occur on the margins of the probability distribution. If one interprets this crudely as the initial conditions of a con-secutive forecast then a fixed event forecast can have “turning points”. Robust forecast verification therefore must be used alongside any analysis of consistency. Such an analysis must be combined with forecast verification in order to understand any forecast system. Without this understanding, when fore-casting fixed events such as floods objective decision mak-ing may be hindered through the erroneous interpretation of consecutive forecasts. The focus on fixed event forecasts pro-vides a forecaster’s approach to system behaviour and adds an important perspective to the commonly used suite of fore-cast verification tools.
6 Conclusions
In this paper the system properties of a hydro-meteorological forecasting system (the European Flood Alert System) in terms of fixed event forecasts has been analysed. Fixed event forecast analysis uses a forecast consistency score (FCS) with respect to a given event and thus compares forecasts with different lead times. A high FCS indicates a more in-consistent forecast and a low FCS indicates a in-consistent fore-cast. The analysis has been based on a 10-year hindfore-cast. It has been found that:
– The annual mean and minimum of the FCS do not change over the last ten years. The annual maximum decreases.
– The FCS has a seasonal pattern which should be in-cluded into any decision making framework.
– The FCS for the EPS decreases over lead time and in-creases for the control and high-resolution forecast.
– The FCS is sensitive to the threshold magnitude and flow regime.
– There is clear impact of catchment size and location on forecast consistency with a lower consistency in smaller catchments and at locations with more unstable synoptic weather patterns.
It is important to stress that an inconsistent fixed event fore-cast can be a completely natural occurrence and is not nec-essarily a negative feature of a forecasting system. The vari-ability of the FCS indicates that EFAS decision rules on when to issue flood forecasts have to include a seasonal depen-dency.
Future studies should investigate other formulations for evaluating consistency as well as measures in a combined accuracy-consistency assessment. More combinations of forecast lead times should be studied as well.
Acknowledgements. Florian Pappenberger has been supported by the SAFER, EFAS and PREVIEW project which are gratefully acknowledged. Hannah Cloke, Fredrik Wetterhall and Yi He are supported by NERC Flood Risk from Extreme Events (FREE) grant number NE/E002242/1.
Edited by: A. Weerts
Reviewed by: M. Zappa, L. Zhao and two other anonymous referees
References
Bakhshi, H., Kapetanios, G., and Yates, T.: Rational expectations and fixed event forecasts: An application to UK inflation, Empir. Econ., 30(3), 539–553, 2005.
Bartholmes, J. C., Thielen, J., Ramos, M. H., and Gentilini, S.: The european flood alert system EFAS – Part 2: Statistical skill as-sessment of probabilistic and deterministic operational forecasts, Hydrol. Earth Syst. Sci., 13, 141–153, doi:10.5194/hess-13-141-2009, 2009.
Clements, M. P.: Evaluating the rationality of fixed-event forecasts, J. Forecasting, 16, 225–239, 1997.
Clements, M. P. and Taylor, N.: Robustness of fixed-event forecast rationality, J. Forecasting, 20 (4), 285–295, 2001.
Cloke, H. L. and Pappenberger, F.: Evaluating forecasts of extreme events for hydrological applications: an approach for screening unfamiliar performance measures, Meteorol. Appl., 15(1), 181– 197, 2008.
Cloke, H. L. and Pappenberger, F.: Ensemble Flood Forecasting: a review J. Hydrol., 375, 613–626, 2009.
Dalcher, A., Kalnay, E., and Hoffman, R. N.,: Medium range lagged average forecasts, Mon. Weather Rev., 116, 402–416, 1988. Demeritt, D., Cloke, H., Pappenberger, F., Thielen, J., Bartholmes,
EM-DAT: The OFDA/CRED International Disaster Database, www.emdat.be, Universit´e catholique de Louvain, Brussels, Bel-gium, 2010.
Hamill, T. M.: Evaluating forecasters’ rules of thumb: a study of D(Prog)/Dt, Weather Forecast., 18, 933–937, 2003.
Hoffman, R. N. and Kalnay, E.: Lagged average forecasting, an alternative to monte-carlo forecasting, Tellus, 35A, 100–118, 1983.
Holden, K., Peel, D. A., and Thompson, J. L.: Expectations: theory and evidence, London, Macmillan, 1985.
Kay, M. P.: The design and evaluation of a measure of forecast consistency for the Collaborative Convective Forecast Product. Preprints, 11th Conference on Aviation, Range and Aerospace Meteorology, 4–8 October, Hyannis, MA, Amer. Met. Soc., available at: http://www.esrl.noaa.gov/gsd/ab/fvs/publications/ articles/kay consistency ARAM2004.pdf, 2004.
Lashley, S. L., Fisher, L., Simpson, B. J. , Taylor, J., Weisser, S., Logsdon, J. A., Lammers, A. M.: Observing verification trends and applying a methodology to probabilistic precipita-tion forecasts at a Naprecipita-tional Weather Service Forecast Office. Preprints, 19th Conf. on Probability and Statistics, New Orleans, LA, Amer. Meteor. Soc., 9.4., available at: http://ams.confex. com/ams/pdfpapers/134204.pdf, 2008.
Mills, T. C. and Pepper, G. T.: Assessing the forecasters: an anal-ysis of the forecast records of the treasury, the London Business School and the National Institue, Int. J. Forecasting, 15, 247– 257, 1999.
Nordhaus, W. D.: forecast efficiency: concepts and applications, Rev. Econ. Stat., 69, 667–674, 1987.
Palmer, T. N. and Tibaldi, S.: On the prediction of forecast skill, Mon. Weather Rev., 116, 2453–2480, 1988.
Pappenberger, F., Thielen, J., Del Medico, M.: The impact of weather forecast improvements on large scale hydrol-ogy: analysing a decade of forecasts of the european flood alert system, Hydrol. Process., in press, available at: http://onlinelibrary.wiley.com/doi/10.1002/hyp.7772/abstract, 2010.
Persson, A. and Grazzini, F.: User Guide to ECMWF forecast products, available at: http://www.ecmwf.int/products/forecasts/ guide/index.html, 2007.
Roebber, P. J.: Variability in successive operational model forecasts of maritime cyclogenesis, Weather Forecast., 5, 586–595, 1990. Ruth, D. P., Glahn, B., Dagostaro, V., and Gilbert, K.: The
Per-formance of MOS in the Digital Age, Weather Forecast., 24 (2), 504-519.2009,
Thielen, J., Bartholmes, J., Ramos, M.-H., and de Roo, A.: The Eu-ropean Flood Alert System – Part 1: Concept and development, Hydrol. Earth Syst. Sci., 13, 125–140, doi:10.5194/hess-13-125-2009, 2009.
Thielen, J., Bogner, K., Pappenberger F., Kalas, M., del Medico, M., and de Roo, A.: Monthly-,medium- and short range flood warn-ing: testing the limits of predictability, Meteorol. Appl., 16(1), 77–90, 2009b.