www.atmos-chem-phys.net/11/4303/2011/ doi:10.5194/acp-11-4303-2011
© Author(s) 2011. CC Attribution 3.0 License.
Chemistry
and Physics
Cold and transition season cloud condensation nuclei measurements
in western Colorado
D. S. Ward1and W. R. Cotton2
1Earth and Atmospheric Science, Cornell University, Ithaca, New York, USA 2Atmospheric Science, Colorado State University, Fort Collins, Colorado, USA
Received: 1 November 2010 – Published in Atmos. Chem. Phys. Discuss.: 12 November 2010 Revised: 7 April 2011 – Accepted: 21 April 2011 – Published: 10 May 2011
Abstract. Recent studies have shown that orographic pre-cipitation and the water resources that depend on it in the Colorado Rocky Mountains are sensitive to the variability of the region’s aerosols, whether emitted locally or from dis-tant sources. However, observations of cloud droplet nucle-ating aerosols in western Colorado, climatologically upwind of the Colorado Rocky Mountains, have been limited to a few studies at a single, northern site. To address this knowl-edge gap, atmospheric aerosols were sampled at a ground site in southwestern Colorado and in low-level north to south transects of the Colorado Western Slope as part of the Inhibi-tion of Snowfall by PolluInhibi-tion Aerosols (ISPA-III) field cam-paign. Total particle and cloud condensation nuclei (CCN) number concentrations were measured for a 24-day period in Mesa Verde National Park, in September and October 2009. Regression analysis showed a positive relationship between mid-troposphere atmospheric pressure to the west of the site and the total particle count at the ground site, but no simi-lar statistically significant relationship was found for the ob-served CCN. These data were supplemented with particle and CCN number concentration, as well as particle size dis-tribution measurements collected aboard the King Air plat-form during December 2009. A CCN closure attempt was performed and suggested that the sampled aerosol may have had a low hygroscopicity that changed little with the large-scale wind direction. Together, the sampled aerosols from these field programs were characteristic of a rural continen-tal environment with CCN number concentrations that varied slowly in time, and little in space along the Western Slope.
Correspondence to:D. S. Ward ([email protected])
1 Introduction
Variations in the concentration of cloud condensation nuclei (CCN) in the atmosphere have been shown to impact the mi-crostructure of clouds (Andreae and Rosenfeld, 2008), lead-ing to changes in cloud radiative properties (e.g. Twomey, 1977; Kaufman et al., 2002) and precipitation efficiency (e.g. Warner, 1968; Givati and Rosenfeld, 2004; Saleeby et al., 2009). In general, an increase in CCN number concen-tration results in a higher cloud droplet number concenconcen-tration (CDNC) and smaller droplets compared to a cloud with sim-ilar liquid water content (LWC) but relatively fewer CCN, potentially causing numerous microphysical and dynamical feedbacks (Ramanathan et al., 2001). Since a majority of atmospheric particles originate from or are influenced by an-thropogenic activities (Andreae, 2007) the CCN population is an essential element in our understanding of the human impacts on clouds, which modulate regional and global cli-mate (Charlson et al., 2001; Ghan and Schwartz, 2007). De-spite numerous studies on this topic, there is considerable uncertainty regarding the effect of anthropogenic aerosols on global precipitation. Global climate model simulations in general predict that increasing aerosols has suppressed precipitation globally (Levin and Cotton, 2009). However, Zhang et al. (2007) reported that precipitation increased in the Northern Hemisphere mid-latitudes during the latter half of the 20th century, suggesting that the role of anthropogenic aerosols is poorly understood. In fact, the magnitude and even the sign of the feedbacks of aerosols on clouds and precipitation depend on the cloud regime being affected and in many cases are not well known (Stevens and Feingold, 2009), making studies of CCN variability important on local and regional scales.
supercooled cloud droplets reduces the riming efficiency which may lead to a decrease in the liquid water content of precipitation falling as snow or a change in the spatial distri-bution of the precipitation (Borys et al., 2003; Saleeby et al., 2009). Investigations of precipitation climatology in moun-tainous regions in the western US have demonstrated a long-term decrease in accumulated precipitation downwind and upslope of urban areas (Givati and Rosenfeld, 2004; Rosen-feld and Givati, 2006). Jirak and Cotton (2006) found similar results along the Colorado Front Range, attributing the lower precipitation to increases in pollution from the urban corri-dor. Case studies of mixed-phase orographic clouds have also shown a connection between lower precipitation pro-duction and local anthropogenic aerosol sources (Borys et al., 2000, 2003), and recent modeling studies of these clouds by Lynn et al. (2007) and Saleeby et al. (2009) have demon-strated sensitivity in the precipitation fields to changes in CCN number concentration (Nccn).
Issues of orographic precipitation modification are of par-ticular significance in western Colorado where water sup-plies depend largely on the snow produced by orographic clouds (Saleeby et al., 2009). The sharp rise in elevation from west to east along Colorado’s Western Slope leads to frequent formation of precipitating orographic clouds. This, in combination with the location of an aerosol and cloud mi-crophysics observing station in the northern Colorado Park Range, makes the Western Slope region an ideal laboratory for studying aerosol-orographic cloud interactions. In fact, a substantial portion of the data on this topic has been collected in northwestern Colorado and southeastern Wyoming.
While the observational evidence supports a potentially important aerosol impact on orographic clouds in western Colorado (Borys et al., 2003), the scope of the impact re-mains largely unknown. For example, it has been hypoth-esized that precipitation from high LWC mixed-phase oro-graphic clouds may be more sensitive to increases in aerosol because of the greater potential for riming compared to low LWC clouds that contain more ice (Borys et al., 2000). High LWC clouds are more common in southwest Colorado than in northwest Colorado and, thus, may be more susceptible to decreases in riming efficiency due to increases inNccn. How-ever, observational records of droplet-nucleating aerosol do not exist for the majority of the Western Slope. A few stud-ies have measured CCN at the northern end of this region and in southern Wyoming (e.g. Saleeby and Cotton, 2009; Politovich and Vali, 1983; Delene and Deshler, 2001) but to our knowledge no measurements ofNccnhave ever been pub-lished for the central Colorado Western Slope leaving a gap in our understanding of aerosol/cloud interactions in a region that is potentially sensitive toNccnvariations.
In this study, atmospheric aerosols were sampled in south-western Colorado and along the length of the Western Slope. The cloud active portion, that is the fraction of the aerosol population that will nucleate a cloud droplet for given con-ditions, was measured at fixed supersaturations. Data were
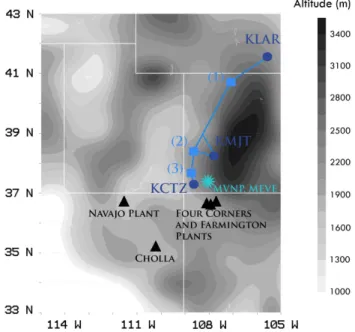
Fig. 1. Detail map of the western United States centered on the Colorado Western Slope. Topography is contoured. The location of the Mesa Verde field site is indicated with a teal star. King Air flight tracks are shown in light blue and the vertical stack locations are given by squares. The vertical stack locations are(1)Steamboat Springs,(2)Nucla, and(3)Cortez. Several local coal-fired power stations are marked with black triangles.
collected as part of the 2009–2010 Inhibition of Snowfall by Pollution Aerosols (ISPA)–III field campaign in western Colorado. The goals of this paper are to (1) establishNccn datasets for fall and winter in this region, (2) identify the lo-cation of possible sources of the observed CCN, (3) report on the bulk hygroscopicity of Western Slope aerosols and (4) point out the limitations of the applied methods to guide future research.
2 Mesa Verde observations
Mesa Verde National Park (MVNP) was chosen as the south-western Colorado sampling site for this phase of the ISPA-III project. The site is located to the southwest of the higher elevations in the San Juan Mountains at an elevation of 2190 m a.m.s.l. Figure 1 shows the location of the sampling site with reference to the surrounding topography. The local ecosystem consists mainly of juniper and pinyon pine trees and the topsoil contains loess, a fine, red-colored silt. It is a location that endures frequent forest fires especially during the summer, although none burned in the vicinity during this project.
areas to the north of MVNP and to the east in the Mancos River Valley. Despite the rural setting, there are several large point sources of particles and gas-phase particle precursors that are local to the observation site. The most important of these, potentially, is the Four Corners power plant located about 100 km south-southeast of Mesa Verde (Fig. 1). To-gether with two additional power plants positioned between the Four Corners plant and Mesa Verde, these sources are responsible for SO2emissions in excess of 10 tons per day on average and the emission of large amounts of NOx(US EPA, 2009). Decreased visibility was often observed in the direction of these sources, which stand at a lower altitude than the sampling site. Other substantial power plant aerosol sources, the Navajo and Cholla plants, are located to the west and southwest of Mesa Verde but are more distant than Four Corners.
The sampling site is co-located with the Interagency Mon-itoring of Protected Visual Environments (IMPROVE) net-work collection site MEVE (Fig. 1). Atmospheric aerosol samples are collected at IMPROVE sites on four separate fil-ters for 24 h periods once every three days. The mass ratios of collected particulate species are determined by several differ-ent analysis techniques (Hyslop and White, 2008). It is im-portant to note that sulfate and nitrate aerosol are assumed to exist as ammonium sulfate and ammonium nitrate and their mass is not measured as separate from ammonium. Also, these data do not provide information about particle number concentration. Here, IMPROVE data will be used only to gain a general sense of the long-term total aerosol mass con-centration and composition of particles with diameters less than 2.5 µm (PM2.5).
Figure 2 shows the contribution to total PM2.5 by IM-PROVE estimated species at MEVE averaged from 1999– 2008 for the dates of the ISPA-III observations. The IM-PROVE samples are collected for one day out of every three days, but the sampling date is not the same from year to year. To reconcile this, three-day periods were defined that would each contain one sampling day from each year. The aver-ages are for the three-day period centered on the date shown in the figure. For example, the 18 September average repre-sents samples collected on 17, 18, or 19 September. The av-erage aerosol mass concentration for this location was about 3 µg m−3during the September–October time period making MEVE one of the cleaner locations in the network, but typi-cal for a site in the Rocky Mountains (Debell, 2006). Similar sulfate and organic aerosol mass are evident in Fig. 2 with only small contributions from nitrate aerosol and elemental carbon.
2.1 Methods
Two instruments were deployed to sample aerosols at MVNP: a Droplet Measurement Technologies (DMT) CCN-100 instrument and a TSI 3010 condensation particle counter (CPC). These were setup inside a climate controlled
build-Fig. 2.PM2.5composition as measured by the IMPROVE program at the MEVE1 site and averaged over the ten year period, 1999– 2008. EC = elemental carbon; OC = organic carbon.
ing at the Mesa Verde Research Center. An inlet was in-stalled on the building solely as an intake for the CCN-100 and CPC. The main inlet was constructed out of 4′′ diam-eter aluminum tubing with a sheltered opening at a height of 4.15 m above the ground and 3.1 m above the CCN-100 inlet manifold. At the bottom of the main inlet a fan was in-stalled to maintain flow from the top of the tubing. Flow was directed from the main inlet to each instrument by a combi-nation of 0.3 m 3/8′′copper tubing and flexible 12 mm (out-side diameter) tubing (0.4 m for CCN-100, 0.7 m for CPC). The copper tubing is used to navigate the necessary change in flow direction from vertical (main inlet) to horizontal (in-let manifolds on the CCN-100 and CPC). To diminish the loss of particles by impaction on the tubing walls the cop-per tubing was bent only slightly in two locations and the remainder of the required 90◦ turn was accomplished with the flexible tubing. The access opening of the copper tub-ing was tapered. The instrument shed was collocated with a meteorological observation tower that recorded wind speed and direction, temperature, dewpoint temperature, solar radi-ation, and precipitation.
by imposing a tightly controlled temperature gradient on the sheath/sample flow within a moist growth chamber. The SS produced is not constant within the growth chamber but reaches a maximum in the center. The maximum SS value achieved is considered the instrument sampling SS. While the flow rates are kept constant the SS can be set higher or lower by increasing or decreasing the temperature gradient. Particles enter the growth chamber at slightly above the am-bient temperature, flow up the temperature gradient through the supersaturated environment in the center of the chamber and either reach stable equilibrium or grow into cloud droplet size. An optical particle counter (OPC) detects droplets that have reached a threshold size and reports these as CCN. The threshold droplet diameter was set to 2 µm for the ISPA-III measurements. There is a risk at this size that a few of the smallest particles will activate but not have time to reach the threshold at the SS settings that were used (Roberts and Nenes, 2005). The decision to use 2 µm was made to ensure consistency between this dataset and previously col-lected datasets at Storm Peak Lab (SPL) in northwestern Col-orado. The CCN-100 was operated at a 10:1 sheath to sam-ple flow ratio and at two values of SS: 0.3 % and 0.5 %. It was set to alternate between the two SS settings every 15 minutes, running continuously for the entire project period taking one measurement per second. Therefore, CCN-100 measures the subset of atmospheric aerosols that will acti-vate cloud droplets, i.e. the cloud-active subset, at SS that are likely found in potential downwind orographic clouds.Nccn is reported at the ambient pressure and instrument tempera-ture.
The CCN-100 used at Mesa Verde was calibrated on 9/14/09 at the DMT facility in Boulder, Colorado. The SS in the instrument is calibrated by sampling a distribution of particles for which the CCN activity is known, usually am-monium sulfate. The instrument-set SS is then compared to the theoretically determined SS and adjusted for accuracy. Instrument uncertainty regardingNccnmeasurements is con-sidered less than 10 % for the conditions expected during this project, and uncertainty in the SS instrument setting has been reported as less than 1 % (Roberts and Nenes, as cited by Quinn et al., 2008). Rose et al. (2008) estimate the uncer-tainty in the DMT CCN-100 SS, represented as the observed standard deviation from their experiments, as±5 % of the instrument SS setting when used in the field.
The CPC detects total particle number concentration (Ncn) in a similar way. The sample flow passes through a region in the instrument that is saturated with butanol vapor and then down a temperature gradient to cause the vapor to condense onto the particles. The resulting droplets are counted by an OPC and divided by the flow volume to compute a particle number concentration. It was shown by Mertes et al. (1995) that the lower detection limit of the CPC could be decreased to diameter(D)=5 nm particles by increasing the tempera-ture difference between the saturation and condensation re-gions. This detection limit is defined as the diameter at which
50 % of the particles will activate and become detectable. At Mesa Verde, the CPC was run with the recommended tem-perature differential which results in a lower detection limit of approximatelyD=10 nm.
2.2 Mesa Verde results
The high-frequency data (one observation per second for the CCN-100 and CPC, but recorded every 10 s for the CPC) were smoothed using a 30 min running average. Note that a 30 min average of theNccn at a specific SS includes only 15 min of data because of the instrument SS cycling. For this averaging an assumption is made that the CCN-100 is sam-pling similar ambient air during the 30 min when the instru-ment cycles once through each SS. Data that met certain cri-teria were flagged and set as missing. This was done any time the temperature gradient in the CCN-100 was not stabilized, which occurs between every change in instrument SS and sometimes lasts between 1–2 min. Other flagging criteria, including sharp changes in the air pressure and a significant change in the flow rate through either instrument, were not encountered. An attempt was made to eliminate observations that may have been contaminated by exhaust from nearby vehicles. Surges in Ncn that exceeded five standard devia-tions from the mean (computed from the 24 h period in ques-tion, midnight to midnight) and lasted less than two minutes were removed from the dataset. Thirteen such events were identified, all occurring between the hours of 7:55 a.m. and 5:00 p.m. LT and all on weekdays. Corresponding CCN ob-servations were also disregarded, although the surges in that dataset were not as extreme.
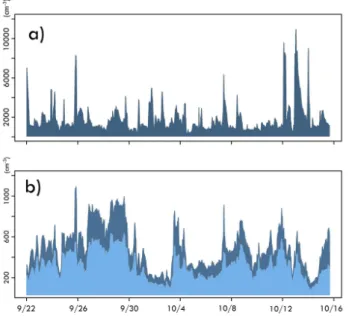
Figure 3b shows the time series ofNccn at both SS val-ues for the entire project. The averageNccnat SS = 0.3 % was 302 cm−3 and at SS = 0.5 % was 481 cm−3 (Table 1). Episodes of comparable values ofNccnthat lasted for one to several days are evident in the time series. TheNcn, shown in Fig. 3a, appears to vary on much shorter timescales. To further this comparison, the lag autocorrelations of each time series are given in Table 1. TheNccn time series exhibits a high autocorrelation, especially relative to that for the Ncn time series. According to VanReken et al. (2003) this is an indication that the largest particle number variations in time occur for particles that are too small to activate droplets at the prescribed SS.
Table 1. Statistical information for physical quantities observed at MVNP. These represent the entire time series from 9/22-10/16. Lag quantities are autocorrelations for lags of 1, 10 and 24 h. The effective sample size,n′, is computed using Eq. (1). Labels are as follows: CCN3 =Nccn(SS = 0.3 %); CCN5 =Nccn(SS = 0.5 %); ACT3 =Nccn(SS = 0.3 %)/Ncn; ACT5 =Nccn(SS = 0.5 %)/Ncn; and C5/C3 =Nccn (SS = 0.5 %)/Nccn(SS = 0.3 %).
Units Mean Min Max StDv Lag 1 Lag 10 Lag 24 n′
Temp ◦C 54 31 82 10.6 0.96 0.06 0.74 11 Dpt ◦C 22 −5 48 10.5 0.96 0.63 0.26 11 RH % 32 9 98 16.9 0.95 0.26 0.46 14 Wind mph 6 1 16 2.8 0.77 0.11 0.27 74 Ncn cm−3 1773 336 10 944 1427 0.94 0.25 0.07 33 CCN3 cm−3 302 72 631 128 0.98 0.78 0.61 10 CCN5 cm−3 481 123 1090 204 0.98 0.75 0.57 10 C5/C3 – 1.6 1.14 2.38 0.17 0.84 0.45 0.22 10 ACT3 – 0.23 0.01 0.72 0.14 0.95 0.58 0.44 32 ACT5 – 0.37 0.02 0.97 0.21 0.95 0.60 0.51 28
Fig. 3. Time series of(a)Ncnand(b)Nccn(Nccnat SS = 0.3 % shown in light blue,Nccnat SS = 05 % shown in dark blue) observed at MVNP during the ISPA field project.
2.3 Aerosol and geopotential height regression analysis Previous research shows that differences in the observed regional meteorology can explain some of the variability in aerosol properties observed on board aircraft or at sur-face sites (e.g. VanReken et al., 2003; Medina et al., 2007; Quinn et al., 2008; Furutani et al., 2008; Bougiatioti et al., 2009). Traditionally these distinctions are made using trajectory analysis and are often limited to labeling obser-vations as marine-source or continental-source, as in Van-Reken et al. (2003), Furutani et al. (2008), and Bougiatioti et al. (2009). Moreover, it is difficult to test whether the re-lationship between the computed trajectories and observed
aerosols would apply generally to future cases. In this sec-tion regression analysis will be used to investigate a more broadly applicable relationship between the large-scale wind and MVNP CCN and CN number concentrations.
The 700 mb and 500 mb geopotential height fields from the North American Regional Reanalysis (NARR) dataset (Mesinger et al., 2006) were used to represent the large-scale wind in this analysis. NARR data are output on a 349 x by 277 y polar-stereographic grid with a horizontal grid spacing of about 32 km in the lower latitudes. The data are avail-able in 3 h increments. Output from 9/23/09 00:00 GMT to 10/16/09 00:00 GMT was used to construct the time series of the geopotential height fields.
The 700 mb and 500 mb geopotential height fields were weighted by the cosine of the latitude. This equalizes the in-fluence of each grid point on the basis of grid-box area. The 24 h time mean was removed from all grid points. Missing data were removed from the dataset before analysis. Next, the time series ofNcnandNccnfrom MVNP were averaged over 3 h time periods, centered on the corresponding NARR output time. The time series were standardized and the 24 h time mean was removed from each. Then, the 500 mb and 700 mb geopotential height time series were regressed onto the time series of Nccn and Ncn. The resulting regression maps were plotted and the correlations at each grid point were computed. The correlations are used to test whether the regression relationship is significant and could be applied to cases outside of the ISPA-III observation period, or if the re-lationship is specific to this case and not representative of the potential population of regression coefficients at each grid point. The latter is the null hypothesis. The correlations were checked for significance against the null hypothesis using a two-tailed student t test. An effective sample size was calcu-lated for the test using equation 5.12 from Wilks (1995):
n′∼=n1−ρ1
1+ρ1
where ρ1 is the lag-1 autocorrelation coefficient, n is the sample size andn′is the effective sample size, or the equiv-alent number of independent samples. The effective sample size corrects for the persistence in the CCN dataset. The high persistence in the CCN datasets, given by the autocorrela-tions in Table 1, reduces the effective sample size to 10. The result is the same whenn′is computed using the lag-1 auto-correlation for the 3 h standardized dataset. TheNcnseries varies on a shorter timescale and, therefore, has a higher ef-fective sample size,n′=33. This is reduced in the regression analysis to one independent sample per day (n′=23), the as-sumed sample size for the NARR datasets. Significance was tested at the 95 % confidence level.
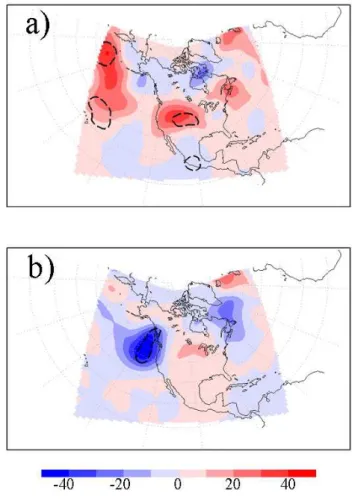
Figure 4a shows the regression of the 500 mb height field onto the Nccn (SS = 0.3 %) time series. This is the pat-tern of 500 mb heights that explains the most variance in the
Nccn(SS = 0.3 %) time series. The pattern includes positive regression coefficients over the central and western United States, as well as over the northern Pacific. High (low) pres-sure in these regions was associated with high (low)Nccnat MVNP during this project. The dashed line indicates areas that would be statistically significant for an effective sample size ofn′=23, or one independent sample per day. None of the regression coefficients were statistically significant at the 95 % confidence level using the computedn′=10. This indicates that the height pattern in Fig. 4a may express the influence of one or more specific events. Therefore it would not be appropriate to extend conclusions drawn from these data to future cases.
The pattern is similar for the regression of 500 mb height ontoNccn (SS = 0.5 %) and for 700 mb height ontoNccnat both values of SS (not shown). However, the regression onto theNcntime series (Fig. 4b) results in a region of negative regression coefficients off the west coast of the United States of which a large portion is statistically significant at a 95 % confidence level. This pattern, with negative regression co-efficients to the west and positive to the east suggest that high pressure off the coast of western United States and a weak trough over the intermountain west is related to low
Ncnat MVNP. The increased likelihood of wet deposition of aerosols from precipitation under low pressure both locally and to the west of MVNP could reduceNcnat MVNP. How-ever, very little precipitation was observed at MVNP (0.65′′) or in the intermountain west during this field study making this explanation difficult to substantiate.
Contributions to the regression pattern in Fig. 4b could al-ternatively have been made by a strong low in the northeast Pacific coupled with a weak ridge of high pressure over the central US that led to increasedNcnat MVNP. High pressure is most often associated with a stable airmass, increased so-lar radiation at the surface and light winds. These airmass characteristics will tend to increase aerosol aging and reduce long-range transport, enhancing the impact of local aerosols sources. The emissions from the sources near MVNP (Fig. 1) could have contributed to the increasedNcn under this
sce-Fig. 4.Regression of 500 mb geopotential height onto the time se-ries of(a)Nccnsampled at MVNP with SS = 0.3 % and(b)Ncn. Units are geopotential meters (gpm) per standard deviation of(a) Nccnand(b)Ncn. Regions where the correlation between(a)Nccn or(b) Ncn and height is significant at the 95 % confidence level assumingn′=23 are outlined with a dashed line.
nario. The relationship between increased Nccn and high pressure in the western US (Fig. 4a) also supports this idea.
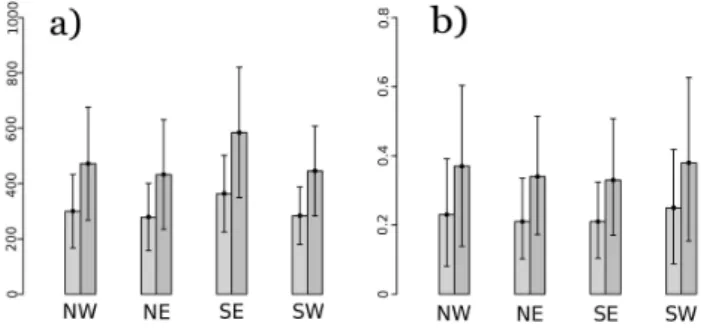
The regression maps in Fig. 4 suggest that 500 mb winds from the east were associated with highNccnat MVNP and weak southerly winds were associated with highNcn. To test whether these signals appear in the surface winds at MVNP,
Fig. 5.Mean(a)Nccn(cm−3)and(b)activated fraction for differ-ent surface wind directions observed at the MVNP site. Light grey indicates data for SS = 0.3 % and dark grey for SS = 0.5 %. The error bars show one standard deviation above and below the mean.
and southeast of MVNP were transported to the site. Freshly emitted particles are likely to be small and may act to de-crease the activated fraction (Medina et al., 2007).
2.4 Discussion
CCN number concentration data were collected with a DMT CCN-100 at a site in MVNP. These were supplemented with
Ncnand meteorological data, all measured continuously for a period of 24 days. The Nccn observations varied within a range of about one order of magnitude and rarely ex-ceeded 1000 cm−3at SS = 0.5 %. The averageNccn at the surface site was 302 cm−3 at SS = 0.3 % and 481 cm−3 at SS = 0.5 %. These values show that the MVNP environ-ment is clean when compared to observations in the north-eastern and southnorth-eastern United States that typically average 2–3 times greater than the MVNP measurements (Medina et al., 2007; Ervens et al., 2007; Hudson, 2007; Quinn et al., 2008). TheNccn observations at MVNP were remarkably episodic, with high or low events lasting for one to several days.
The MVNP measurements are comparable in magnitude toNcn andNccn at SPL collected in January and February of 2007 as reported by Saleeby et al. (2009) and Ward et al. (2010). TheNccnobserved at MVNP is on average some-what higher, although this is not unexpected given the differ-ence in seasons. Also, SPL should be expected to be some-what cleaner because of its high altitude and frequent discon-nection from the surface layer below. The MVNP aerosol may be considered, by geographic proximity to SPL, to also be characteristic of rural continental airmasses, although typ-ically size distribution information would be used to make this distinction. CDNC and CCN at Elk Mountain in south-ern Wyoming during January and April were found to be be-tween 100 to 300 cm−3for SS estimated to be between 0.4 % to 0.65 % using the Twomey (1959) power law equation for CCN concentration spectra (Politovich and Vali, 1983). Elt-groth and Hobbs (1979) measured ambientNcnin excess of 3500 cm−3on three separate days in northern New Mexico.
Although, they sampled air closer to the Four Corners power plant and these observations are more than 30 years old.
At MVNP in 2009, it is unclear whether the large, local aerosol sources impacted the measurements ofNccnandNcn. Observed spikes in Ncn were not always accompanied by similar spikes inNccn. This could be evidence of the influ-ence of a nearby combustion source introducing a large num-ber of small particles into the environment (Medina et al., 2007), or producing enough SO2to bring about an aerosol nucleation event in the area.
3 King Air observations
CCN data have been collected in northwestern Colorado at SPL (Saleeby et al., 2009), and nearby at Elk Mountain (Poli-tovich and Vali, 1983), and now in southwestern Colorado (see Sect. 2). About 350 km separate these sites from north to south, a stretch through which much of the aerosols in the central Rocky Mountains of Colorado will pass on the prevailing westerlies that are common to the region. In De-cember of 2009, sixteen low-altitude transects of this region, also known as the Western Slope, were made during eight flights from Laramie, WY to Cortez and Montrose, CO. Ver-tical profiles were carried out at the northern and southern ends of transects near SPL and Cortez, CO. On-board mea-surements ofNcn, aerosol size distribution, andNccnat three different values of SS were made on all transects.
3.1 The King Air observational platform
The King Air is a twin-propeller turboprop aircraft oper-ated by the University of Wyoming in Laramie, WY, for tropospheric research. On-board instruments measure cloud physics parameters, atmospheric radiation and atmospheric state quantities. For the ISPA flights the main interest was sampling of aerosols and their CCN activity. For this reason a CPC was operated aboard the aircraft as well as a Parti-cle Measuring Systems passive cavity aerosol spectrometer probe (PCASP) for differentiating particle sizes and a static-diffusion, thermal-gradient CCN instrument.
3.1.1 Instruments and calibration
continuous flow diffusion chamber in that a sharp tempera-ture gradient across a small space is used to establish and control the SS. In the CCNC-100A, aerosols are admitted into the chamber, where they are sealed off from the flow and exposed to the supersaturated environment controlled by the temperature gradient. Particles with a critical supersaturation (SSc)less than the instrument SS will grow to droplet size. The detection stage lasts for 20 s during which a steady SS is maintained within the chamber (Snider et al., 2006). The entire process takes 30 to 40 s including the time needed to flush the old sample out of the chamber, admit the new sam-ple, and achieve the steady state SS which can be as much as 15 s depending on how long it takes for the temperature gra-dient within the chamber to stabilize (Delene and Deshler, 2000; Snider et al., 2006).
A laser illuminates the center of the chamber (assumed to be the region of maximum SS) where the light is scattered by cloud droplets forming on activated CCN. The amount of scattering is monitored by a photodetector and can be used to derive the number concentration of large particles (droplets) in the chamber. During the detection stage the scattering in-creases as droplets grow. If the SS of the chamber exceeds the SScof some of the particles, these will activate and begin to fall. The photodetector voltage reaches its peak value at this point. The peak voltage is used to determine theNccn. The relationship between the light scattering, as indicated by the peak photodetector voltage, and the droplet number con-centration is calibrated by testing an aerosol population with a 100 % activated fraction and known number concentration (Snider et al., 2006). The variability in the resulting peak voltage measured for test aerosol populations with the same
Nccnis used to estimate the uncertainty associated with the CCN instrument detector as shown by Snider et al. (2006).
The temperature gradient within the chamber is moni-tored by thermocouples and the nominal SS (SSnom)is com-puted from the reported temperature gradient and chamber-top temperature. Water vapor is supplied to the chamber by wetted pads that are re-moistened every 1–2 h. Snider et al. (2006) report that the activation behavior of particles in the CCNC-100A is characteristic of a SS below the SSnom. They define an effective SS (SSeff)to describe this behav-ior, and explain the method for computing SSeff and the as-sociated uncertainty. Three SSnom settings were used dur-ing ISPA-III and correspond to average values for SSeff of 0.22 %, 0.46 % and 0.96 %. The SSeff:SSnomratio and asso-ciated uncertainty are estimated during a chamber calibra-tion in which the activacalibra-tion behavior of size-selected am-monium sulfate particles is tested (Snider et al., 2010). The true chamber SS can be determined from the activation be-havior of the ammonium sulfate and a K¨ohler theory model (Snider et al., 2006). This is compared to the theoretical SSnomto give SSeff:SSnom. For ISPA-III, the original cham-ber calibration found SSeff:SSnom=0.61. During the project a plate temperature sensor failed and the result of a new cali-bration (SSeff:SSnom=0.7) was retroactively applied to data
collected after the failure (11 December through 19 Decem-ber). Using results from Snider et al. (2006) the chamber calibration uncertainty is estimated to be 10 % of SSeff:SSnom for the current study. It is assumed in the following analysis that the SSeffrepresents the true SS experienced by particles within the chamber and will be referred to simply as SS for the remaining discussion of this instrument and its measure-ments.
The PCASP is an optical particle counter, measuring the forward scattered light from particles passing through a laser beam (Snider and Petters, 2008). The scattering is relative to particle size (assuming particles are spherical and have an index of refraction equal to 1.59) so particles can be sepa-rated into size bins. The PCASP defines 30 bins of particle concentrations but the lower size limit of the first bin is un-certain. Data from the 29 bins with certain bin limits com-prise a range of particle diameters between 0.122 to 3 µm. It is assumed that particles are classified into size bins by their dry diameter. However, hygroscopic particles deliquesce at relative humidity (RH) well below 100 %. To ensure that the PCASP sampling environment is dry enough to rule out wet-ted particles, heaters are installed at the inlet. The sample flow rate is not constant but averages about 1 cm3s−1. The bin number concentration is defined as the count rate divided by the flow rate for each sample.
3.2 ISPA flight plan
Clear-sky aerosols were targeted for measurement during the King Air flights with the additional goal of sampling in different large-scale flow regimes. Eight days during the project period (1 December to 19 December) were consid-ered clear enough to collect a complete cloud free dataset along the Western Slope. Flight days were separated into three flow regimes based on the general direction of the wind at 700 mb and 500 mb in the western United States. Com-posite images of 500 mb heights for each regime are shown in Fig. 6. The westerly regime was characterized by zonal flow from the west coast through Colorado. The remaining flights were conducted on days with a 500 mb ridge to the west of Colorado and a trough to the east. The amplitude of the ridge/trough pattern dictated whether flow through west-ern Colorado was northwesterly or northerly. Distant sources of particles to the southwest, such as the southern California urban areas, were of interest but unfortunately no episodes of southwest flow were observed.
Table 2.Flight dates and information about the flight paths, flow regimes, and data observed for all King Air flights in December 2009. Note that the flight duration is the total time from the southward and northward flights from each day.
Flight Date Launch Duration Flight Stacks Flow time (UTC) (hours) Plan # (AM,PM)
F1 12/3/09 17:05 4.7 2 Steamboat Springs (SB), Nucla (Nc) N
F2 12/5/09 16:06 5.6 1 SB W
F3 12/10/09 16:25 5.3 1 NW
F4 12/11/09 17:27 6.0 1 SB, Cortez (Cz) W
F5 12/15/09 16:01 6.0 1 SB, Cz W
F6 12/17/09 16:07 6.0 1 SB, SB NW
F7 12/18/09 16:47 6.3 1 Cz, SB NW
F8 12/19/09 15:59 5.8 2 SB, Nc N
Fig. 6. Composite of 700 mb geopotential height and temperature for the northerly, northwesterly, and westerly flow regime cases. Temperature (shaded) is in units of K and height (contours) is in geopotential meters.
lowest between 250–500 m a.g.l. and increasing about 500 m on each leg with some variation. Flight plan #2 was used dur-ing northerly wind events. It differed in the location of the southern stack, which was moved north to Nucla to sample flow into the San Juan Mountains better in this regime. Each flight day contained two flights with a stop at a southern Col-orado airport for refueling. These airports were Cortez (CTZ; see Fig. 1) for flight plan #1 and Montrose for flight plan #2 (MJT; see Fig. 1). The north to south transects were simi-lar in both flight plans. These were flown at constant height above mean sea level meaning the distance above ground level varied, but in general this was less than 1000 m a.g.l. The flight leg between Laramie and the northern stack was necessarily run at higher altitudes and was used for instru-ment setup. Data from this leg are not included in the analy-sis.
3.3 Results
The Nccn data collected on these flight paths underwent a check for quality of the photodetector voltage out-put. The percentages of valid measurements for the entire project at each SS setting were 55 % (SS≈0.22 %), 76 % (SS≈0.46 %), and 85 % (SS≈0.96 %). Flagged measure-ments ofNccnwere set to missing. PCASP aerosol size dis-tribution bins and CPC particle number were averaged over 20 s time periods (20 observations), beginning ten seconds
before the CCN instrument chamber opened and ending ten seconds after it was opened. The averaged values were then matched with the derivedNccn.
Figure 7a shows the averageNccnfor all valid data points, except those collected during the vertical profiles, plotted against SS. The mean observed Nccn indicate a somewhat clean atmosphere with the majority of the observations of
Nccn<100 cm−3 at the lowest SS. This plot also illus-trates the expected increase inNccnwith increasing SS that has been represented using the power law relationship from Twomey (1959). The dataset is separated into large-scale flow regimes, as defined in Fig. 6, and the composite plots are shown as different colors (Fig. 7b–d). The meanNccnwas similar for the northerly (Fig. 7b) and northwesterly regimes (Fig. 7c), although the latter showed less variation at each SS. The westerly regime (Fig. 7d) was cleaner in general, with a meanNccn of about 50 cm−3at SS ≈0.22 %. The parti-cle number concentration measured by the PCASP (for bins with known size limits, that is particles overD=0.122 µm) is shown in Fig. 7 to fall between theNccnat the middle and highest SS settings in the CCN instrument. This could indi-cate the presence of a population of particles that are smaller thanD=0.122 µm but will activate at high SS despite their small size.
Fig. 7. Plots ofNccn(y-axis; log scale; cm−3)at the CCN instru-ment SS (x-axis; log scale; %) for(a)all King Air horizontal tran-sects,(b)transects through northerly flow,(c)northwesterly flow, and(d)westerly flow. The meanNccnare marked with filled circles and the error bars represent one standard deviation from the mean. The mean and standard deviation of the PCASP total number con-centration is shown in the shaded region of each plot.
Fig. 8.Nccn(SS≈ 0.22 %) andNcnplotted against latitude for all horizontal transects. The data were binned by latitude and averaged. TheNccnis plotted as the blue, solid line. The dark blue shaded region represents one standard deviation from the mean for each latitude bin and the range in values in each bin is represented with the light blue shaded region. Bin averagedNcnis plotted as the black, dashed line and uses the scale on the right-hand side.
Data collected during the vertical stacks also exhibit a low activated fraction. A distance of 40–60 km was flown at each stack leg to collect several data points at each SS at a constant altitude, and legs were repeated if necessary. The data were averaged over each altitude, disregarding horizontal varia-tions in sampling along the flight leg. For the purpose of plotting these data, any stack leg with less than 3 valid data points was set as missing. The altitude of the stacks some-times varied between profiles, often because clouds were en-countered at target altitudes. The approximate ground levels at the three locations are 2100 m.s.l. for Steamboat Springs, 1840 m.s.l. for Cortez and 1850 m.s.l. for Nucla.
Fig. 9.Vertical profiles ofNccncollected during the(a)F1,(b)F4,
(c)F5,(d)F6,(e)F7,(f)F8 flights. The plotted values areNccn at SS = 0.46 % for the northern stacks (solid line) and the southern stacksSupersaturation (SS) is maintained (dashed line).
The vertical profiles are given in Fig. 9 for all stacks. They are set in order by date and time flown and show Nccn at SS≈0.46 % for both the northern and southern stack loca-tions. In general, the King Air flew through higher number concentrations of particles and CCN in the lowest level of the stack compared to the highest level. This difference was most pronounced on the F7 and F8 flights for both northern and southern stacks (Fig. 9e and f). Still, the averageNccn measured at SS≈0.46 % never exceeded 300 cm−3even at the lowest altitudes. Activated fraction did not vary consid-erably with height for the majority of profiles.
On the F1 and F5 flights (Fig. 9a and c), Nccn and Ncn did not decrease constantly with altitude. Instead, a relative clean layer was observed on these days with slightly higher
NccnandNcnin the altitudes above the clean layer. During the F1 stacks the clean layer was evident in both the northern and southern profiles and at similar altitudes. For F5, the clean layer was more pronounced in the southern stack and difficult to discern in the northern stack.
Very similar trends inNccnandNcnwith height were ob-served between the northern and southern stacks for F1, F6, F7 and F8 (Fig. 9a, d, e, f). In general, the magnitudes of
in comparison to southwestern Colorado. It now appears that, especially under north and northwesterly winds, the northern measurements could be used to estimateNccnin the southern locations. In contrast, the vertical profiles for the westerly flow flights F4 and F5 do not appear to be as con-sistent from north to south. Differences in aerosol sources to the west of the Colorado mountains may lead to these incon-sistencies with westerly winds.
3.4 CCN prediction 3.4.1 CCN closure review
CCN closure is regarded as one of the most effective tech-niques for evaluating the characteristics of aerosols that af-fect their potential to act as CCN and assessing our abil-ity to predict this activabil-ity. A CCN closure study, as ex-plained by VanReken et al. (2003), is an attempt to match observed CCN number concentrations with those predicted using one of several methods, usually involving knowledge of the aerosol size distribution, composition, or both. Squires and Twomey (1961) and Twomey and Warner (1967) pub-lished two of the earliest studies along these lines, although their goal was to show a predictive relationship between CCN and CDNC observed in the low-levels of nearby clouds. More recent closure studies use K¨ohler theory to model
Nccn at a fixed SS. Covert et al. (1998) describe one of the first attempts at CCN closure using this method. They measuredNccnwith a static diffusion, thermal gradient in-strument at a coastal site in southern Australia. Simultane-ous observations of aerosol size distribution and hygroscopic growth were made. For each sample the critical dry size for droplet activation was computed from the K¨ohler equations using the hygroscopic growth information and temperature and SS set in the CCN instrument. The number of observed particles larger than the critical size is counted and regarded as the prediction ofNccnused to test for closure. Covert et al. (1998) found thatNccnwas, on average, overpredicted by about 20 %. Subsequent studies have achieved a wide range of results with respect to CCN closure. Chuang et al. (2000) systematically, and substantially, underpredicted CCN in ma-rine aerosol samples. The majority of their error probably resulted from instrument bias but they also note the impor-tance of the treatment of aerosol composition in CCN pre-diction. This was also pointed out in earlier work by Liu et al. (1996) who combined aerosol composition measure-ments with CCN predictions and found that some chemical constituents were correlated withNccn.
A CCN closure study in south Florida reported by Van-Reken et al. (2003) found excellent agreement between mea-sured and predictedNccn assuming all particles were com-posed of pure ammonium sulfate. While they speculated that the simplified representation of aerosol composition might apply in other environments, this was not the case for rural continental aerosol sampled by Medina et al. (2007). They
observed CCN and size-dependent aerosol composition at a site in southern New Hampshire for 7 days in August. By in-cluding a size-dependent insoluble fraction parameter, based on the observations, in their CCN model, they realized sub-stantial improvement in CCN predictions relative to CCN measurements. Chang et al. (2007) reached similar conclu-sions in a 14-day dataset of size-dependent aerosol composi-tion in CCN measurements in a semi-rural environment.
Recent attempts have focused on measuring aerosol com-position as the key to achieving CCN closure (Ervens et al., 2007; Quinn et al., 2008; Furutani et al., 2008; Bougiati-oti et al., 2009). Broekhuizen et al. (2006) and Cubison et al. (2008) both show evidence that CCN closure can be im-proved with knowledge of size-dependent composition. Cu-bison et al. (2008) also found that assumptions about the aerosol mixing state (internal or external) can adversely im-pact CCN predictions. They sampled aerosol near Los An-geles, California in an urban airmass. For this case, assum-ing an external mixture of aerosol increased the accuracy of the CCN predictions. The assumption of externally mixed aerosol was also used by Stroud et al. (2007) to improve CCN closure at a polluted site in North Carolina. The work of Stroud et al. (2007) aptly reflects the current state of CCN closure studies by pointing out that inadequate understanding of aerosol composition effects on hygroscopicity and instru-ment inaccuracies are the main barriers to achieving CCN closure.
3.4.2 CCN closure attempt
As in the studies outlined above, to predict Nccn for the King Air horizontal transects, information about the aerosol size distribution and composition are applied to a model of K¨ohler theory. Petters and Kreidenweis (2007) show how the representation of the hygroscopic growth of a particle solution in K¨ohler theory can be simplified using a single, empirically-derived parameter, κ. This is given in Eq. (6) from Petters and Kreidenweis (2007):
S(D)= D 3−D3
d
D3−D3
d(1−κ)
exp
4σs/aMw
RT ρwD
(2) Here the saturation ratio,S, is shown as a function of the so-lution diameter, whereDis the diameter of the droplet solu-tion,Ddis the dry particle diameter,σs/athe surface tension
of the solution/air interface,Mwthe molecular weight of wa-ter,Ris the universal gas constant,T is the temperature and
theory is used to predictNccn from the King Air measure-ments. A constant value ofT =298.15K is used for these calculations. This is considerably warmer than the average CCN instrument chamber temperature but is consistent with the standard values forσs/a given in Petters and
Kreiden-weis (2007). Snider et al. (2010) show that the particle SSc can be sensitive to the temperature-dependence ofσs/a and
recommend using the standard values (as done here) where the temperature-dependence is not accounted for.
Size distribution data forNccnprediction are given by the PCASP but since composition measurements were not taken in flight, a reasonable estimate for the averageκ must be used instead. This estimate is, unfortunately, constrained by the detection limits of the PCASP. The PCASP lower limit for measurements between known bin size bounds was given as 0.122 µm earlier in this section. However, even at SS = 0.22 % a particle with theκ of ammonium sulfate will have a critical dry diameter of 0.077 µm using theT and other constants given in Petters and Kreidenweis (2007). There-fore, if the value ofκfor ammonium sulfate was used to pre-dictNccn, an unmeasured portion of the aerosol size distribu-tion would exist above the critical size. These particles would go uncounted and Nccn could be underpredicted consider-ably. Only less hygroscopic particles would possess a critical dry diameter larger than 0.122 µm. To ensure that the com-puted critical size will fall within the detection range of the PCASP at SS = 0.22 % a value ofκ≤0.15 must be assumed. A value ofκ = 0.1 is used for this study. This is equivalent to assuming the sampled aerosols have a low hygroscopic-ity, more characteristic of organic aerosol species than inor-ganics, such as sulfates or nitrates. The assumption of low hygroscopicity is, therefore, inconsistent with observations from the IMPROVE network site at Mount Zirkel (MOZI) in the Colorado Park Range which show a large inorganic component. The composition of the PM2.5aerosol sampled at MOZI in December from 1999–2008 averaged more than 50 % sulfate and nitrate by mass. This is corroborated by the analysis of Borys et al. (2000) who found substantial sulfate and nitrate mass in cloud water samples collected at SPL dur-ing the winter. Richardson et al. (2007) used an aerosol mass spectrometer and other methods to measure aerosol compo-sition at SPL during April and May of 2004. They also found high proportions of inorganic compounds that dominated the total aerosol mass except during dust events. In light of these observations, it should be noted that the hygroscopicity value used in this analysis is likely a low estimate.
Using the estimatedκ = 0.1, a critical diameter is com-puted using the form of the K¨ohler equations given as Eq. (2). This is done separately for each data point since the SS varies between measurements. Particles in size bins greater than the critical size, as counted by the PCASP, are summed. The sum is regarded as the predictedNccn. Note, due to the lim-itations of the PCASP size range, only CCN measurements at SS≈ 0.22 % were used in this analysis. A more robust method for predictingNccnfrom aerosol size distribution
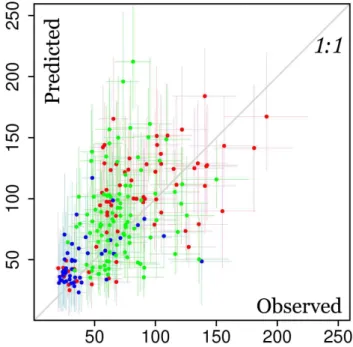
in-Fig. 10.Observed vs. predictedNccn(cm−3)for all horizontal tran-sects during westerly flow (blue), northwesterly flow (green), and northerly flow (red). Error bars are defined in the text. The 1:1 relation line is plotted.
formation was introduced by Petters et al. (2007) but this method requires size-selection of particles during sampling.
Figure 10 shows the predicted Nccn plotted against the measured Nccn for all horizontal transects. Error bars de-pict the estimated uncertainty for the CCNC-100A measure-ments and the PCASP counts (which were used to derive the predictedNccn). For the CCNC-100A, the uncertainty is esti-mated from the detector calibration using the fitting method shown in Snider et al. (2006). The predicted Nccn uncer-tainty is plotted as plus and minus the standard deviation of the 20 PCASP measurements (taken 10 s before and after the CCN instrument chamber was opened) of the number con-centration of particles with diameters larger than the com-puted critical diameter. The error bars extend from values ofNccnpredicted for SS = SS±0.1×SS to account for the uncertainty in the chamber SS (Sect. 3.1.1).
to variations in aerosol composition. However, parcel model results suggest that at the low SS used here some sensitiv-ity could be expected (Ward et al., 2010). A final explana-tion is suggested by Shantz et al. (2008). They note that the light scattering within the CCN instrument is proportional to droplet number, but also droplet size. The pure ammonium sulfate particles used in the detector calibration are likely to be more hygroscopic than internally mixed ambient aerosols and, therefore, will grow at a higher rate and possibly scatter more light within the instrument chamber. This could re-sult in a low number bias when the CCN instrument samples ambient, presumably less hygroscopic particles. Additional detector calibrations using particles with a different hygro-scopicity than ammonium sulfate would be needed to explore this possible explanation. Figure 10 also shows substantial spread of the data points but in general,Nccnwas predicted within a factor of three when compared to the measurements. The CCN closure plot is separated into flow regime by colors in Fig. 10. The noted differences in magnitude of
Nccn between regimes are apparent. Low values of Nccn, mainly between 30 and 50 cm−3, were observed under west-erly flow and these were consistently underpredicted. Ob-servations under northwesterly flow show the largest average deviation from the plotted 1:1 relation line. This could indi-cate a change in aerosol mixing state or average composition sampled during these flights.
4 Summary and conclusions
In combination with observations from MVNP and SPL, the foundation for fall and winter season CCN climatologies now exists for the Western Slope. TheNccn and activated frac-tions are consistent with remote continental, aged aerosol. These characteristics were true from SPL, south to MVNP, and somewhat consistent in time as well as space. This result suggests that variability of CCN in this region may be less important than originally thought. This has implications for studies of aerosol effects on orographic clouds in this region. CCN transported to the San Juan Mountains and other loca-tions along the Western Slope can be estimated by the avail-able measurements from northwestern Colorado, at least for particular wind regimes and seasons. This may also be en-couraging from a modeling perspective. The lack of variabil-ity associated with CCN along the Western Slope could jus-tify simplified representations of aerosols in numerical sim-ulations, provided the simplifications are based on averaged observed quantities.
Several conclusions about the nature of CCN flowing into the Colorado Rocky Mountains from the Western Slope can be drawn from these results. The CCN observed at SPL, MVNP, and on a line between the two sites, was character-istic of rural continental aerosol as defined by Seinfeld and Pandis (2006). For rural continental aerosols, the particle number distribution is dominated by a nuclei (Aitken) mode,
particle surface area is largest in the accumulation mode, and particle mass is dictated by a small number of coarse mode particles.
According to Seinfeld and Pandis (2006), the nuclei mode receives its largest contributions of particles from local an-thropogenic sources. This is difficult to reconcile with the December observations of CCN along the Western Slope that suggest local sources make only minor contributions to the regional CCN field. One explanation is that number fluctua-tions in the nuclei mode do not impact CCN at the instrument SS due to their small size. The CCN in this region would then be dependent on the aged, accumulation mode particles that are more likely to have distant origins. The observa-tions from MVNP, whereNcn was highly variable butNccn changed slowly and within a much smaller range, support this view. Additionally, the low activated fraction computed from the measurements suggests that a large number of the ambient particles are too small to activate droplets at the set values of SS.
Many questions remain unanswered, especially concern-ing the sources of the CCN, and potential differences with season that are not captured here. Future studies should in-corporate aerosol composition measurements, as suggested by Medina et al. (2007) or include size-separated CCN sam-pling as an estimate of aerosol hygroscopicity as in Petters et al. (2007). With these additional measurements the conclu-sions of this work could be better substantiated.
Acknowledgements. The authors would like to thank George San Miguel of the National Park Service and Ian McCubbin of the Desert Research Institute (DRI), as well as Larry Oolman and the rest of the King Air facility staff for essential logistical support. We would also like to acknowledge Doug Lowenthal of DRI for assistance with the Mesa Verde dataset. We are grateful for the comments and suggestions from Jeff Snider and an anonymous reviewer that improved this manuscript. This work was funded by the National Science Foundation grant ATM-0835421.
Edited by: M. Gysel
References
Andreae, M. O.: Aerosols before pollution, Science, 315, doi:10.1126/science.1136529, 2007.
Andreae, M. O. and Rosenfeld, D.: Aerosol–cloud– precipitation interactions, Part 1, The nature and sources of cloud-active aerosols, Earth-Sci. Rev., 89, doi:10.1016/j.earscirev.2008.03.001, 2008.
Bougiatioti, A., Fountoukis, C., Kalivitis, N., Pandis, S. N., Nenes, A., and Mihalopoulos, N.: Cloud condensation nuclei measure-ments in the marine boundary layer of the Eastern Mediter-ranean: CCN closure and droplet growth kinetics, Atmos. Chem. Phys., 9, 7053–7066, doi:10.5194/acp-9-7053-2009, 2009. Broekhuizen, K., Chang, R.Y.-W., Leaitch, W. R., Li, S.-M., and
Abbatt, J. P. D.: Closure between measured and modeled cloud condensation nuclei (CCN) using size-resolved aerosol composi-tions in downtown Toronto, Atmos. Chem. Phys., 6, 2513–2524, doi:10.5194/acp-6-2513-2006, 2006.
Chang, R. Y.-W., Liu, P. S. K., Leaith, W. R., and Abbatt, J. P. D.: Comparison between measured and predicted CCN concentra-tions at Egbert, Ontario: Focus on the organic aerosol fraction at a semi-rural site, Atmos. Environ., 41, 8172–8182, 2007. Charlson, R. J., Seinfeld, J. H., Nenes, A., Kulmala, M., Laaksonen,
A., and Facchini, M. C.: Reshaping the theory of cloud forma-tion, Science, 292, 2025–2026, 2001.
Chuang, P. Y., Collins, D. R., Pawlowska, H., Snider, J. R., Jonsson, H. H., Brenguier, J. L., Flagan, R. C., and Seinfeld, J. H.: CCN measurements during ACE-2 and their relationship to cloud mi-crophysical properties, Tellus, 52B, 843–867, 2000.
Covert, D. S., Gras, J. L., Wiedensohler, A., and Stratmann, F.: Comparison of directly measured CCN with CCN modeled from the number-size distribution in the marine boundary layer during ACE 1 at Cape Grim, Tasmania, J. Geophys. Res.-Atmos., 103, 16597–16608, 1998.
Cubison, M. J., Ervens, B., Feingold, G., Docherty, K. S., Ulbrich, I. M., Shields, L., Prather, K., Hering, S., and Jimenez, J. L.: The influence of chemical composition and mixing state of Los Angeles urban aerosol on CCN number and cloud properties, At-mos. Chem. Phys., 8, 5649–5667, doi:10.5194/acp-8-5649-2008, 2008.
DeBell, L. J., Gebhart, K. A., Hand, J. L., Malm, W. C., Pitchford, M. L., Schichtel, B. A., and White, W. H.: Spatial and seasonal patterns and temporal variability of haze and its constituents in the United States: Report IV, Colorado State University, Fort Collins, CO, 2006.
Delene, D. J. and Deshler, T.: Calibration of a photometric cloud condensation nucleus counter designed for deployment on a bal-loon package, J. Atmos. Oceanic Technol., 17, 459–467, 2000. Delene, D. J. and Deshler, T.: Vertical profiles of cloud
condensa-tion nuclei above Wyoming, J. Geophys. Res.-Atmos., 106(D12), 12579–12588, 2001.
Eidhammer, T., DeMott, P. J., and Kreidenweis, S. M.: A com-parison of heterogeneous ice nucleation parameterizations us-ing a parcel model framework, J. Geophys. Res.-Atmos., 114, D06202, 19 pp., doi:10.1029/2008JD011095, 2009.
Eltgroth, M. W. and Hobbs, P. V.: Evolution of particles in the plumes of coal-fired power-plants 2. Numerical-model and com-parisons with field measurements, Atmos. Environ., 13, 953– 975, 1979.
Ervens, B., Cubison, M., Andrews, E., Feingold, G., Ogren, J. A., Jimenez, J. L., DeCarlo, P., and Nenes, A.: Prediction of cloud condensation nucleus number concentration using measurements of aerosol size distributions and composition and light scatter-ing enhancement due to humidity, J. Geophys. Res.-Atmos., 112, D10S32, 15 pp., doi:10.1029/2006JD007426, 2007.
Furutani, H., Dall’osto, M., Roberts, G. C., and Prather, K. A.: Assessment of the relative importance of atmospheric aging on
CCN activity derived from field observations, Atmos. Environ., 42, 3130–3142, 2008.
Ghan, S. J. and Schwartz, S. E.: Aerosol properties and processes, B. Am. Meteorol. Soc., 88, 1059–1083, 2007.
Givati, A. and Rosenfeld, D.: Quantifying precipitation suppression due to air pollution, J. Appl. Meteorol., 44, 1298–1315, 2004. Gunthe, S. S., King, S. M., Rose, D., Chen, Q., Roldin, P., Farmer,
D. K., Jimenez, J. L., Artaxo, P., Andreae, M. O., Martin, S. T., and P¨oschl, U.: Cloud condensation nuclei in pristine tropi-cal rainforest air of Amazonia: size-resolved measurements and modeling of atmospheric aerosol composition and CCN activity, Atmos. Chem. Phys., 9, 7551–7575, doi:10.5194/acp-9-7551-2009, 2009.
Hobbs, P. V., Stitch, J. L., and Radke, L. F.: Cloud-active nuclei from coal-fired electric power plants and their interactions with clouds, J. Appl. Meteorol., 19, 439–451, 1980.
Hudson, J. G.: Variability of the relationship between particle size and cloud-nucleating ability, Geophys. Res. Lett., 34, L08801, 5 pp., doi:10.1029/2006GL028850, 2007.
Hyslop, N. P. and White, W. H.: An evaluation of interagency mon-itoring of protected visual environments (IMPROVE) collocated precision and uncertainty estimates, Atmos. Environ., 42, 2691– 2705, 2008.
Jirak, I. L. and Cotton,W. R.: Effect of air pollution on precipitation along the front range of the Rocky Mountains, J. Appl. Meteorol. Clim., 45, 236–246, 2006.
Kaufman, Y. J., Tanre, D., and Boucher, O.: A satellite view of aerosols in the climate system, Review, Nature, 419, 215–223, 2002.
Koehler, K. A., Kreidenweis, S. M., DeMott, P. J., Petters, M. D., Prenni, A. J., and Carrico, C. M.: Hygroscopicity and cloud droplet activation of mineral dust aerosol, Geophys. Res. Lett., 36, L08805, 5 pp., doi:10.1029/2009GL037348, 2009.
Levin, Z. and Cotton, W. R.: Aerosol Pollution Impact on Precipi-tation, Springer, 386 pp., 2009.
Liu, P. S. K., Leaitch, W. R., Banic, C. M., Li, S.-M., Ngo, D., and Megaw, W. J.: Aerosol observations at Chebogue Point dur-ing the 1993 North Atlantic Regional Experiment: Relationships among cloud condensation nuclei, size distribution, and chem-istry, J. Geophys. Res.-Atmos., 101(D22), 28971–28990, 1996. Lynn, B., Khain, A. P., Rosenfeld, D., and Woodley, W.: Effects
of aerosols on precipitation from orographic clouds, J. Geophys. Res.-Atmos., 112, D10225, 13 pp., doi:10.1029/2006JD007537, 2007.
Medina, J., Nenes, A., Sotiopoulou, R.-E. P., Cottrell, L. D., Ziemba, L. D., Beckman, P. J., and Griffin, R. J.: Cloud conden-sation nuclei closure during the International Consortium for At-mospheric Research on Transport and transformation 2004 cam-paign: Effects of size-resolved composition, J. Geophys. Res.-Atmos., 112, D10S31, 10 pp., 2007.
Mertes, S., Schroder, F., and Wiedensohler, A.: The particle de-tection efficiency curve of the TSI-3010 CPC as a function of the temperature differential between saturator and condenser, Aerosol Sci. Technol., 23(2), 257–261, 1995.
Petters, M. D. and Kreidenweis, S. M.: A single parameter repre-sentation of hygroscopic growth and cloud condensation nucleus activity, Atmos. Chem. Phys., 7, 1961–1971, doi:10.5194/acp-7-1961-2007, 2007.
Petters, M. D., Prenni, A. J., Kreidenweis, S. M., and DeMott, P. J.: On measuring the critical diameter of cloud condensation nuclei using mobility selected aerosol, Aerosol Sci. Technol., 41(10), 907–913, 2007.
Politovich, M. K. and Vali, G.: Observations of liquid water in orographic clouds over Elk Mountain, J. Atmos. Sci., 40, 1300– 1313, 1983.
Quinn, P. K., Bates, T. S., Coffman, D. J., and Covert, D. S.: Influence of particle size and chemistry on the cloud nucleat-ing properties of aerosols, Atmos. Chem. Phys., 8, 1029–1042, doi:10.5194/acp-8-1029-2008, 2008.
Ramanathan, V., Crutzen, P., Kiehl, J., and Rosenfeld, D.: Aerosols, climate and the hydrological cycle, Science, 294, 2119–2124, 2001.
Reutter, P., Su, H., Trentmann, J., Simmel, M., Rose, D., Gun-the, S. S., Wernli, H., Andreae, M. O., and Pschl, U.: Aerosol-and updraft-limited regimes of cloud droplet formation: influ-ence of particle number, size and hygroscopicity on the activa-tion of cloud condensaactiva-tion nuclei (CCN), Atmos. Chem. Phys., 9, 7067–7080, doi:10.5194/acp-9-7067-2009, 2009.
Richardson, M. S., DeMott, P. J., Kreidenweis, S. M., Cziczo, D. J., Dunlea, E. J., Jimenez, J. L., Thomson, D. S., Ashbaugh, L. L., Borys, R. D., Westphal, D. L., Casuccio, G. S., and Ler-sch, T. L.: Measurements of heterogeneous ice nuclei in the western United States in springtime and their relation to aerosol characteristics, J. Geophys. Res.-Atmos., 112, D02209, 16 pp., doi:10.1029/2006JD007500, 2007.
Roberts, G. C. and Nenes, A.: A continuous-flow streamwise thermal-gradient CCN chamber for atmospheric measurements, Aerosol Sci. Technol., 39(3), 206–221, 2005.
Rose, D., Gunthe, S. S., Mikhailov, E., Frank, G. P., Dusek, U., Andreae, M. O., and P¨oschl, U.: Calibration and measurement uncertainties of a continuous-flow cloud condensation nuclei counter (DMT-CCNC): CCN activation of ammonium sulfate and sodium chloride aerosol particles in theory and experiment, Atmos. Chem. Phys., 8, 1153–1179, doi:10.5194/acp-8-1153-2008, 2008.
Rosenfeld, D. and Givati, A.: Evidence of orographic precipita-tion suppression by air polluprecipita-tion-induced aerosols in the western United States, J. Appl. Meteorol. Clim., 45, 893–911, 2006. Saleeby, S. M., Cotton, W. R., Lowenthal, D., Borys, R. D.,
and Wetzel, M. A.: Influence of cloud condensation nuclei on orographic snowfall, J. Appl. Meteorol. Clim., 48, 903–922, doi:10.1175/2008JAMC1989.1, 2009.
Seinfeld, J. H. and Pandis, S. N.: Atmospheric Chemistry and Physics, Wiley & Sons, Hoboken, New Jersey, 1203 pp., 2006. Shantz, N. C., Leaitch, W. R., Phinney, L., Mozurkewich, M.,
and Toom-Sauntry, D.: The effect of organic compounds on the growth rate of cloud droplets in marine and forest settings, At-mos. Chem. Phys., 8, 5869–5887, doi:10.5194/acp-8-5869-2008, 2008.
Snider, J. R. and Petters, M. D.: Optical particle counter mea-surement of marine aerosol hygroscopic growth, Atmos. Chem. Phys., 8, 1949–1962, doi:10.5194/acp-8-1949-2008, 2008.
Snider, J. R., Guibert, S., Brenguier, J.-L., and Putaud, J.-P.: Aerosol activation in marine stratocumulus clouds: 2. Kohler and parcel theory closure studies, J. Geophys. Res.-Atmos., 108(D15), 23 pp., doi:10.1029/2002JD002692, 2003.
Snider, J. R., Petters, M. D., Wechsler, P., and Liu, P. S. K.: Super-saturation in the Wyoming CCN instrument, J. Atmos. Oceanic. Technol., 23, 1323–1339, 2006.
Snider, J. R., Wex, H., Rose, D., Kristensson, A., Stratmann, F., Hennig, T., Henning, S., Kiselev, A., Bilde, M., Burkhart, M., Dusek, U., Frank, G. P., Kiendler-Scharr, A., Mentel, T. F., Petters, M. D., and P¨oschl, U.: Intercomparison of cloud condensation nuclei and hygroscopic fraction measurements: Coated soot particles investigated during the LACIS Experiment in November (LExNo), J. Geophys. Res.-Atmos., 115, D11205, doi:10.1029/2009JD012618, 2010.
Squires, P. and Twomey, S.: The relation between cloud drop num-bers and the spectrum of cloud nuclei, Physics of Precipitation, Monograph, No. 5, Amer. Geophys. Union., Washington, DC, 211–219, 1961.
Stevens, B. and Feingold, G.: Untangling aerosol effects on clouds and precipitation in a buffered system, Nature, 461, 607–613, doi:10.1038/nature08281, 2009.
Stroud, C. A., Nenes, A., Jimenez, J. L., DeCarlo, P. F., Huffman, J. A., Bruintjes, R., Nemitz, E., Delia, A. E., Toohey, D. W., Guenther, A. B., and Nandi, S.: Cloud activating properties of aerosol observed during CELTIC. J. Atmos. Sci., 64, 441–460, 2007.
Twomey, S.: The nuclei of natural cloud formation, Part II: The su-persaturation in natural clouds and the variation of cloud droplet concentration, Geofis. Pura. Appl., 43, 243–249, 1959.
Twomey, S.: The influence of pollution on the shortwave albedo of clouds, J. Atmos. Sci., 34, 1149–1152, 1977.
Twomey, S. and Warner, J.: Comparison of measurements of cloud droplets and cloud nuclei, J. Atmos. Sci., 24, 702–703, 1967. U.S. Environmental Protection Agency: 2005 National Emissions
Inventory Data & Documentation, http://www.epa.gov/ttnchie1/ net/2005inventory.html, 2009.
VanReken, T. M., Rissman, T. A., Roberts, G. C., Varutbangkul, V., Jonsson, H. H., Flagan, R. C., and Seinfeld, J. H.: To-ward aerosol/cloud condensation nuclei (CCN) closure dur-ing CRYSTAL-FACE, J. Geophys. Res.-Atmos., 108, 18 pp., doi:10.1029/2003JD003582, 2003.
Ward, D. S., Eidhammer, T., Cotton, W. R., and Kreidenweis, S. M.: The role of the particle size distribution in assessing aerosol com-position effects on simulated droplet activation, Atmos. Chem. Phys., 10, 5435–5447, doi:10.5194/acp-10-5435-2010, 2010. Warner, J.: A reduction of rain associated with smoke from
sugar-cane fires – An inadvertent weather modification, J. Appl. Me-teor., 7, 247–251, 1968.
Wilks, D. S.: Statistical methods in the atmospheric sciences, 2 Edition International Geophysics Series, 59, Academic Press, 464 pp., 1995.