TCD
9, 1857–1885, 2015Meteorological, elevation, and slope
effects on surface hoar formation
S. Horton et al.
Title Page
Abstract Introduction
Conclusions References
Tables Figures
◭ ◮
◭ ◮
Back Close
Full Screen / Esc
Printer-friendly Version Interactive Discussion
Discussion
P
a
per
|
Discussion
P
a
per
|
Discussion
P
a
per
|
Discussion
P
a
per
|
The Cryosphere Discuss., 9, 1857–1885, 2015 www.the-cryosphere-discuss.net/9/1857/2015/ doi:10.5194/tcd-9-1857-2015
© Author(s) 2015. CC Attribution 3.0 License.
This discussion paper is/has been under review for the journal The Cryosphere (TC). Please refer to the corresponding final paper in TC if available.
Meteorological, elevation, and slope
e
ff
ects on surface hoar formation
S. Horton1, M. Schirmer1,*, and B. Jamieson1
1
Department of Civil Engineering, University of Calgary, Alberta, Canada *
currently at: Centre for Hydrology, University of Saskatchewan, Saskatchewan, Canada
Received: 30 January 2015 – Accepted: 9 March 2015 – Published: 23 March 2015
Correspondence to: S. Horton ([email protected])
TCD
9, 1857–1885, 2015Meteorological, elevation, and slope
effects on surface hoar formation
S. Horton et al.
Title Page
Abstract Introduction
Conclusions References
Tables Figures
◭ ◮
◭ ◮
Back Close
Full Screen / Esc
Printer-friendly Version Interactive Discussion
Discussion
P
a
per
|
Discussion
P
a
per
|
Discussion
P
a
per
|
Discussion
P
a
per
|
Abstract
Failure in layers of buried surface hoar crystals (frost) can cause hazardous snow slab avalanches. Surface hoar crystals form on the snow surface and are sensitive to micro-meteorological conditions. In this study, the role of micro-meteorological and terrain factors were investigated for three surface hoar layers in the Columbia Mountains of Canada. 5
The distribution of crystals was observed over different elevations and aspects during
20 days of field observations. The same layers were modelled on a 2.5 km horizontal grid by forcing the snow cover model SNOWPACK with forecast weather data from a numerical weather prediction model. The moisture content of the air (i.e. absolute hu-midity) had the largest impact on modelled surface hoar growth, with warm and moist 10
air being favourable. Surface hoar was most developed at certain elevation bands, usu-ally corresponding to elevations with warm humid air, light winds, and cold surface tem-peratures. SNOWPACK simulations on virtual slopes systematically predicted smaller surface hoar on south-facing slopes. In the field, a complex combination of surface hoar and sun crusts were observed, suggesting the model did not adequately resolve the 15
surface energy balance on slopes. Overall, a coupled weather–snow cover model could benefit avalanche forecasters by predicting surface hoar layers on a regional scale over
different elevation bands.
1 Introduction
Surface hoar (frost) is a type of ice crystal that forms on the snow surface (Fierz 20
et al., 2009). Failure in layers of buried surface hoar crystals can release hazardous snow slab avalanches. The formation of surface hoar crystals is sensitive to
micro-meteorological conditions, which makes their distribution in complex terrain difficult to
predict.
Surface hoar forms when water vapour sublimates onto the snow surface. The dom-25
TCD
9, 1857–1885, 2015Meteorological, elevation, and slope
effects on surface hoar formation
S. Horton et al.
Title Page
Abstract Introduction
Conclusions References
Tables Figures
◭ ◮
◭ ◮
Back Close
Full Screen / Esc
Printer-friendly Version Interactive Discussion
Discussion
P
a
per
|
Discussion
P
a
per
|
Discussion
P
a
per
|
Discussion
P
a
per
|
(Foehn, 2001; Hachikubo and Akitaya, 1997; Horton et al., 2014; Stoessel et al., 2010). Snow cover models such as the Swiss snow cover model SNOWPACK (Lehning et al., 2002) and the French model CROCUS (Brun et al., 1992) simulate surface hoar forma-tion by calculating vapour fluxes with meteorological data. Slaughter (2010) performed a sensitivity analysis on modelled vapour fluxes and found incoming longwave radia-5
tion was the most important input, as it regulated surface cooling. In the field, surface hoar often forms in clearings with open sky view and clear skies (Shea and Jamieson, 2010). Light wind speeds also influence vapour fluxes, as Hachikubo (2001) found
the strongest fluxes at speeds between 0.5 and 3.5 m s−1. Faster wind speeds tend
to transport too much sensible heat to the surface, or even knock over the crystals. 10
Accordingly, the distribution of surface hoar often depends on wind exposure (Feick et al., 2007). Solar radiation can also melt or sublimate surface hoar crystals, making their distribution sensitive to slope incline and aspect (Helbig and van Herwijnen, 2012; Shea and Jamieson, 2010).
The meteorological factors that affect surface hoar formation apply over various
spa-15
tial scales (Schweizer and Kronholm, 2007). Layers often form across entire
moun-tain ranges (>100 km) during periods of high pressure (Haegeli and McClung, 2003),
and vary at regional scales (10 km) due to local air masses and clouds. At a basin or drainage scales (1 km), layers vary with slope aspect, incline, and elevation due to variations in wind, radiation, and valley clouds (Feick et al., 2007; Colbeck et al., 2008; 20
Schweizer and Kronholm, 2007). At a slope scale (100 m), layers can vary due to veg-etation, ground roughness, and local winds (Bellaire and Schweizer, 2011). In Canada, public avalanche forecasters communicate the distribution of hazardous surface hoar layers for general elevation and aspect bands on a mountain range scale.
Surface hoar layers could potentially be mapped with spatial weather and terrain 25
TCD
9, 1857–1885, 2015Meteorological, elevation, and slope
effects on surface hoar formation
S. Horton et al.
Title Page
Abstract Introduction
Conclusions References
Tables Figures
◭ ◮
◭ ◮
Back Close
Full Screen / Esc
Printer-friendly Version Interactive Discussion
Discussion
P
a
per
|
Discussion
P
a
per
|
Discussion
P
a
per
|
Discussion
P
a
per
|
exposure), but did not account for meteorological conditions. Meteorological data from a regional scale numerical weather prediction (NWP) model has been used to model surface hoar (Bellaire et al., 2011, 2013; Bellaire and Jamieson, 2013; Horton et al., 2014). Forecast data from a NWP model with 15 km resolution were input into SNOW-PACK, and the resulting surface hoar layers were verified with study plot observations 5
from Mt. Fidelity in Glacier National Park, Canada. While the results were promising, they did not take advantage of the spatially continuous data available from NWP mod-els. Furthermore, Schirmer and Jamieson (2014) suggest high resolution NWP models
(e.g. 2.5 km) offer large improvements over regional models in complex terrain.
The goal of this study was to investigate how meteorological and terrain factors in-10
fluence surface hoar formation. Surface hoar layers were spatially modelled by forcing SNOWPACK with weather data from a high resolution NWP model (2.5 km horizontal resolution). The model results are compared to field observations to explain when and
where surface hoar formed, and whether these effects can be forecast with a coupled
weather–snow cover model. 15
2 Methods
2.1 Field studies
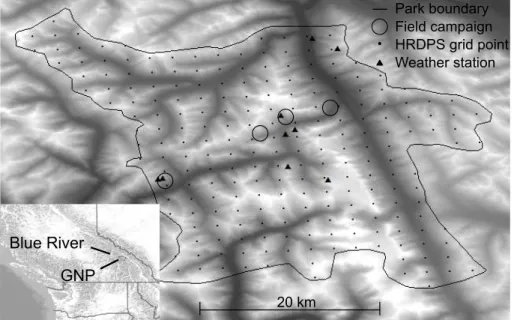
Field studies were done in the Columbia Mountains of British Columbia at Glacier Na-tional Park (GNP) and around the town of Blue River (Fig. 1). The mountains have a transitional snow climate with deep snowpacks and layers of surface hoar and melt-20
freeze crusts (Haegeli and McClung, 2003). Valleys are densely forested up to treeline elevations around 2000 m, with expansive alpine and glaciated regions above treeline, and rocky peaks reaching elevations greater than 3000 m.
The distribution of surface hoar crystals was observed during 20 field campaigns between 15 January and 10 February 2014. Three layers formed over a period of rela-25
TCD
9, 1857–1885, 2015Meteorological, elevation, and slope
effects on surface hoar formation
S. Horton et al.
Title Page
Abstract Introduction
Conclusions References
Tables Figures
◭ ◮
◭ ◮
Back Close
Full Screen / Esc
Printer-friendly Version Interactive Discussion
Discussion
P
a
per
|
Discussion
P
a
per
|
Discussion
P
a
per
|
Discussion
P
a
per
|
which are the dates used to identify each layer. A typical field campaign consisted of travelling by ski from valley bottom to the top of the treeline (between elevations of 1000 and 2300 m). Routes were chosen to cover a range of elevations and slope aspects, and between 5 and 15 sites were chosen for sampling. Sites were deemed to be rep-resentative of the sky view, sun exposure, and wind exposure on surrounding slopes. 5
The sites were either flat fields or large open slopes with inclines between 20 and 30◦.
Test profiles were done at each site to identify layers of surface hoar and melt-freeze crusts in the upper 10 cm of the snowpack. Layer boundaries, grain shape and size, and hand hardness were observed in 255 profiles of the upper snowpack (CAA, 2007).
2.2 Numerical weather forecasts
10
Numerical weather data were collected from 225 grid points in GNP and 168 grid points around Blue River (Fig. 1). The data were produced by the high resolution determinis-tic prediction system (HRDPS) operated by Environment Canada (Erfani et al., 2005). The HRDPS, also known as GEM-LAM, is a numerical weather prediction model with a 2.5 km horizontal grid. The model is initiated four times a day to provide operational 15
forecasts over southwestern Canada. Time series were produced with the data from the 06:00 and 18:00 coordinate universal time initiations, and included air temperature, relative humidity, wind speed, wind direction, incoming shortwave radiation, incoming longwave radiation, and precipitation. The first six hours of forecast values were
ne-glected to minimize errors from model spin-up (Weusthoffet al., 2010). Air temperature
20
and humidity were forecast for 2 m above ground, while wind speed and wind direction were forecast for 10 and 40 m above ground.
Forecasts were compared with temperature, relative humidity, and wind speed mea-surements from automatic weather stations in GNP (Fig. 1). The park operates nine automatic weather stations at relevant elevations for avalanche forecasting along the 25
distri-TCD
9, 1857–1885, 2015Meteorological, elevation, and slope
effects on surface hoar formation
S. Horton et al.
Title Page
Abstract Introduction
Conclusions References
Tables Figures
◭ ◮
◭ ◮
Back Close
Full Screen / Esc
Printer-friendly Version Interactive Discussion
Discussion
P
a
per
|
Discussion
P
a
per
|
Discussion
P
a
per
|
Discussion
P
a
per
|
butions (Table 1), where the location parameter describes the centre of the distribution and the shape parameter describes the spread (Stull, 2014, p. 645). Weibull distribu-tions were also fit to wind speed measurements from eight stadistribu-tions with anemometers roughly 10 m above ground. Two of the stations are located on wind exposed ridgetops, while the other six are relatively sheltered. The 10 m forecasts winds were lighter and 5
did not have as much spread as the station measurements (i.e small location parameter and large shape parameter). The 40 m forecast winds had a similar location parameter
to the sheltered stations (2.0 m s−1
) and a more realistic shape parameter. Accordingly, surface hoar was modelled with 40 m HRDPS winds, as they better represented typical 10 m speeds at sheltered sites.
10
2.3 Surface hoar model
Surface hoar formation was modelled with the Swiss snow cover model SNOWPACK. The model uses weather inputs to reconstruct the structural, thermal, and mechanical properties of the snow cover over the winter season (Lehning et al., 2002). Layers of surface hoar are added by the sublimation of water vapour onto the surface. Sublima-15
tion is driven by the turbulent flux of latent heat, which is modelled with a bulk method. The bulk method assumes down-gradient fluxes proportional to a turbulent transfer
co-efficient. The transfer coefficient is calculated each time step using wind speeds and
assuming neutral atmospheric stability (as verified by Stoessel et al., 2010). Surface hoar can be removed from the surface by negative vapour fluxes, surface melting, or 20
when wind speeds surpass a user defined threshold (3.5 m s−1). Crystal size was
cal-culated from mass by assuming a layer density of 30 kg m−3(Horton et al., 2014).
SNOWPACK simulations were done with weather data from each HRDPS grid point. A flat field simulation was done at each grid point, along with 12 virtual slope simula-tions. Slope simulations in SNOWPACK adjust the incoming shortwave and longwave 25
radiation based on slope geometry (Helbig et al., 2010), while other weather inputs
Simu-TCD
9, 1857–1885, 2015Meteorological, elevation, and slope
effects on surface hoar formation
S. Horton et al.
Title Page
Abstract Introduction
Conclusions References
Tables Figures
◭ ◮
◭ ◮
Back Close
Full Screen / Esc
Printer-friendly Version Interactive Discussion
Discussion
P
a
per
|
Discussion
P
a
per
|
Discussion
P
a
per
|
Discussion
P
a
per
|
lations were done for slopes with 30◦inclines at eight cardinal aspects, as well inclines
of 15 and 45◦on north and south facing slopes.
The sensitivity of SNOWPACK to meteorological inputs was analyzed in terms of modelled surface hoar growth rates. Surface hoar sizes and meteorological inputs were taken from flat field simulations between 15 January and 10 February 2014. The 5
change in crystal size was calculated for each time step (i.e. an hourly growth rate). The simulations were pooled to get 239 152 growth rates with corresponding values of air temperature, relative humidity, wind speed, incoming longwave radiation, and mod-elled snow surface temperature. Absolute humidity, the mass concentration of water
vapour in the air (g m−3), was calculated from the air temperature and relative humidity
10
(Stull, 2014, p. 91). This variable describes the moisture content of the air, and was included because it is important in vapour flux calculations.
3 Results and discussion
3.1 Meteorological effects
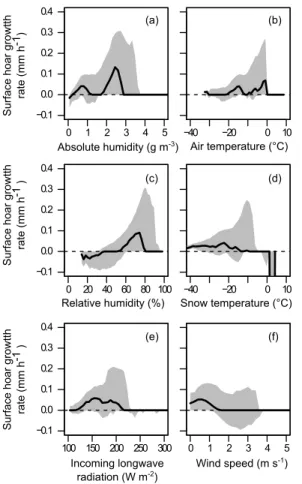
The fastest surface hoar growth rates in SNOWPACK resulted from warm and humid 15
air (Fig. 2a–c). This corresponded to absolute humidity between 2 and 4 g cm−3, air
temperatures between−10 and 0◦C, and relative humidity greater than 60 %. Each of
these variables influenced the moisture content of the air. Modelled surface hoar growth was slow at cold temperatures because cold air holds less moisture. For example, air
colder than−10 ◦C will always have an absolute humidity less than 2 g cm−3, and thus
20
a relatively low moisture supply.
Cold surfaces also promoted surface hoar growth, as the fastest growth occurred
when the modelled surface temperature was between −20 and −10◦C (Fig. 2d).
Growth slowed when the surface was colder than−20◦C, likely because the air would
have been colder and drier. Cloud cover influences surface cooling, where the greatest 25
TCD
9, 1857–1885, 2015Meteorological, elevation, and slope
effects on surface hoar formation
S. Horton et al.
Title Page
Abstract Introduction
Conclusions References
Tables Figures
◭ ◮
◭ ◮
Back Close
Full Screen / Esc
Printer-friendly Version Interactive Discussion
Discussion
P
a
per
|
Discussion
P
a
per
|
Discussion
P
a
per
|
Discussion
P
a
per
|
values of incoming longwave radiation should favour growth, but low values actually reduced growth in this study (Fig. 2e). Slaughter (2010) found modelled vapour fluxes
were predominantly affected by incoming longwave radiation. However, longwave
radi-ation was less prominent in this study because skies were clear throughout most of the study period. In this case, the lowest incoming longwave radiation values corresponded 5
to very cold periods when the air was relatively dry. Incoming radiation and cloud cover
certainly affect surface hoar formation over longer time periods, but during a period of
high pressure, the moisture content of the air appears to have a larger impact.
Modelled surface hoar growth rates generally decreased with wind speed (Fig. 2f).
The fastest growth occurred at speeds below 1.5 m s−1, with moderate growth and
10
shrinkage up to the threshold speed of 3.5 m s−1. Since SNOWPACK calculates both
sensible and latent heat fluxes, this trend supports the idea that strong winds warm the surface warming through sensible heat transport (Hachikubo and Akitaya, 1997).
Surface hoar was destroyed in the model when the wind speed exceeded 3.5 m s−1,
evident by the negative growth rates in Fig. 2f. While the concept of a threshold wind 15
speed agrees with field experience, the interactions between surface hoar and strong winds should be investigated further, ideally under controlled laboratory settings.
The main link between meteorological variables and surface hoar modelled in SNOWPACK is the vapour flux. The largest vapour fluxes resulted from high humidity and warm temperatures, but cold surfaces and light winds were also favourable. Mois-20
ture supply appeared to have the largest effect on modelled surface hoar formation
during a high pressure period, but surface cooling and wind could be more important in
other situations. Furthermore, since winds are difficult to forecast, poor wind forecasts
can still have a large effect on modelled surface hoar.
3.2 Weather forecast evaluation
25
TCD
9, 1857–1885, 2015Meteorological, elevation, and slope
effects on surface hoar formation
S. Horton et al.
Title Page
Abstract Introduction
Conclusions References
Tables Figures
◭ ◮
◭ ◮
Back Close
Full Screen / Esc
Printer-friendly Version Interactive Discussion
Discussion
P
a
per
|
Discussion
P
a
per
|
Discussion
P
a
per
|
Discussion
P
a
per
|
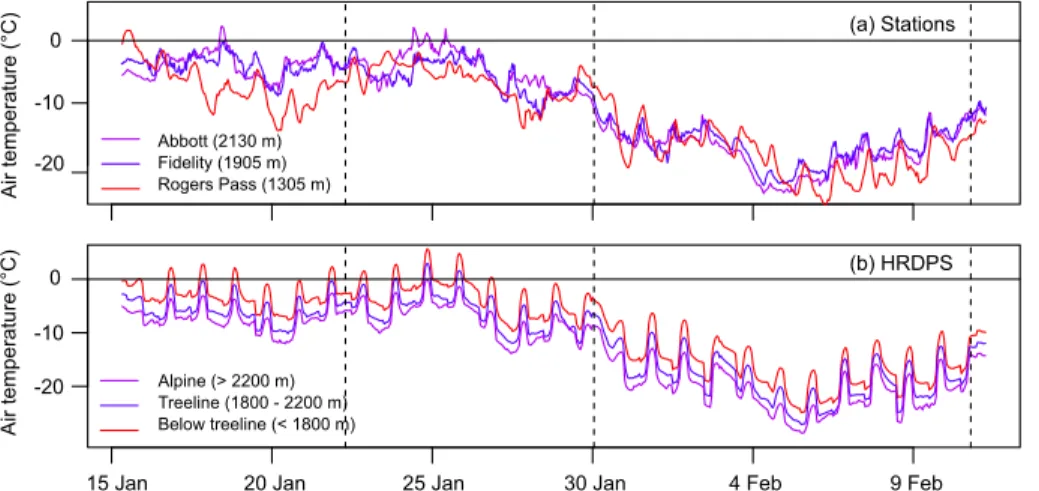
was stable during the study period, with inversions evident between 17 and 22 January and between 6 and 9 February. Lapse rates forecast by the HRDPS were closer to
neutral, with a median value of 6.0◦
C km−1
. Inversion conditions were not forecast,
however, the lapse rates were relatively smaller during these periods (3 to 5◦C km−1).
It appears the HRDPS underestimated cool air pooling in the valleys during this high 5
pressure period. Vionnet et al. (2014) found warm biases in valleys and cold biases in the mountains with HRDPS forecasts. Cold air pooling could slow surface hoar growth in valley bottoms by reducing the moisture content of the air and by causing katabatic winds (Feick et al., 2007).
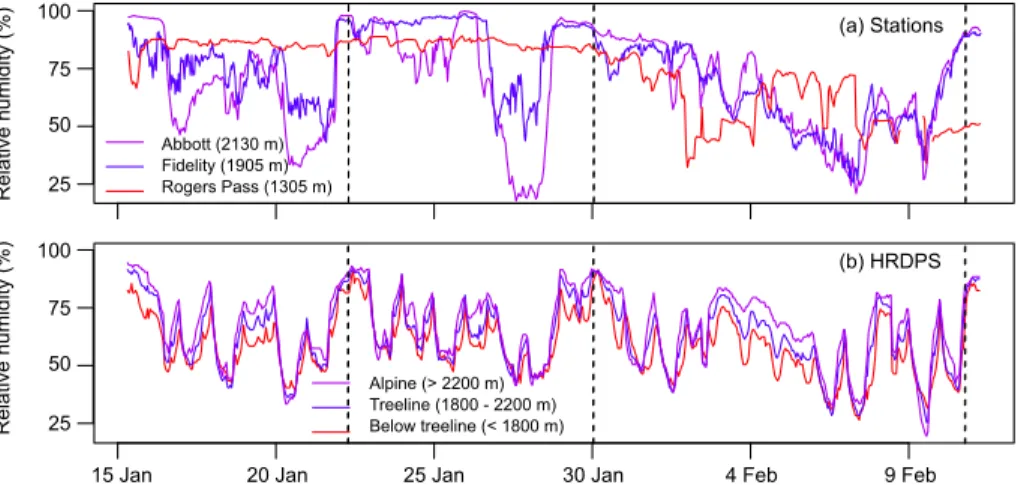
Relative humidity measured in GNP fluctuated between 20 and 80 % during clear 10
weather periods and were higher during precipitation events on 15, 22, and 29 January, and 10 February (Fig. 4). Forecast humidity was generally drier than measured values, but had similar temporal trends. Dry biases have been reported in NWP forecast verifi-cations over western Canada (Bellaire et al., 2011; Mailhot et al., 2012; Vionnet et al., 2014). Valley clouds were observed in GNP between 23 to 25 January and may explain 15
some of the dry biases. Valley clouds likely caused higher humidity at the stations, but forecast humidity remained low, suggesting the HRDPS did not predict valley clouds.
Valley clouds affect surface hoar formation by providing moisture near the top of the
cloud (Colbeck et al., 2008), but this process would be difficult to model without precise
and accurate cloud forecasts, and thus were probably not resolved. 20
Relative humidity measured at the stations generally decreased with elevation, while forecast humidity increased slightly with elevation (Fig. 4). Absolute humidity always de-creased with elevation in the HRPDS because of colder air. Absolute humidity usually decreased at the stations as well, but because of lower relative humidity. So although forecast temperature and humidity lapse rates were not always correct, less moisture 25
was usually predicted at higher elevations.
TCD
9, 1857–1885, 2015Meteorological, elevation, and slope
effects on surface hoar formation
S. Horton et al.
Title Page
Abstract Introduction
Conclusions References
Tables Figures
◭ ◮
◭ ◮
Back Close
Full Screen / Esc
Printer-friendly Version Interactive Discussion
Discussion
P
a
per
|
Discussion
P
a
per
|
Discussion
P
a
per
|
Discussion
P
a
per
|
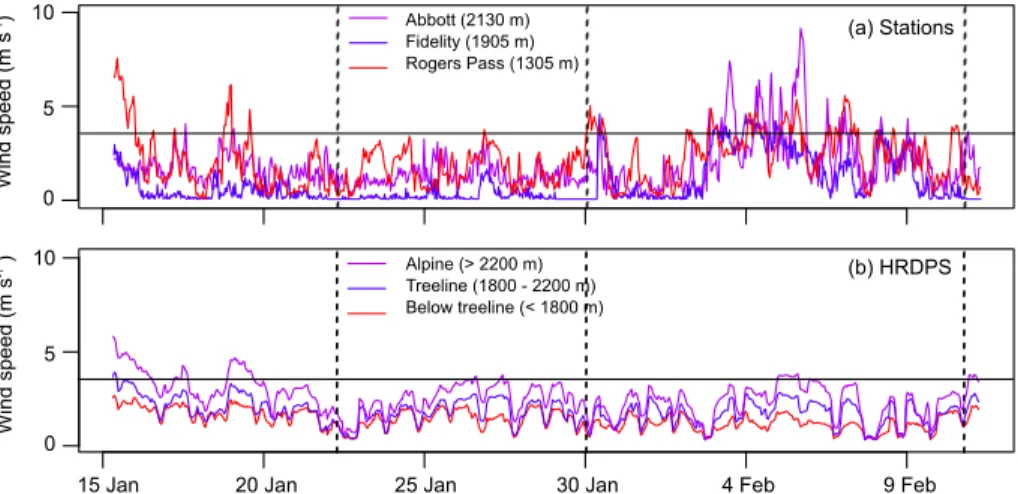
than station measurements. While forecast wind speeds usually increased with eleva-tion, measured winds were more influenced by local topography. For example, the low elevation station at Rogers Pass experiences gap winds and was often windier than
sheltered stations at higher elevations. Such local effects were not expected to be
re-solved with wind forecasts on a 2.5 km horizontal grid (Vionnet et al., 2014). Previous 5
studies required grid resolutions on the order of 10 to 100 m to resolve phenomenon in complex terrain such as thermal winds (Chow et al., 2006) and ridgetop recirculations (Raderschall et al., 2008). Furthermore, even when these phenomena are resolved, they cannot be forecast without precise initial conditions. Feick et al. (2007) commented that the inability to forecast wind at relevant scales is one of the biggest limitations in 10
forecasting surface hoar size. In recognition of this limitation, HRDPS wind speeds should be considered regional rather than local forecasts.
While not shown, high elevation HRDPS grid points also had more precipitation, less incoming longwave radiation, and more incoming shortwave radiation. This resulted in large diurnal radiation fluctuations at high elevation grid points. Radiation measure-15
ments were not verified with station measurements, but agree with common experience (Liston and Elder, 2006).
3.3 Surface hoar distribution
Surface hoar crystals observed between 15 January and 10 February varied with local site characteristics. The 22 and 29 January layers generally had larger crystals than 20
the 10 February layer, but exceptions were common. Surface hoar was modelled on
a regional scale with HRDPS data, making it difficult to verify with individual slope-scale
field observations. Despite these challenges, the distributions were partially explained
TCD
9, 1857–1885, 2015Meteorological, elevation, and slope
effects on surface hoar formation
S. Horton et al.
Title Page
Abstract Introduction
Conclusions References
Tables Figures
◭ ◮
◭ ◮
Back Close
Full Screen / Esc
Printer-friendly Version Interactive Discussion
Discussion
P
a
per
|
Discussion
P
a
per
|
Discussion
P
a
per
|
Discussion
P
a
per
|
3.3.1 Regional effects
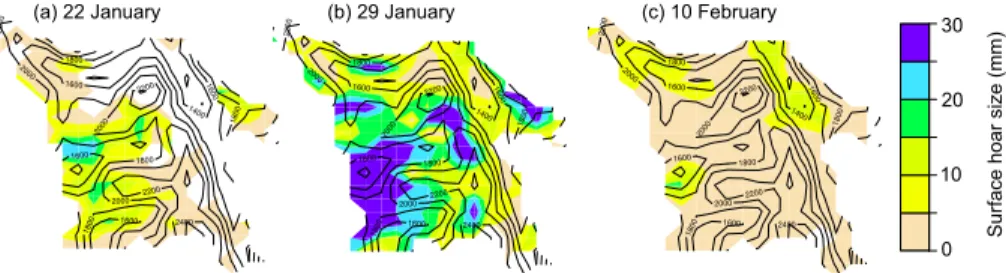
Surface hoar modelled on the HRPDS grid was clustered in sub-regions in GNP (Fig. 6). For example, surface hoar was only modelled in the west end of park on 22 January and was larger in the west end on 29 January. Regional patterns usually corresponded with patterns in the meteorological inputs. In this case, forecast humidity 5
was generally higher in the west due to orographic lift, which caused more surface hoar growth. Similarly, regions with strong winds or above-freezing temperatures had less
surface hoar. While field campaigns were done in different sub-regions, it was difficult
to get a single representative crystal size to compare with the model. In general, the field campaigns found larger surface hoar on Mt. Fidelity in the west end of the park 10
than on Ursus Minor Mountain in the centre of the park.
Given the clustering of weather inputs and modelled surface hoar, the HRDPS prob-ably did not resolve processes at 2.5 km resolution (i.e. basin-scale). Semi-variogram analysis (not shown) found forecast variables were usually autocorrelated up to 20 km
away. This distance may correspond to the effective resolution of the HRDPS, or
per-15
haps the actual scale of weather patterns. Variations within sub-regions appear to be
dominated by local elevation differences. Accordingly, field observations were
com-pared to surface hoar modelled at HRPDS grid points within a 10 km radius (roughly 50 grid points).
3.3.2 Elevation effects
20
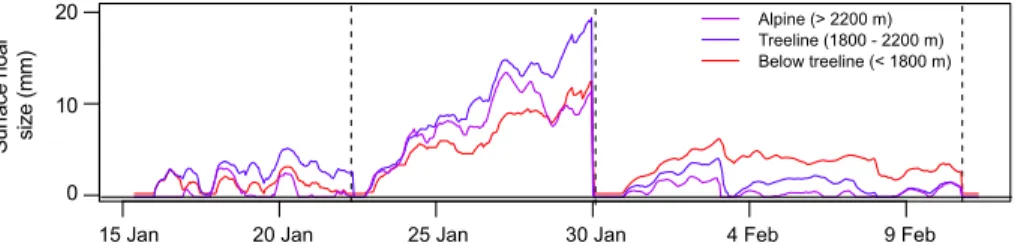
Surface hoar modelled with HRDPS data was often influenced by grid point elevation. The 22 and 29 January layers were largest at treeline elevation grid points (1800 to 2200 m), while the 10 February layer was largest at below treeline grid points (Fig. 7).
The weather forecast over different elevations clearly impacted the model. Warmer
forecast temperatures at low elevations caused surface hoar to melt, evident by the 25
diurnal pattern of growth and melt between 18 and 22 January. Winds at high
ele-vations destroyed surface hoar when wind speeds exceeded 3.5 m s−1
TCD
9, 1857–1885, 2015Meteorological, elevation, and slope
effects on surface hoar formation
S. Horton et al.
Title Page
Abstract Introduction
Conclusions References
Tables Figures
◭ ◮
◭ ◮
Back Close
Full Screen / Esc
Printer-friendly Version Interactive Discussion
Discussion
P
a
per
|
Discussion
P
a
per
|
Discussion
P
a
per
|
Discussion
P
a
per
|
and 27 January. Higher elevation grid points had colder surface temperatures and lower
absolute humidity, which had offsetting effects on surface hoar growth. Favourable
con-ditions existed at treeline elevations for the 22 and 29 January layers (Fig. 7). However, favourable conditions for the 10 February layer were at low elevations, because higher elevations had very cold temperatures and therefore low absolute humidity. Accord-5
ingly, growth was favoured at low elevations, such as the valleys in the northeast corner of the park (Fig. 6c).
Surface hoar was observed over a range of elevations on Mt. St. Anne near Blue River and Ursus Minor Mountain in GNP. Crystal sizes observed on Mt. St. Anne gen-erally decreased with elevation on 21 January (Fig. 8a). Strong winds appeared to limit 10
growth at the high elevation sites, as signs of recent wind transport were evident in the field. Crystal sizes modelled at nearby HRPDS grid points were generally smaller at high elevations as well. The same sites on Mt. St. Anne were visited on 27 January, but this time surface hoar increased in size with elevation (Fig. 8b). No signs of wind transported snow were evident at the high elevation sites. Surface hoar also increased 15
in size with elevation the same day on Ursus Minor Mountain (Fig. 8c). Mild tempera-tures and calm winds likely allowed this layer to form at alpine sites. Sizes modelled at HRDPS grid points near each mountain on 27 January were variable, but generally in-creased with elevation. On 7 February, observed and modelled crystal sizes generally decreased with elevation on Ursus Minor Mountain (Fig. 8d), as high elevation sites 20
experienced cold, dry, and windy conditions.
While the HRDPS modelled general elevation patterns, the sizes were highly vari-able. Furthermore, the field observations were also variable, making quantitative
verifi-cation difficult. Avalanche practitioners often observe surface hoar layers over specific
elevation bands, likely because of changes in temperature, humidity, wind, and clouds. 25
Accurate and precise NWP model forecasts are needed to model these effects. The
TCD
9, 1857–1885, 2015Meteorological, elevation, and slope
effects on surface hoar formation
S. Horton et al.
Title Page
Abstract Introduction
Conclusions References
Tables Figures
◭ ◮
◭ ◮
Back Close
Full Screen / Esc
Printer-friendly Version Interactive Discussion
Discussion
P
a
per
|
Discussion
P
a
per
|
Discussion
P
a
per
|
Discussion
P
a
per
|
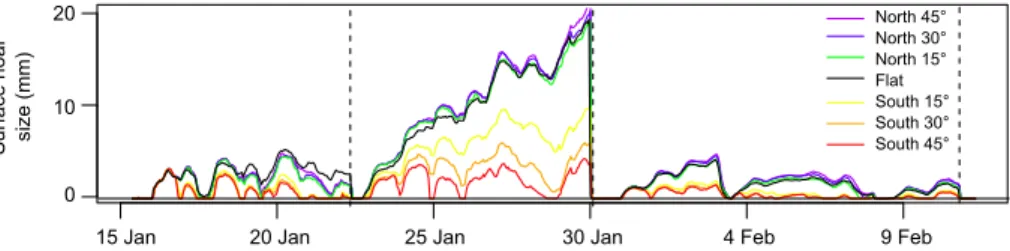
3.3.3 Slope effects
SNOWPACK simulations on virtual slopes systematically predicted less surface hoar on slopes exposed to solar radiation (Fig. 9). North-facing slopes consistently had large surface hoar regardless of slope incline, but south-facing slopes were very sensitive to slope incline. Steep south slopes had a diurnal cycle of surface hoar growth and melt, 5
particularly during warm periods such as 24 to 26 January. As a result, extended
peri-ods of clear weather often resulted in major differences between surface hoar modelled
on north and south slopes, such as the 29 January layer.
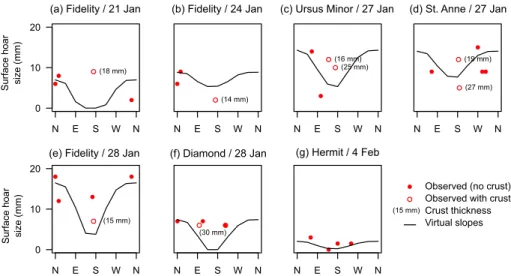
Surface hoar observed in the field did not have such a consistent pattern over diff
er-ent aspects (Fig. 10). South slopes often had comparable or even larger surface hoar 10
than adjacent north slopes. A more prominent impact of solar radiation on south slopes was the formation of sun crusts beneath surface hoar crystals. Surface hoar was not necessarily smaller on south slopes when this occurred. For example, on 21 January the south site on Mt. Fidelity had an 18 mm thick sun crust underneath 9 mm surface hoar crystals, which were larger than crystals observed at any of the adjacent sites 15
(Fig. 10a). In other cases, surface hoar was smaller when overlying crusts, particularly over thick crusts (e.g Fig. 10b–e). Sun crusts were less common with the 10 February
layer (e.g. Fig. 10f), likely because cold temperatures offset radiative warming.
Virtual slope simulations in SNOWPACK tended to exaggerate radiation effects on
surface hoar. Incoming radiation on slopes is adequately modelled in SNOWPACK 20
(Helbig et al., 2010), but the complete surface energy balance may not be. A major simplification in SNOWPACK is that turbulent fluxes on slopes are modelled with the
same turbulent transfer coefficient as a flat field. In reality, turbulent fluxes (including
vapour fluxes) are influenced by slope factors such as local terrain features, drainage winds, and prevailing winds. Since sun crusts were rarely simulated, sub-surface melt-25
ing caused by solar radiation may not have been accurately simulated either. Turbulent
fluxes on slopes likely offset the effects of direct solar radiation, as observed in snow
TCD
9, 1857–1885, 2015Meteorological, elevation, and slope
effects on surface hoar formation
S. Horton et al.
Title Page
Abstract Introduction
Conclusions References
Tables Figures
◭ ◮
◭ ◮
Back Close
Full Screen / Esc
Printer-friendly Version Interactive Discussion
Discussion
P
a
per
|
Discussion
P
a
per
|
Discussion
P
a
per
|
Discussion
P
a
per
|
snow surface energy balance model, there are clearly more complex processes that af-fect surface hoar formation on slopes. A comprehensive model would need to resolve high resolution wind fields, along with improved modelling of turbulent fluxes, radiation
absorption, snow melt, and local sky view effects from terrain shading and vegetation.
4 Conclusions
5
Surface hoar modelled with SNOWPACK was sensitive to the moisture content of the air, where warm and moist air produced the most surface hoar. Snow surface
temper-atures and wind speeds had secondary, but important, effects. Meteorological factors
played an important role on which surface hoar layers were largest, as well as the el-evation bands where they formed. Low elel-evations tended to have favourable humidity 10
and wind speeds, while high elevations had favourable surface temperatures. These
offsetting effects made surface hoar formation favourable at treeline elevations for two
layers, and at below treeline elevations for another layer. Factors affecting surface hoar
formation on slopes were highly variable and thus difficult to model. SNOWPACK
sys-tematically predicted less surface hoar on slopes exposed to solar radiation, however, 15
this was not necessarily observed in the field, as solar radiation tended to form sun crusts under surface hoar rather than reduce surface hoar growth.
The high resolution NWP model appeared to have sufficient quality to forecast
sur-face hoar over different elevation bands on a regional scale. Avalanche forecasters
could benefit from such a model by spatially tracking layers prone to releasing slab 20
avalanches. Finer scale meteorological phenomenon, such as valley clouds and local winds, were not adequately resolved by the weather model. This should improve in the future with better quality and resolution NWP models. Future surface hoar models could be improved by downscaling meteorological data to account for local terrain
fea-tures (e.g., Liston and Elder, 2006), accounting for sky view effects such as vegetation
25
TCD
9, 1857–1885, 2015Meteorological, elevation, and slope
effects on surface hoar formation
S. Horton et al.
Title Page
Abstract Introduction
Conclusions References
Tables Figures
◭ ◮
◭ ◮
Back Close
Full Screen / Esc
Printer-friendly Version Interactive Discussion
Discussion
P
a
per
|
Discussion
P
a
per
|
Discussion
P
a
per
|
Discussion
P
a
per
|
Acknowledgements. We thank the ASARC field team for collecting field data and our host op-erations – Avalanche Control Section of Glacier National Park and Mike Wiegele Helicopter Ski-ing. We are grateful to Miguel Trembley and Catherine Brown for providing data, and Erik Kulyk for preparing the NWP data. We thank Charles Fierz and Mathias Bavay for help with SNOW-PACK. For their financial support we thank TECTERRA, Canadian Pacific Canadian Avalanche 5
Association, Natural Sciences and Engineering Research Council of Canada, HeliCat Canada, Canadian Avalanche Foundation, Parks Canada, Mike Wiegele Helicopter Skiing, Canada West Ski Areas Association, Backcountry Lodges of BC Association, Association of Canadian Moun-tain Guides, Teck Mining Company, Canadian Ski Guide Association, Backcountry Access, and the BC Ministry of Transportation and Infrastructure Avalanche and Weather Programs. We 10
also thank the reviewers of this paper.
References
Bellaire, S. and Jamieson, B.: Forecasting the formation of critical snow layers using a coupled snow cover and weather model, Cold Reg. Sci. Technol., 94, 37–44, 2013. 1860
Bellaire, S. and Schweizer, J.: Measuring spatial variations of weak layer and slab properties 15
with regard to snow slope stability, Cold Reg. Sci. Technol., 65, 234–241, 2011. 1859 Bellaire, S., Jamieson, J. B., and Fierz, C.: Forcing the snow-cover model SNOWPACK with
forecasted weather data, The Cryosphere, 5, 1115–1125, doi:10.5194/tc-5-1115-2011, 2011. 1860, 1865
Bellaire, S., Jamieson, J. B., and Fierz, C.: Corrigendum to “Forcing the snow-cover model 20
SNOWPACK with forecasted weather data” published in The Cryosphere, 5, 1115–1125, 2011, The Cryosphere, 7, 511–513, doi:10.5194/tc-7-511-2013, 2013. 1860
Brun, E., David, P., Sudul, M., and Brunot, G.: A numerical model to simulate snow-cover stratig-raphy for operational avalanche forecasting, J. Glaciol., 38, 13–22, 1992. 1859
Canadian Avalanche Association: Observation Guidelines and Recording Standards for 25
Weather, Snowpack and Avalanches, Canadian Avalanche Association, Revelstoke, Canada, 2007. 1861
Chow, F. K., Weigel, A. P., Street, R. L., Rotach, M. W., and Xue, M.: High-resolution large-eddy simulations of flow in a steep Alpine valley. Part I: Methodology, verification, and sensitivity experiments, J. Appl. Meteorol. Clim., 45, 63–86, 2006. 1866
TCD
9, 1857–1885, 2015Meteorological, elevation, and slope
effects on surface hoar formation
S. Horton et al.
Title Page
Abstract Introduction
Conclusions References
Tables Figures
◭ ◮
◭ ◮
Back Close
Full Screen / Esc
Printer-friendly Version Interactive Discussion
Discussion
P
a
per
|
Discussion
P
a
per
|
Discussion
P
a
per
|
Discussion
P
a
per
|
Colbeck, S.: On the micrometeorology of surface hoar growth on snow in mountainous area, Bound.-Lay. Meteorol., 44, 1–12, 1988.
Colbeck, S., Jamieson, B., and Crowe, S.: An attempt to describe the mechanism of surface hoar growth from valley clouds, Cold Reg. Sci. Technol., 54, 83–88, 2008. 1859, 1865 Erfani, A., Mailhot, J., Gravel, S., Desgagné, M., King, P., Sills, D., McLennan, N., and Jacob, D.: 5
The high resolution limited area version of the global environmental multiscale model and its potential operational applications, Preprints, 11th Conf. on Mesoscale Processes, Albu-querque, NM, Amer. Meteor. Soc., 2005. 1861
Feick, S., Kronholm, K., and Schweizer, J.: Field observations on spatial variability of surface hoar at the basin scale, J. Geophys. Res.-Earth, 112, F02002, doi:10.1029/2006JF000587, 10
2007. 1859, 1865, 1866
Fierz, C., Armstrong, R., Durand, Y., Etchevers, P., Greene, E., McClung, D., Nishimura, K., Satyawali, P., Sokratov, S.: The International Classification of Seasonal Snow on the Ground, IHP-VII Technical Documents in Hydrology No. 83, IACS Contribution No. 1, UNESCO-IHP, Paris, 2009. 1858
15
Foehn, P.: Simulation of surface-hoar layers for snow-cover models, Ann. Glaciol., 32, 19–26, 2001. 1859
Hachikubo, A.: Numerical modelling of sublimation on snow and comparison with field mea-surements, Ann. Glaciol., 32, 27–32, 2001. 1859
Hachikubo, A. and Akitaya, E.: Effect of wind on surface hoar growth on snow, J. Geophys. 20
Res.-Atmos., 102, 4367–4373, 1997. 1859, 1864
Hachikubo, A. and Akitaya, E.: Daytime preservation of surface-hoar crystals, Ann. Glaciol., 26, 22–26, 1998.
Helbig, N. and van Herwijnen, A.: Modeling the spatial distribution of surface hoar in complex topography, Cold Reg. Sci. Technol., 82, 68–74, 2012. 1859
25
Helbig, N., Loewe, H., Mayer, B., and Lehning, M.: Explicit validation of a surface shortwave radiation balance model over snow-covered complex terrain, J. Geophys. Res., 115, D18113, doi:10.1029/2010JD013970, 2010. 1862, 1869, 1870
Horton, S., Bellaire, S., and Jamieson, B.: Modelling the formation of surface hoar layers and tracking post-burial changes for avalanche forecasting, Cold Reg. Sci. Technol., 97, 81–89, 30
TCD
9, 1857–1885, 2015Meteorological, elevation, and slope
effects on surface hoar formation
S. Horton et al.
Title Page
Abstract Introduction
Conclusions References
Tables Figures
◭ ◮
◭ ◮
Back Close
Full Screen / Esc
Printer-friendly Version Interactive Discussion
Discussion
P
a
per
|
Discussion
P
a
per
|
Discussion
P
a
per
|
Discussion
P
a
per
|
Haegeli, P. and McClung, D. M.: Avalanche characteristics of a transitional snow climate – Columbia Mountains, British Columbia, Canada, Cold Reg. Sci. Technol., 37, 255–276, 2003. 1859, 1860
Lehning, M., Bartelt, P., Brown, B., and Fierz, C.: A physical SNOWPACK model for the Swiss avalanche warning: Part III: Meteorological forcing, thin layer formation and evaluation, Cold 5
Reg. Sci. Technol., 35, 169–184, 2002. 1859, 1862
Lehning, M., Voelksch, I., Gustafsson, D., Nguyen, T. A., Staehli, M., and Zappa, M.: ALPINE3D: a detailed model of mountain surface processes and its application to snow hydrology, Hy-drol. Process., 20, 2111–2128, 2006. 1859
Liston, G. E. and Elder, K.: A meteorological distribution system for high-resolution terrestrial 10
modeling (MicroMet), J. Hydrometeorol., 7, 217–234, 2006. 1866, 1870
Lutz, E. R. and Birkeland, K. W.: Spatial patterns of surface hoar properties and incoming radiation on an inclined forest opening, J. Glaciol., 57, 355–366, 2011. 1870
Mailhot, J., Milbrandt, J., Giguère, A., McTaggart-Cowan, R., Erfani, A., Denis, B., Glazer, A., and Vallée, M.: An experimental high-resolution forecast system during the Vancouver 2010 15
Winter Olympic and Paralympic Games, Pure Appl. Geophys., 171, 209–229, 2012. 1865 Mott, R., Egli, L., Grünewald, T., Dawes, N., Manes, C., Bavay, M., and Lehning, M.:
Microm-eteorological processes driving snow ablation in an Alpine catchment, The Cryosphere, 5, 1083–1098, doi:10.5194/tc-5-1083-2011, 2011. 1869
Raderschall, N., Lehning, M., and Schaer, C.: Fine-scale modeling of the boundary layer wind 20
field over steep topography, Water Resour. Res., 44, W09425, doi:10.1029/2007WR006544, 2008. 1866
Schirmer, M. and Jamieson, B.: Verification of forecasted winter precipitation in complex terrain, The Cryosphere Discuss., 8, 5727–5762, doi:10.5194/tcd-8-5727-2014, 2014. 1860
Schweizer, J. and Kronholm, K.: Snow cover spatial variability at multiple scales: characteristics 25
of a layer of buried surface hoar, Cold Reg. Sci. Technol., 47, 207–223, 2007. 1859
Schweizer, J., Jamieson, J. B., and Skjonsberg, D.: Avalanche forecasting for transportation corridor and backcountry in Glacier National Park (BC, Canada), 25 Years of Snow Avalanche Research, Voss, Norway, 12–16 May 1998, 238–243, 1998. 1861
Shea, C. and Jamieson, B.: Spatial distribution of surface hoar crystals in sparse forests, Nat. 30
Hazards Earth Syst. Sci., 10, 1317–1330, doi:10.5194/nhess-10-1317-2010, 2010. 1859 Shea, C. and Jamieson, B.: Sun effect on surface hoar illustrated by three case studies, Cold
TCD
9, 1857–1885, 2015Meteorological, elevation, and slope
effects on surface hoar formation
S. Horton et al.
Title Page
Abstract Introduction
Conclusions References
Tables Figures
◭ ◮
◭ ◮
Back Close
Full Screen / Esc
Printer-friendly Version Interactive Discussion
Discussion
P
a
per
|
Discussion
P
a
per
|
Discussion
P
a
per
|
Discussion
P
a
per
|
Slaughter, A. E.: Numerical analysis of conditions necessary for near-surface snow metamor-phism, Ph.D. thesis, Montana State University, Bozeman, Montana, USA, 2010. 1859, 1864 Stull, R.: Practical Meteorology: an Algebra Based Survey of Atmospheric Science, University
of British Columbia, Vancouver, Canada, 2014. 1862, 1863
Stoessel, F., Guala, M., Fierz, C., Manes, C., and Lehning, M.: Micrometeorological and mor-5
phological observations of surface hoar dynamics on a mountain snow cover,Water Resour. Res., 46, W04511, doi:10.1029/2009WR008198, 2010. 1859, 1862
Vionnet, V., Bélair, S., Girard, C., and Plante, A.: Wintertime sub-kilometer numerical forecasts of near-surface variables in the Canadian Rocky Mountains, Mon. Weather Rev., 143, 666– 686, 2014. 1865, 1866
10
TCD
9, 1857–1885, 2015Meteorological, elevation, and slope
effects on surface hoar formation
S. Horton et al.
Title Page
Abstract Introduction
Conclusions References
Tables Figures
◭ ◮
◭ ◮
Back Close
Full Screen / Esc
Printer-friendly Version Interactive Discussion
Discussion
P
a
per
|
Discussion
P
a
per
|
Discussion
P
a
per
|
Discussion
P
a
per
|
Table 1.Weibull distribution parameters fitted to station and forecast wind speeds (ridgetop
station values in brackets).
Source Location parameter (m s−1) Shape parameter
Stations 0.5, 1.1, 1.7, 2.0, 2.3, 2.6, (4.0), (8.1) 0.9, 1.0, 1.2, 1.2, (1.4), 1.5, 1.8, (1.9)
10 m forecast 0.9 2.6
TCD
9, 1857–1885, 2015Meteorological, elevation, and slope
effects on surface hoar formation
S. Horton et al.
Title Page
Abstract Introduction
Conclusions References
Tables Figures
◭ ◮
◭ ◮
Back Close
Full Screen / Esc
Printer-friendly Version Interactive Discussion
Discussion
P
a
per
|
Discussion
P
a
per
|
Discussion
P
a
per
|
Discussion
P
a
per
|
Park boundary Field campaign HRDPS grid point Weather station
GNP Blue River
20 km
Figure 1. Map of Glacier National Park (GNP) with the locations of field campaigns, High
TCD
9, 1857–1885, 2015Meteorological, elevation, and slope
effects on surface hoar formation
S. Horton et al.
Title Page Abstract Introduction Conclusions References Tables Figures ◭ ◮ ◭ ◮ Back Close
Full Screen / Esc
Printer-friendly Version Interactive Discussion Discussion P a per | Discussion P a per | Discussion P a per | Discussion P a per |
0 1 2 3 4 5 −0.1 0.0 0.1 0.2 0.3 0.4 Sur face h oa r g row tth rat e (m m h -1)
−40 −20 0 10
0 20 40 60 80 100 −0.1 0.0 0.1 0.2 0.3 0.4
−40 −20 0 10
100 150 200 250 300 −0.1 0.0 0.1 0.2 0.3 0.4
0 1 2 3 4 5 Absolute humidity (g m-3) Air temperature (°C)
Relative humidity (%) Snow temperature (°C)
Incoming longwave
radiation (W m-2) Wind speed (m s -1) Sur face h oa r g row tth rat e (m m h
-1 )
Sur face h oa r g row tth rat e (m m h
-1 )
(a) (b)
(c) (d)
(e) (f)
Figure 2.Surface hoar growth rates modelled by SNOWPACK for different values of(a)
abso-lute humidity,(b)air temperature,(c)relative humidity,(d)modelled snow surface temperature,
TCD
9, 1857–1885, 2015Meteorological, elevation, and slope
effects on surface hoar formation
S. Horton et al.
Title Page
Abstract Introduction
Conclusions References
Tables Figures
◭ ◮
◭ ◮
Back Close
Full Screen / Esc
Printer-friendly Version Interactive Discussion
Discussion
P
a
per
|
Discussion
P
a
per
|
Discussion
P
a
per
|
Discussion
P
a
per
|
Air
te
m
pe
rat
ur
e
(°
C)
Abbott (2130 m) Fidelity (1905 m) Rogers Pass (1305 m)
Alpine (> 2200 m) Treeline (1800 - 2200 m) Below treeline (< 1800 m) 0
-10
-20
Air
te
m
pe
rat
ur
e
(°
C) 0
-10
-20
(a) Stations
(b) HRDPS
15 Jan 20 Jan 25 Jan 30 Jan 4 Feb 9 Feb
Figure 3.Air temperatures (a)measured at stations and (b)forecast by the High Resolution
TCD
9, 1857–1885, 2015Meteorological, elevation, and slope
effects on surface hoar formation
S. Horton et al.
Title Page
Abstract Introduction
Conclusions References
Tables Figures
◭ ◮
◭ ◮
Back Close
Full Screen / Esc
Printer-friendly Version Interactive Discussion
Discussion
P
a
per
|
Discussion
P
a
per
|
Discussion
P
a
per
|
Discussion
P
a
per
|
Re
la
tive
hu
m
id
ity
(%)
Abbott (2130 m) Fidelity (1905 m) Rogers Pass (1305 m)
Alpine (> 2200 m) Treeline (1800 - 2200 m) Below treeline (< 1800 m)
Re
la
tive
hu
m
id
ity
(%)
100
75
50
25
100
75
50
25
(a) Stations
(b) HRDPS
15 Jan 20 Jan 25 Jan 30 Jan 4 Feb 9 Feb
Figure 4.Relative humidity(a)measured at stations and (b)forecast by the High Resolution
TCD
9, 1857–1885, 2015Meteorological, elevation, and slope
effects on surface hoar formation
S. Horton et al.
Title Page
Abstract Introduction
Conclusions References
Tables Figures
◭ ◮
◭ ◮
Back Close
Full Screen / Esc
Printer-friendly Version Interactive Discussion
Discussion
P
a
per
|
Discussion
P
a
per
|
Discussion
P
a
per
|
Discussion
P
a
per
|
W
ind
sp
ee
d
(m
s
-1) Abbott (2130 m)
Fidelity (1905 m) Rogers Pass (1305 m)
Alpine (> 2200 m) Treeline (1800 - 2200 m) Below treeline (< 1800 m)
(a) Stations
(b) HRDPS 10
5
0
W
ind
sp
ee
d
(m
s
-1 ) 10
5
0
15 Jan 20 Jan 25 Jan 30 Jan 4 Feb 9 Feb
Figure 5.Wind speeds(a)measured at stations and(b)forecast by the High Resolution
TCD
9, 1857–1885, 2015Meteorological, elevation, and slope
effects on surface hoar formation
S. Horton et al.
Title Page
Abstract Introduction
Conclusions References
Tables Figures
◭ ◮
◭ ◮
Back Close
Full Screen / Esc
Printer-friendly Version Interactive Discussion
Discussion
P
a
per
|
Discussion
P
a
per
|
Discussion
P
a
per
|
Discussion
P
a
per
|
1400
1600
1600
1600
1600
1800
1800
1800
1800 2000
2000
2000
2200
2200 2200
2400
30
20
10
0 Sur
face
h
oa
r si
ze
(m
m
)
1400
1600
1600
1600
1600
1800
1800
1800
1800 2000
2000
2000
2200
2200 2200
2400
1400
1600
1600
1600
1600
1800
1800
1800
1800 2000
2000
2000
2200
2200 2200
2400
(a) 22 January (b) 29 January (c) 10 February
Figure 6. Modelled surface hoar sizes at High Resolution Deterministic Prediction System
TCD
9, 1857–1885, 2015Meteorological, elevation, and slope
effects on surface hoar formation
S. Horton et al.
Title Page
Abstract Introduction
Conclusions References
Tables Figures
◭ ◮
◭ ◮
Back Close
Full Screen / Esc
Printer-friendly Version Interactive Discussion
Discussion
P
a
per
|
Discussion
P
a
per
|
Discussion
P
a
per
|
Discussion
P
a
per
|
15 Jan 20 Jan 25 Jan 30 Jan 4 Feb 9 Feb
Figure 7. Modelled surface hoar sizes at High Resolution Deterministic Prediction System
TCD
9, 1857–1885, 2015Meteorological, elevation, and slope
effects on surface hoar formation
S. Horton et al.
Title Page
Abstract Introduction
Conclusions References
Tables Figures
◭ ◮
◭ ◮
Back Close
Full Screen / Esc
Printer-friendly Version Interactive Discussion
Discussion
P
a
per
|
Discussion
P
a
per
|
Discussion
P
a
per
|
Discussion
P
a
per
|
Surface hoar size (mm)0 10 20 1000
1500 2000 2500
Surface hoar size (mm)0 10 20 Surface hoar size (mm)0 10 20 Surface hoar size (mm)0 10 20
Ele
vat
io
n
(m
)
(a) St. Anne / 21 Jan (b) St. Anne / 27 Jan (c) Ursus Minor / 27 Jan (d) Ursus Minor / 7 Feb
Figure 8. Surface hoar sizes observed over different elevations on Mt. St. Anne and Ursus
TCD
9, 1857–1885, 2015Meteorological, elevation, and slope
effects on surface hoar formation
S. Horton et al.
Title Page
Abstract Introduction
Conclusions References
Tables Figures
◭ ◮
◭ ◮
Back Close
Full Screen / Esc
Printer-friendly Version Interactive Discussion
Discussion
P
a
per
|
Discussion
P
a
per
|
Discussion
P
a
per
|
Discussion
P
a
per
|
15 Jan 20 Jan 25 Jan 30 Jan 4 Feb 9 Feb
Sur
face
h
oa
r
size
(m
m
)
20
10
0
North 45° North 30° North 15° Flat South 15° South 30° South 45°
Figure 9.Modelled surface hoar sizes on north- and south-facing slopes with various inclines.
TCD
9, 1857–1885, 2015Meteorological, elevation, and slope
effects on surface hoar formation
S. Horton et al.
Title Page
Abstract Introduction
Conclusions References
Tables Figures
◭ ◮
◭ ◮
Back Close
Full Screen / Esc
Printer-friendly Version Interactive Discussion
Discussion
P
a
per
|
Discussion
P
a
per
|
Discussion
P
a
per
|
Discussion
P
a
per
|
(18 mm)
N E S W N
0 10 20
(14 mm)
N E S W N
(16 mm) (25 mm)
N E S W N
(27 mm) (19 mm)
N E S W N
(15 mm)
N E S W N
0 10 20
(30 mm)
N E S W N N E S W N
Sur
face
h
oa
r
size
(m
m
)
(a) Fidelity / 21 Jan (b) Fidelity / 24 Jan (c) Ursus Minor / 27 Jan (d) St. Anne / 27 Jan
(e) Fidelity / 28 Jan (f) Diamond / 28 Jan (g) Hermit / 4 Feb
Sur
face
h
oa
r
size
(m
m
) Observed (no crust)Observed with crust
Crust thickness Virtual slopes
(15 mm)
Figure 10.Surface hoar sizes observed over different slope aspects during 7 field campaigns.