Abs tract
In this paper, a scaled 3D ship under shock loading is modeled and analyzed by finite element method. By using of shock factor, there is no need to have different tests or even numerical simulation. Shock factor is an important parameter which clarifies shock severity. It was found that although the new shock factor introduced by Yao et al. (2009), when constant, predict the response better than older shock factor, but for varying values of shock factors, the older would predict better. It is also found that costly and time-consuming experiments can be avoided by proper finite element modeling, yet the errors can remain within an acceptable range. The results of the present work can be used as benchmarks for future works.
Key words
underwater shock loading; shock factor; 3D finite element model-ing.
Shock factor investigation in a 3-D finite element
model under shock loading
1 INTRODUCTION
An explosion is a rapid release of energy, and can happen in the air, on the Earth’s surface, underground or underwater [1]. Underwater explosions (UNDEX) occurring in the water near a ship hull are of great concern to surface ships and submarines since they can result in major hull damage. UNDEX is a very important and complex problem [2] and engages with a number of physical laws and properties, including the physical conditions at the boundaries of the explosive and the surrounding water [1].
The sequence of underwater explosion begins with the detonation of a high explosive. After the detonation, a shock wave travels through the charge material at a constant, high speed of approximately 7,620 m/s, converting the solid charge to a dense gas at great temperatures and pressures on the order of 3000 °C and 50,000 atm [2]. After detonation, a transient shock wave is produced and travels throughout fluid media. The peak pressure of this phase is very high, but its duration is extremely short. The second phase is a radial pulsation of the gas bubble as a result of its expansion and compression. Compared with the shock wave, this phase is characterized by lower peak pressure and much longer duration [3].
A m in Z are*, a, Ma zi ar J an gh orba nb
aYoung Researchers Club, Shiraz Branch, Islamic
Azad University, Shiraz, Iran Tel: +989178171427
bDepartment of Mechanical Engineering, Shiraz
Branch, Islamic Azad University, Shiraz, Iran
Received 14 May 2012 In revised form 16 Oct 2012
Latin American Journal of Solids and Structures 10(2013) 941 – 952
Shock wave, rather than bubble pulse, plays a dominant role for its intensity. On the contrast, if the stand-off is large enough, the effects of both shock wave and bubble pulse should be considered simultaneously. Typically, there is a gap between the arrival of the primary pulse and the gas bubble pulse. Therefore, they could be separately analyzed [4].
An alternative method for experimental and analytical ways to predict the effect of UNDEX on structures is to use similarity criteria. One of these methods is the “Shock Factor” (SF), which is a description of shock severity. Yao et al. also introduced a new SF based on energy acting on the structure [5]. He emphasized on the effectiveness of his new introduced SF in simulating the responses of a structure under shock loading, rather than former ones.
What is studied in this paper is the role of SF in predicting the response of a scaled ship model under shock loading, in addition to the effects of UNDEX loading on it, using the finite element (FE) software “ABAQUS”. The present paper is organized as follows: In section 2 and 3, shock wave and shock factors are introduced. In section 4, the three-dimensional model of the ship is presented and finally, in part 5, the results are discussed and validated. At first, the results from the ship shock simulations are validated by the empirical formulations and results of Chen et al[3]. Then, the effects of shock loading are studied with SF constant and SF being varied.
2 SHOCKWAVE
During an underwater detonation of an explosive, the charge converts into a very hot and compressed gas and induces a shock wave migrating in the fluid media with a spherical shape and extremely short duration. The pressure of this shock at a given point has an instantaneous rise in time, followed by a decaying exponential fall [2]:
P
(
t
)
=
P
max
exp(
−
t
−
t
0
θ
) (
MPa
)
(1)where
P
max,θ
andt
−
t
0 are the peak pressure of the shock wave (MPa), the time decay constant
(ms) and the time elapsed after the arrival of the shock (ms), respectively.
P
max andθ
areexpressed by the following formulations:
(
1/3)
1(
)
1
max
K
W
R
MPa
P
=
A (2)(
1/3)
2(
sec)
3 / 1
2
W
W
R
m
K
A=
θ
(3)Where
R
andW
are the radial stand-off distance from source to target (m) and the mass ofthe explosive (kg), respectively.
A
1,
A
2,K
1, andK
2 are constants depending on the explosiveLatin American Journal of Solids and Structures 10(2013) 941 – 952
Table 1 Shock wave and bubble parameters [6]
Constants
A
1A
2K
1K
2TNT 1.18 -0.185 52.12 0.092
3 SHOCK FACTOR
The accurate theoretical research on UNDEX is difficult to execute due to its complexity and vast range of loadings (e.g., variations in charge weight, stand-off distance, and relative attack orientation), so model testing and numerical experiments become the main research methods. However, what is important is how to convert the results of model testing to real ship.
SF is a parameter that represents the severity of shock loading. High SF represents high energy impinged on a structure by an underwater shock. Thus, the response and excited damage of a structure can be estimated in terms of SF. Different types of shock factors have been introduced by different methods. In the first method, it is defined as [5]:
C 1 =
W 3
R (4)
The other SF, defined by Yao et al.[5], was defined from the viewpoint of energy. They believe that an SF should be composed of charge weight, stand-off distance, structure geometry and also charge location. This new shock factor, defined on the assumption of spherical shock blast, can preferably reflect the underwater shock loading and can be used as similarity parameter in the analysis of the explosive environment. When it is constant, the time-history curves of the structural total kinetic energy and total potential energy are well alike, and the structural response of the average shock spectrum is generally identical. The formulation is
C
2 = 4
Wl
4R2
+l2
arcsin r
r+R (5)
Where
l
andr
are cylinder length and radius, respectively (Figure 1).Latin American Journal of Solids and Structures 10(2013) 941 – 952 4 BASIC MODEL
A numerical study of structural responses to UNDEX consists of three parts: the structure, the surrounding fluid and the interaction between the fluid and the structure. The structure and surrounding medium can be modeled using the FE method. The interaction between structure and surrounding fluid was considered by DAA1 method [7].
The FE code ABAQUS was used for dynamic response analysis. The pre-processor of ABAQUS was used for three-dimensional mesh generation with the shell element for meshing the structure and the solid element for meshing surrounding water. Underwater shock loading was applied to the structure throughout the water around. The coupling between structure and water was simulated by the acoustic structure interaction method. The whole model is presented in Figure 2(a).
4.1 Structure part
What is modeled hereafter is a ship model, shown in Figure 2(b). The model has a basic structure, 13.2 m long slender box with rectangular section. The section is 0.8 m wide and 0.45 m high. 22 cabins divided along longitudinal direction (0.6 m in length for each cabin) by bulkhead or trans-verse frame were used. The cabins were ended by four watertight cabins, each of them has 3500 kg load capacity and two steel counter-weights (each weighting 85 kg). The bottom and side plates were 8 mm and 5 mm in thickness, respectively. All frames were made from ‘‘L’’ sectioned angle steel. All the structure parts were meshed with 4-node shell element S4R [8] (Figure 3(a)).
4.2 Fluid domain
The infinite fluid domain was modeled and meshed using fluid 4-node AC3D4 acoustic tetrahedral elements in ABAQUS. The fluid elements were given the properties of water. The bulk modulus of water was specified using the formulation
ρ
c
2, whereρ
andc
stand for water density andsound velocity, respectively. The whole FE model of structure surrounded by the fluid is depicted in Figure 3(b).
4.3 Boundary condition
Latin American Journal of Solids and Structures 10(2013) 941 – 952
(a) (b)
Figure 2 Scaled Ship models: a) Attack geometry surrounded by fluid media; b) Basic structure
(a) (b)
Figure 3 Finite element model a) 4-node shell element, S4R; b) FE model
4.4 Model materials
The material of structural model is high-strength steel and obeys Hooke’s law. The parameters of steel and fluid environment (water) are Young’s modulus 210 Gpa, Poisson’s ratio 0.3, Mass density of structure 7850 kg/m3 , Mass density of water 1025 kg/m3 and Underwater acoustic speed 1500 m/s.
5 RESULTS AND DISCUSSION
Latin American Journal of Solids and Structures 10(2013) 941 – 952 5.1 Validation of results
Different loading conditions were applied by changing charge mass and stand-off distance. Charge masses of 0.5 and 1.0 kg and stand-off distances of 4, 5 and 6 m were selected, which resulted in 6 different events, the same as the cases used in Chen et al.[3], (Table 2).
5.1.1 Modal
Modal frequencies were determined and related modes of ship model are plotted in Figure 4. As shown in Table 3, the results are in accordance with the results of Chen et al. [3]. The maximum error is 5.2%; As a consequence, the constructed FE model simulates the real scaled ship well enough.
5.1.2 Peak pressures and profile
Pressure profile in the fluid domain, near the fluid structure interface, is shown in Figure 5. Taking a glance on the figure, one could see the radial-expanding behavior of shockwave that has migrated through fluid media and encounters the structure.
Good agreement between peak pressure in present study and theory was obtained (Table 2). The maximum error is 1.9% (the error increases by increase of stand-off distance and charge weight). It is concluded that shock loading simulation was done well. On the other hand, according to Table 2, peak pressure increases by increase of SF. Thus, SF could be considered as a criterion of underwater explosion severity.
Table 2 Loading events and resulted peak pressures
Event number Charge weight (kg)
Stand-off distance (m)
Peak pressure (MPa) Error % Theory Present study
1 0.5 6 4.80 4.85 1.0
2 0.5 5 5.94 6.03 1.5
3 0.5 4 7.73 7.87 1.8
4 1.0 6 6.29 6.39 1.6
5 1.0 5 7.80 7.95 1.9
6 1.0 4 10.15 10.32 1.7
Table 3 Modal frequencies of scaled ship model
Mode Frequency (Hz) Error %
ABAQUS [3]
1 6.1 5.8 5.2
2 7.0 6.96 0.6
3 16.5 16.1 2.5
4 33.7 32.7 3.0
Latin American Journal of Solids and Structures 10(2013) 941 – 952
Mode 1 Mode 2 Mode 3
Mode 4 Mode 5
Figure 4 Mode shapes of scaled ship model
Figure 5 Pressure profile in the fluid domain, near the fluid-structure interface (for 0.5 kg TNT and stand-off 6 m)
5.1.3 Acceleration
One of the important criteria in ship design under shock loading is acceleration, because of its damage to the electrical utilities and other sensitive equipments. Hereafter, point A1 (Figure 6) was
adopted on the structure surface. Its acceleration due to shot (0.5 kg exactly under the structure at the stand-off of 6 m) is plotted to show its severity (Figure 7). The peak acceleration value of point A1 is 3118g (g=9.81 m/s2), which compares well with [3], 3137g (the error is 0.6%).
Latin American Journal of Solids and Structures 10(2013) 941 – 952
Figure 6 Points adopted on the structure bottom surface (all dimensions are in meter)
Figure 7 Acceleration of point A1 (0.5 kg exactly under the structure at the stand-off of 6 m)
In this section, the model was checked in three sub-sections: modal analysis, shock loading effect and the resulting acceleration. It is concluded that the FE model is valid and can be used for shock factor investigation (discussed in the next sub-section), which is the further main aim of this paper.
5.2 Shock factor investigation
As explained before, a new shock factor was introduced by [5], which was an update form of the simple representation of SF (C
1). Different events, containing stand-off and charge weight, have
been defined for a constant value of SF, for both C
1 andC2, the same as the cases used in [5]. The-se caThe-ses can be found in Table 4 and Table 5. The structure impact responThe-se was analyzed by the average spectrum velocity which is the arithmetical average of all adopted nodes (shown in Figure 6). The equation of average spectrum velocity is:
V
=
V
i i n
∑
i
=
1,..., 8
(13)Where
V
is the average spectrum velocity, andV
Latin American Journal of Solids and Structures 10(2013) 941 – 952 The related average spectrum velocities (in direction Y, according to Figure 2) for constant C
1 and C
2 (based on the points specified in Figure 6) are depicted in Figure 8. Though the shock factors corresponding to the curves in Figure 8(a) are almost alike, they still discrete severely. As shown in Figure 8(b), for constant shock factor C
2, average spectrum velocities collate well and only the shape of curves have slight difference. According to these results, it is concluded that “Shock factor
C
2 preferably reflects the equivalency of underwater shock loading”. In other words, for constant SFs, the differences between average spectrum velocities of C
1 are more than the ones of C2.
Table 4 Events series defined for verification of C 1 [5]
104 . 0 1=
C Case 1 Case 2 Case 3 Case 4 Case 5 Case 6
Stand-off distance, R (m) 9 12 15 18 24 30
Charge weight, W (kg) 0.81 1.92 3.75 6.48 15.36 30
Table 5 Events series defined for verification of C
2 [5]
149 . 2
2 =
C Case 7 Case 8 Case 9 Case 10 Case 11 Case 12
Stand-off distance, R (m) 9 12 15 18 24 30
Charge weight, W (kg) 4.7 6.8 9.4 12.5 21.7 30
(a) (b)
Figure 8 Average shock spectrum velocity for a) C
1=0.104; b) C2 =2.149
Another approach to investigate the effects of underwater shock loading on structural response is to define varying shock factor. In order to do so, different cases with various stand-off distances and charge weights were defined which produced different values for SFs (Table 6). For the cases described in Table 6, peak shock velocities were determined. In Figure 9, quotient of obtained
values of C
1, C2 and peak velocity to their first values (i.e.
C 1 n C 1 13, C 2 n C 2 13 and V ave
( )
nV ave
( )
13Latin American Journal of Solids and Structures 10(2013) 941 – 952
are shown. From the figure it is obvious that an increase in the ratio C1 n
C
1
13 generates an
approximated proportional increase in
( )
Vave nV
ave
( )
13, whereas an increase in C2
n
C 2
13 don’t hold this
proportion and also the fraction values of C
1 are closer to peak shock velocity. As a result, C1
would predict shock severity better than C
2 and if someone wants to use SF for predicting shock severity while it is varying, C
1 is a better choice than C2.
Table 6 Events series defined to have varying SFs
Events Case
13 Case 14 Case 15 Case 16 Case 17 Case 18 Case 19 Case 20 Case 21 Stand-off
distance, R (m)
10 20 25 35 40 45
60 65 70
Charge weight, W (kg)
1.278 9.827 26.655 79.783 149.137 255.776
589.227 873.768 1249.37
1
C 0.4 0.6 0.8 1.0 1.2 1.4 1.6 1.8 2.0
2
C
0.113 0.157 0.207 0.255 0.305 0.355 0.405 0.455 0.505Figure 9 Average shock velocity, C
Latin American Journal of Solids and Structures 10(2013) 941 – 952 6 CONCLUSIONS
In the present work, shock response was studied numerically on a scaled, 3D ship modeled by FE method subjected to underwater shock loading. Validation of the model was done with theory and experimental data in the literature. Results, such as peak pressure values, modal frequencies, mode shapes and acceleration, were compared and showed good agreement with theory and experiment. Also, the behavior of shock spectrum velocity was investigated. Conclusions are as follows:
1- Costly and time-consuming experiments could be avoided using a virtual environment (proper FE modeling), yet the errors can remain within an acceptable range.
2- Shock factor could be used as an important criterion in order to predict shock spectrum velocity (as a symbol of underwater shock loading). As a general rule, “the more the shock factor, the more the underwater shock loading”.
3- For a constant shock factor (with different values of stand-off distance and charge weight), C
2 would estimate the response of the structure more accurate than C
1 (Figure 8).
4- For varying values of shock factor, C
1 would predict the response of structure better than C2 (as shown in Figure 9).
References
[1] Bangash, M.Y.H. (2009). Shock, Impact and Explosion: Structural Analysis and Design. Springer.
[2] Cole, R. H. (1948). Underwater explosions. New Jersey: Princeton University Press.
[3] Chen, Y., Tong, Z.P., Hua, H.X., Wang, Y., Gou, H.Y. (2009). Experimental investigation on the dynamic re-sponse of scaled ship model with rubber sandwich coatings subjected to underwater explosion. Int. J. Impact Eng., Vol. 36, p. 318–328.
[4] Rajendran, R. (2009). Numerical simulation of response of plane plates subjected to uniform primary shock load-ing of non-contact underwater explosion. J. Materials and Design, Vol. 30, Issue 4, p. 1000–1007.
[5] Yao, X.-l., Guo, J., Feng, L.-h., Zhang, A-m. (2009). Comparability research on impulsive response of double stiffened cylindrical shells subjected to underwater explosion. Int. J. Impact Eng., Vol. 36, p. 754–762.
[6] Ucar, H. (2006). DYNAMIC RESPONSE OF A CATAMARAN-HULL SHIP SUBJECTED TO UNDERWA-TER EXPLOSIONS. Master’s Thesis, Naval Postgraduate School, Monterey, California.
[7] Geers, T. L. (1978). Doubly Asymptotic Approximations for Transient Motions of Submerged Structures. J. Acoust. Soc. Am., Vol. 64, p. 1500-1508.
Latin American Journal of Solids and Structures 10(2013) 941 – 952 Appendix
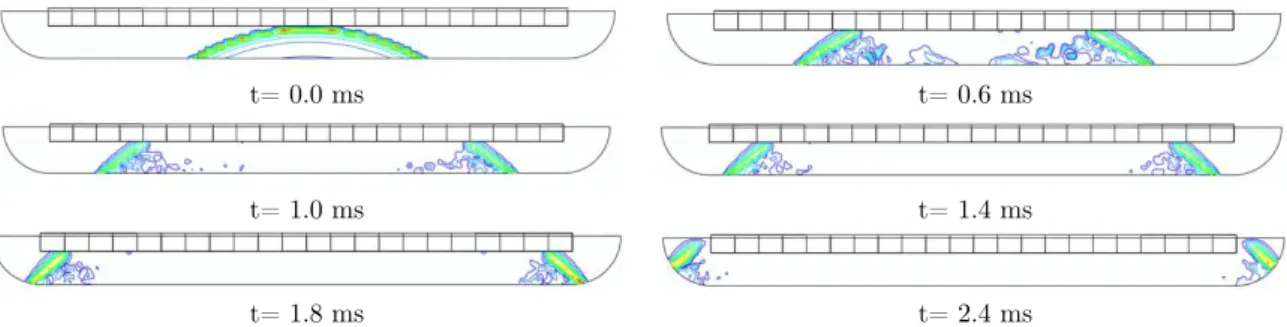
Some typical pressure contours of the model by different times are shown in Figure 10 to show the propagation of shock wave throughout the fluid domain near the structure.
t= 0.0 ms t= 0.6 ms
t= 1.0 ms t= 1.4 ms
t= 1.8 ms t= 2.4 ms