www.atmos-chem-phys.net/8/2201/2008/ © Author(s) 2008. This work is distributed under the Creative Commons Attribution 3.0 License.
Chemistry
and Physics
Technical Note: Continuity of MIPAS-ENVISAT operational ozone
data quality from full- to reduced-spectral-resolution operation
mode
S. Ceccherini1, U. Cortesi1, P. T. Verronen2, and E. Kyr¨ol¨a2
1Istituto di Fisica Applicata “N. Carrara” (IFAC) del Consiglio Nazionale delle Ricerche (CNR), Firenze, Italy 2Earth Observation, Finnish Meteorological Institute, Helsinki, Finland
Received: 24 October 2007 – Published in Atmos. Chem. Phys. Discuss.: 16 January 2008 Revised: 31 March 2008 – Accepted: 31 March 2008 – Published: 21 April 2008
Abstract.MIPAS (Michelson Interferometer for Passive At-mospheric Sounding) is operating on the ENVIronmental SATellite (ENVISAT) since March 2002. After two years of nearly continuous limb scanning measurements, at the end of March 2004, the instrument was stopped due to problems with the mirror drive of the interferometer. Operations with reduced maximum path difference, corresponding to both a reduced-spectral-resolution and a shorter measurement time, were resumed on January 2005. In order to exploit the reduction in measurement time, the measurement scenario was changed adopting a finer vertical limb scanning. The change of spectral resolution and of measurement scenario entailed an update of the data processing strategy. The aim of this paper is the assessment of the differences in the qual-ity of the MIPAS ozone data acquired before and after the stop of the operations. Two sets of MIPAS ozone profiles acquired in 2003–2004 (full-resolution measurements) and in 2005–2006 (reduced-resolution measurements) are com-pared with collocated ozone profiles obtained by GOMOS (Global Ozone Monitoring by Occultation of Stars), itself also onboard ENVISAT. The continuity of the GOMOS data quality allows to assess a possible discontinuity of the PAS performances. The relative bias and precision of MI-PAS ozone profiles with respect to the GOMOS ones have been compared for the measurements acquired before and after the stop of the MIPAS operations. The results of the comparison show that, in general, the quality of the MI-PAS ozone profiles retrieved from reduced-resolution
mea-Correspondence to:U. Cortesi ([email protected])
surements is comparable or better than that obtained from the full-resolution dataset. The only significant change in MIPAS performances is observed at pressures around 2 hPa, where the relative bias of the instruments increases by a fac-tor of 2 from the 2003–2004 to 2005–2006 measurements.
1 Introduction
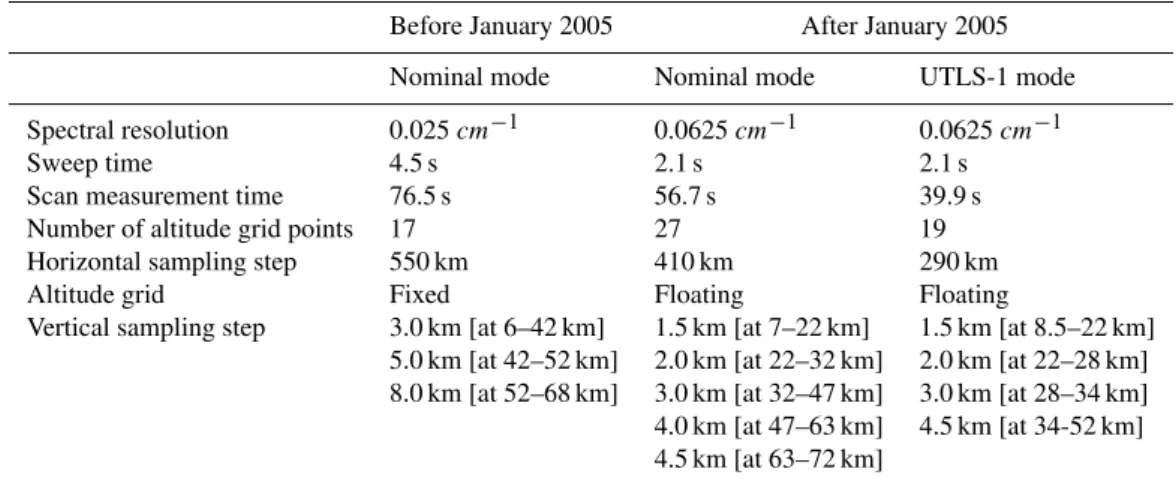
Table 1.Comparison between the MIPAS observation modes adopted before and after January 2005
Before January 2005 After January 2005 Nominal mode Nominal mode UTLS-1 mode Spectral resolution 0.025cm−1 0.0625cm−1 0.0625cm−1
Sweep time 4.5 s 2.1 s 2.1 s Scan measurement time 76.5 s 56.7 s 39.9 s Number of altitude grid points 17 27 19 Horizontal sampling step 550 km 410 km 290 km Altitude grid Fixed Floating Floating
Vertical sampling step 3.0 km [at 6–42 km] 1.5 km [at 7–22 km] 1.5 km [at 8.5–22 km] 5.0 km [at 42–52 km] 2.0 km [at 22–32 km] 2.0 km [at 22–28 km] 8.0 km [at 52–68 km] 3.0 km [at 32–47 km] 3.0 km [at 28–34 km] 4.0 km [at 47–63 km] 4.5 km [at 34-52 km] 4.5 km [at 63–72 km]
after January 2005 in the optical configuration and in the measurement scenario. In fact, MIPAS performed observa-tions at full-spectral-resolution (0.025 cm−1) for the first two years of the ENVISAT mission (March 2002–March 2004). A gap in instrument acquisitions exists from March 2004 to January 2005, when operation were suspended to investigate the source of anomalies observed in the interferometric drive unit (Frerick et al., 2006). MIPAS operations started again in January 2005, at reduced-spectral-resolution (0.0625 cm−1)
and using a new measurement scenario. Results of level 2 analysis for a limited number of orbits in the period 2005– 2006 were made available for validation purposes. Based on the assumption that the quality of the ozone products derived from GOMOS nighttime measurements was fairly constant during the entire period under investigation and considering that MIPAS ozone operational data from the full-spectral-resolution mission have already undergone an extensive vali-dation process (Cortesi et al., 2007), we can use the results of the comparison between coincident ozone data from MIPAS 2003–2004 and 2005–2006 periods against GOMOS mea-surements for an assessment of the quality of the O3profiles
retrieved from MIPAS reduced-resolution measurements. In the following sections, we will first provide all relevant infor-mation about MIPAS and GOMOS datasets that will be used for our comparison. In Sect. 2, we will describe the main dif-ferences between MIPAS full- and reduced-resolution oper-ation modes, with details about the instrument configuroper-ation and the measurement scenario adopted in the two cases. In Sect. 3, we will resume the key features of GOMOS ozone measurements, to be used as a benchmark for highlighting any change in MIPAS O3products. A detailed description
and justification of the strategy adopted for the continuity check of MIPAS O3data quality is provided in Sect. 4. The
results of the comparison will be discussed in Sect. 5. In
Sect. 6, we will present our conclusions about the quality of MIPAS ozone profiles retrieved from the reduced-spectral-resolution measurements.
2 MIPAS ozone measurements
The MIPAS (Michelson Interferometer for Passive Atmo-spheric Sounding) instrument (Fischer et al. (2000), Fischer et al. (2007) and http://envisat.esa.int/dataproducts/mipas) is a Fourier transform infrared spectrometer operating onboard the ENVISAT satellite launched by ESA on 1 March 2002. MIPAS measures from space the limb thermal emission of the atmosphere in the middle infrared (from 685 to 2410 cm−1), a region containing a large fraction of the black body emission of the atmosphere as well as features due to the ro-vibrational spectra of most atmospheric constituents. The measured signal is integrated over the Instantaneous Field Of View (IFOV) of the instrument, equal to 3×30 km2 (vertical height times across-track width, at 10 km tangent altitude). From July 2002 to March 2004 the instrument ac-quired nearly continuous limb scanning measurements with an interferometer Maximum Path Difference (MPD) equal to 20 cm, corresponding to a spectral resolution of 0.025 cm−1.
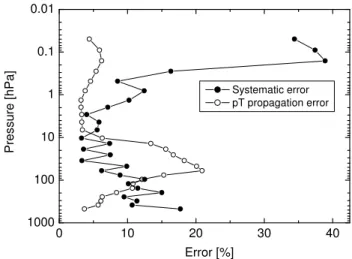
Fig. 1.Estimated systematic errors and errors propagated from the errors on pressure and temperature for the ozone profiles retrieved from full-spectral-resolution MIPAS measurements (in %).
at tangent altitudes and the vertical profiles of six selected species (namely O3, H2O, CH4, HNO3, N2O and NO2) in
the altitude range from 6 to 68 km. The retrieval algorithm performs a Gauss-Newton non-linear least squares fit mod-ified by the Levenberg-Marquardt method using a global fit strategy. The fit is performed on a selected set of spectral in-tervals (called “microwindows”) that contain the maximum information on the species to be retrieved. A detailed de-scription of the used algorithm can be found in the works of Ridolfi et al. (2000) and of Raspollini et al. (2006). Inves-tigations on anomalies occurred in the interferometer slide speed showed a mechanical degradation of the instrument. In order to prevent the risk of a fatal blockage of the interferom-eter MIPAS was switched-off at the end of March 2004 and operations with a reduced MPD, equal to 8.2 cm, and a re-duced duty cycle (35% “on” and 65% “off”) were resumed in January 2005. Subsequently, due to the reduction of the ob-served anomalies, the duty cycle has been increased stepwise to 80% “on” and 20% “off” and restored to 100% “on” since 1 December 2007. The interferograms acquired with reduced MPD are Fourier-transformed in spectra and re-sampled with a spectral resolution of 0.0625 cm−1, with a reduction of a factor 2.5 with respect to the original one. Because of the smaller value of the MPD also a reduction of the measure-ment time from 4.5 s to 2.1 s is obtained. This reduction in measurement time is exploited adopting an observation sce-nario with a finer vertical measurement grid and with more frequent limb sequences. Furthermore, for the new operation mode it was decided to adopt a floating altitude-sampling grid, in order to follow roughly the tropopause height along the orbit with the requirement to collect at least one spec-trum per sequence within the troposphere, while avoiding too many cloud-affected spectra which give problems in the
Fig. 2.Estimated systematic errors and errors propagated from the errors on pressure and temperature for the ozone profiles retrieved from reduced-spectral-resolution MIPAS measurements (in %).
analysis. In the nominal observation mode adopted after Jan-uary 2005, a MIPAS limb scan consists of 27 spectra that look at different tangent altitudes from 7 to 72 km with a step of 1.5 km in the troposphere and lower stratosphere and of up to 4.5 km in the high stratosphere. After January 2005 a significant fraction of MIPAS measurements was acquired in the special observation mode UTLS-1 (Upper Troposphere Lower Stratosphere-1), that was planned to study the upper troposphere and lower stratosphere region. The acquisition time of a limb sequence is 56.7 s and 39.9 s for the nom-inal and for the UTLS-1 mode respectively. In Table 1 the comparison between the nominal observation mode adopted before January 2005 and the nominal and UTLS-1 observa-tion modes adopted after January 2005 is reported.
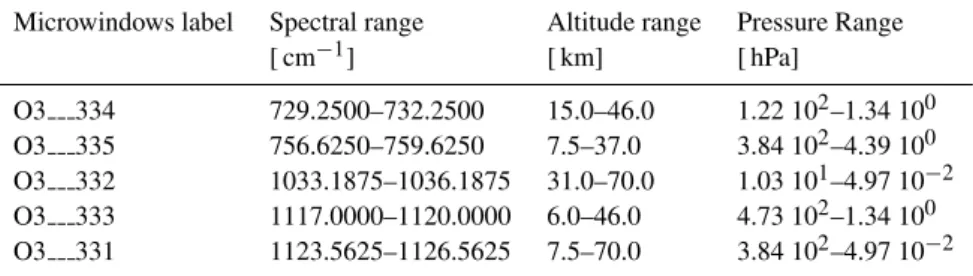
grid that at low altitudes is smaller than the vertical IFOV, therefore contiguous limb scanning views are overlapping. This situation, combined with the choice of a retrieval grid that matches the measurement grid, determines an ill-conditioning of the inversion and the need for a regular-ization in order to avoid instabilities in the retrieved pro-files. For this reason the MIPAS retrieval algorithm has been modified by introducing a Tikhonov regularization, whose strength is determined by means of the error consistence method (Ceccherini, 2005 and Ceccherini et al., 2007). Be-cause of the finer measurement and retrieval grids and of the weakness of the adopted regularization, the ozone pro-files retrieved from measurements acquired after January 2005 have an improved vertical resolution with respect to those retrieved from measurements acquired before January 2005 (Ceccherini et al., 2006). For the analysis of the MIPAS measurements acquired after January 2005 a new set of microwindows (optimized for the new measurement mode) for the ozone retrieval has been selected. In partic-ular, a larger number of spectral points is considered (3035 for reduced-spectral-resolution measurements with respect to 2006 for full-spectral-resolution measurements), in order to compensate for the loss of information content caused by the reduced-spectral-resolution. The microwindows used for the retrieval of MIPAS full- and reduced-spectral-resolution measurements were provided by University of Oxford (Dud-hia et al., 2002) and are reported in Tables 2 and 3 respec-tively. Only a sub-set of spectral points within these mi-crowindows is used in the fitting procedure, for optimal ex-ploitation of the information content of the spectra
The use of different microwindows for measurements ac-quired with full- and reduced-spectral-resolution determines different systematic errors and different errors propagated from the errors on pressure and temperature for the ozone profiles.
Figs. 1 and 2 show the estimated systematic errors and the errors propagated from the uncertainties on pressure and temperature for the ozone profiles retrieved from full- and reduced-spectral-resolution MIPAS measurements. We re-call that in the case of MIPAS a sequential analysis of the individual target is made. Therefore, the results of pres-sure/temperature retrieval are used in the subsequent re-trievals of the minor constituents and, accordingly, the prop-agation of the associated errors must be accounted for the error budget.
MIPAS reduced-spectral-resolution measurements ac-quired after January 2005 have not yet been processed with the ESA operational processor. However, a subset of the ac-quired measurements has been analyzed using the prototypes MIGSP 2.7 for level 1b and ML2PP/5.0 for level 2 and dis-tributed to the scientific community. Therefore, the ozone profiles retrieved from MIPAS measurements acquired dur-ing 140 ENVISAT orbits from January 2005 to May 2006 in either nominal (18 profiles) or UTLS-1 (68 profiles) modes are available and have been used for the comparisons
re-ported in this paper. The same dataset has been used in other validation studies, e.g. for comparison with the ACE-FTS ozone measurements (Dupuy et al., 2008).
3 GOMOS ozone measurements
GOMOS (Global Ozone Monitoring by Occultation of Stars) is a stellar occultation instrument onboard the ENVISAT satellite (see Bertaux et al. (1991), Bertaux et al. (2000), Bertaux et al. (2004), Kyr¨ol¨a et al. (2004), Kyr¨ol¨a et al. (2006), and http://envisat.esa.int/dataproducts/gomos). The starting altitude is 130 km and the first few measurements are used to determine the star’s undisturbed spectrum (the ref-erence spectrum). The integration time is 0.5 s, which gives the altitude sampling resolution 0.5–1.6 km depending on the altitude and the azimuth angle of the measurement. The GO-MOS instrument has a large scanning mirror controlled by a star tracker. Light is forwarded through a slit to the two holo-graphic gratings and to two fast photometers. During night-time measurements the slit is not needed but during daynight-time measurements the slit restricts the intrusion of scattered so-lar light into the instrument. For daytime observations the scattered solar light increases the measurement noise in oc-cultation retrievals (Verronen et al., 2007).
The spectrally resolved light is recorded by CCD (Charge Coupled Device) detectors. The spectral ranges are 250– 690 nm, 750–776 nm, and 916-956 nm, which enable re-trieval of vertical profiles of O3, NO2, NO3, H2O, O2, neutral
density, and aerosols. The two photometers work at blue and red wavelengths at a frequency of 1 kHz. Photometer data are used to make the scintillation correction for the spectrometer data. From the photometer data it is also possible to retrieve high resolution (resolution of 200 m) temperature profiles in the range of 15–40 km using the spatial separation of rays by chromatic refraction.
Table 2. Microwindows used for the retrieval of MIPAS full-spectral-resolution measurements. For each microwindow the altitude range where it is used is reported, along with the corresponding approximate pressure values.
Microwindows label Spectral range Altitude range Pressure Range [ cm−1] [ km] [ hPa]
O3 021 763.3750–766.3750 6.0–68.0 4.73 102–6.72 10−2 O3 013 1039.3750–1040.3250 52.0–68.0 6.24 10−1–6.72 10−2 O3 001 1122.8000–1125.8000 6.0–68.0 4.73 102–6.72 10−2
Table 3. Microwindows used for the retrieval of MIPAS reduced-spectral-resolution measurements. For each microwindow the altitude range where it is used is reported, along with the corresponding approximate pressure values.
Microwindows label Spectral range Altitude range Pressure Range [ cm−1] [ km] [ hPa]
O3 334 729.2500–732.2500 15.0–46.0 1.22 102–1.34 100 O3 335 756.6250–759.6250 7.5–37.0 3.84 102–4.39 100 O3 332 1033.1875–1036.1875 31.0–70.0 1.03 101–4.97 10−2 O3 333 1117.0000–1120.0000 6.0–46.0 4.73 102–1.34 100 O3 331 1123.5625–1126.5625 7.5–70.0 3.84 102–4.97 10−2
In the spectral inversion, the model transmission func-tion is fitted to the refracfunc-tion-corrected transmissions si-multaneously at all wavelengths by a non-linear Levenberg-Marquardt method (Kyr¨ol¨a et al., 1993, Sihvola, 1994). This absolute cross-section method had to be modified after it was realized that so-called isotropic scintillations modify transmissions in such a way that the scintillation correction method is not able to eliminate them. Therefore NO2 and
NO3 retrieval is now based on sub-iteration using
differen-tial cross-sections (Hauchecorne et al., 2005). The vertical inversion is performed using the onion-peeling method. A smoothness constraint is applied to the inversion using the target resolution Tikhonov method (Sofieva et al., 2004). For ozone the target vertical resolution is 2 km below 30 km, increases linearly to 3 km at 40 km, and remains the same above that. An iteration loop over spectral and vertical inver-sion is performed in order to take into account the tempera-ture dependence of the cross-sections.
The random error estimation is based on the propagation of all level 1b errors, largest contributors of which are dark current and photon noise, through the spectral and vertical inversions. An additional error source in level 2 is the step where intensity fluctuations from scintillations are removed using photometer data. This additional error is estimated from large numbers of equatorial measurements with vary-ing azimuth angle. The underlyvary-ing assumption is that the ozone distribution around the equator is relatively constant and the variability of ozone profiles comes from the scin-tillations. The degree of scintillation error depends on the azimuth angle. The additional scintillation error seems to
be overestimated in the GOMOS product used in this work (level 2 version 5.00), see Sofieva et al. (2007). The valid-ity regions of retrieved constituents vary, depending on the type of the occulted star and on the state of the atmosphere. The valid altitude range of ozone retrievals is generally 15– 100 km with the exception of weak and cool stars that pro-vide valid profiles only up to 45 km.
The GOMOS data validation activity has been carried out since the summer of 2002. The comprehensive validation of ozone against ground-based and balloon-borne instruments has been presented in Meijer et al. (2004). The results show that in dark limb the GOMOS data agree very well with the correlative data: between 14 and 64 km altitude their differ-ences show only a small (2.5–7.5%) insignificant negative bias with a standard deviation of 11–16% (19–63 km). This conclusion was demonstrated to be independent of the star temperature and magnitude and the latitudinal region of the GOMOS observation, with the exception of a slightly larger bias in the polar regions at altitudes between 35 and 45 km.
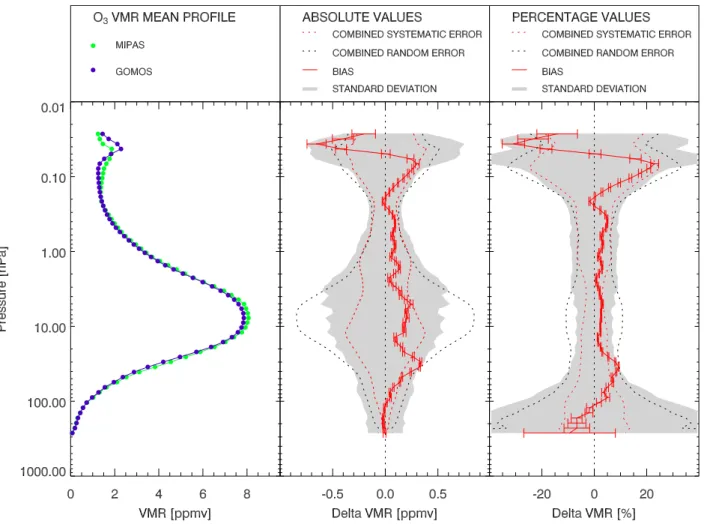
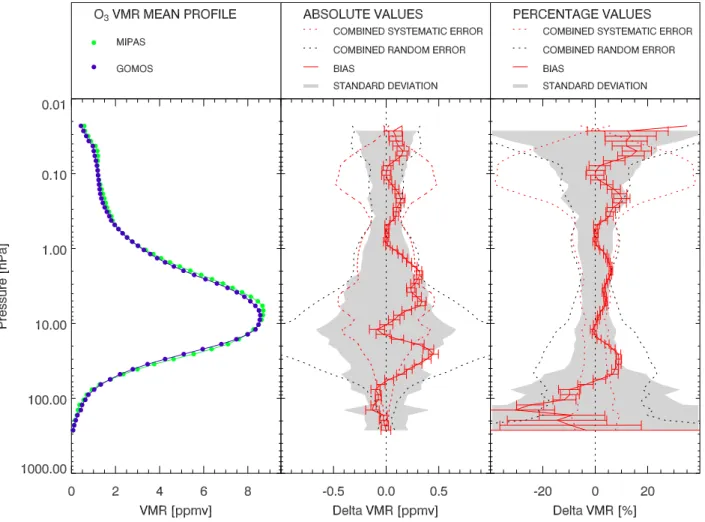
Fig. 3. Results of the comparison for the period of MIPAS full-spectral-resolution measurements (2003–2004). The left panel shows the MIPAS and GOMOS ozone VMR mean profiles. O3VMR differences between MIPAS and GOMOS and associated uncertainties are plotted in the middle panel (absolute values in ppmv) and in the right panel (relative values as a percentage of GOMOS O3VMR mean profile). In
each plot we display the bias (red solid line, with error bars representing the SEM values), the random (black dashed line) and systematic (red dashed line) errors of the bias and its standard deviation (shaded area).
example, the brightest star Sirius is no more used by GO-MOS in the equatorial region.
The noise of the GOMOS CCDs has increased steadily since launch. This has led to increased measurement errors but the overall bias has not increased. However, there seems to be a slight decrease in the upper limits of the validity re-gions of weak, cool stars. The increased random noise is reflected in the estimated GOMOS errors.
In the current comparison, we have used night-time data exclusively. This selection was made by requiring the solar zenith angle of the measurement tangent point to be 110 de-grees or larger. To assure the reliability of the ozone data in the full altitude range, we selected target stars according to the recommendation of Kyr¨ol¨a et al. (2006). The stellar magnitude was required to be 7000 K or larger, and the stel-lar visual magnitude was required to be 1.9 or smaller.
4 Validation strategy
The strategy adopted for the validation of ozone vertical pro-files retrieved from MIPAS reduced-spectral-resolution mea-surements was based on the comparison of MIPAS full- and reduced-resolution level 2 products against coincident ozone data from GOMOS. This approach relied on the fact that:
(a) GOMOS data quality stayed reasonably stable, without suffering any major discontinuity in the period 2003– 2006;
(b) MIPAS ozone operational products (v4.61 and v4.62), for the period July 2002–March 2004, have already been validated, as already mentioned in the previous sections (see, for instance, Sect. 2).
Fig. 4.Results of the comparison for the period of MIPAS reduced-spectral-resolution measurements (2005–2006). The format of the plots is the same as in Fig. 3.
of level 2 geophysical products, by comparing coincident MIPAS and GOMOS ozone profiles acquired in 2003–2004 and in 2005–2006. Any discrepancy between the outcomes of the comparison of the two datasets can be attributed to al-terations in MIPAS data quality after the gap in instrument operations occurred between March 2004 and January 2005. We required that coincident pairs of GOMOS and MI-PAS ozone profiles satisfy the following spatial and temporal matching criteria:
• the spatial separation between coincident profiles should not exceed 3 degrees in latitude and 6 degrees in longitude;
• the time delay between coincident profiles should not be larger than 3 hours.
We also verified that the comparison pairs selected on the basis of the above mentioned criteria did not include pro-files acquired by MIPAS and GOMOS on opposite sides of the polar vortex boundary. It was not necessary, therefore,
to apply additional matching criteria for filtering coincident profiles acquired in regions of strong horizontal gradients. A subset of MIPAS ozone profiles (and coincident GOMOS data) was chosen from the operational products available for the full-resolution mission (see Sect. 5 for more details), whilst the entire ensemble of MIPAS ozone data provided by ESA for validation purposes was considered for the reduced-resolution measurements.
The comparison was based on the calculation of both ab-solute and relative differences between vertical profiles of ozone VMR retrieved from coincident measurements of MI-PAS and GOMOS. O3VMR differences, computed from
in-dividual comparison pairs, were used to evaluate the bias:
bj = 1 Nj
Nj X
i=1
[xijMIPAS−xijGOMOS] (1)
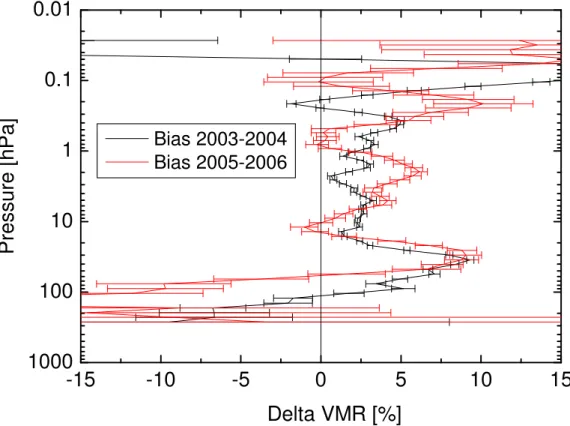
Fig. 5.Mean percentage difference between GOMOS and MIPAS ozone data (relative to the GOMOS mean profile) calculated for MIPAS full-resolution (2003–2004, in black) and reduced-resolution (2005–2006, in red) datasets.
Sect. 5 for details) andxMIPASij andxijGOMOS are the ozone VMR values interpolated on the same level for theith pair of MIPAS and GOMOS profiles.
The uncertainty on the bias can be estimated from the Standard Error on the Mean (SEM):
SEMj = σj p
Nj
(2) whereσj is the standard deviation of the biasbj:
σj = v u u t
PNj i=1[x
MIPAS ij −x
GOMOS ij −bj]2 (Nj−1)
(3) with associated uncertainty1σj (see, for instance, Sivia, 1996):
1σj = σj p
2(Nj−1)
. (4)
The relative values for the above quantitities have been cal-culated as a percentage of the GOMOS O3mean profile.
5 Results and discussion
In this section we will describe the results of the compar-isons between GOMOS and MIPAS ozone profiles and we
will try to highlight potential differences in the quality of MIPAS products retrieved from measurements at full- and at reduced-spectral-resolution. In Fig. 3 we show the overall re-sult of the comparison for the period of MIPAS full-spectral-resolution measurements. In this case, we compared 1633 coincident pairs of MIPAS and GOMOS O3profiles acquired
during 2003–2004: one month of data was selected for each season – i.e. April 2003 (63 pairs), July 2003 (125 pairs), October 2003 (541 pairs) and January 2004 (904 pairs) - and average values were calculated on the resulting dataset. O3
VMR differences averaged over the individual months (not shown here) provided similar results with no evidence of sea-sonal effects. In the left panel of Fig. 3, mean vertical profiles of ozone VMR obtained by MIPAS and by GOMOS are plot-ted. Mean values are calculated by averaging individual pro-files interpolated on a common pressure grid (built from cli-matological values for mid-latitude/Spring conditions, with pressure levels corresponding to the range from 5 to 75 km in steps of 1 km). In the middle panel, we report the mean absolute difference (in ppmv) between MIPAS and GOMOS ozone VMR as a function of pressure (red solid line), with error bars representing the SEM values. The combined sys-tematic (red dashed line) and random (black dashed line) er-rors of the O3VMR differences, as estimated from the
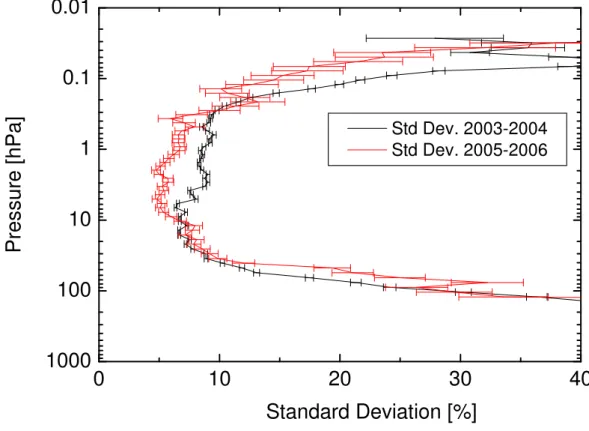
Fig. 6. Standard deviation of the differences between GOMOS and MIPAS ozone profiles as a percentage of the GOMOS mean profile, calculated for MIPAS full-resolution (2003–2004, in black) and reduced-resolution (2005–2006, in red) datasets.
are overplotted and can be compared with the mean profile of the O3 VMR difference and with its standard deviation
(shaded area) respectively for bias and precision validation purposes. It is important to notice that the combined system-atic error only includes the estimate of systemsystem-atic effects on MIPAS ozone retrieval, as a detailed evaluation of systematic uncertainties on GOMOS ozone profiles are not available at the time of our analysis. In the right panel, a similar plot is presented, displaying the same quantities (VMR differences and errors) of the middle panel expressed as percentage of the GOMOS mean profile. The mean profile of the difference between MIPAS and GOMOS O3VMR appears to be within
the combined systematic errors of the comparison from the upper troposphere up to the lower mesosphere, with the only significant exception of the pressure layer around 40 hPa, where a positive bias of∼10% is found. This bias can be, however, partly explained by considering that the contribu-tion of GOMOS error budget is currently not included in the estimate of the systematic errors reported in Fig. 3 and that a rough estimate of this component (a few percent) can ac-count for the exceedingly large values of the mean difference at 40 hPa. The current estimate of the combined random er-rors, on the other hand, is fully consistent with the precision of the comparison in the pressure range 3–40 hPa. Minor discrepancies (with the standard deviation of the bias larger
than the random error by up to a factor of 2.5) are observed outside this range, especially at lower altitudes.
The overall outcome of the comparison confirms the good quality of ozone products from MIPAS full-spectral-resolution mission. In particular:
(a) the estimate for the bias is less than 5% from 25 hPa to 0.2 hPa and between 5% and 10% for pressure values larger than 25 hPa and less than 0.1 hPa. This result is in agreement with the outcomes of MIPAS ozone vali-dation activity (Cortesi et al., 2007), as well as with an independent assessment of MIPAS ozone data quality performed in the frame of the ASSET (ASSimilation of Envisat daTa) project, as described by Lahoz et al. (2007);
(b) the precision of the comparison is between 6% and 10% in the range from 40 hPa to 0.25 hPa.
The same comparison was performed on the set of ozone profiles available for the period of MIPAS reduced-resolution mission. In this case, a total number of 86 coincident pairs was considered, as already described in details in Sect. 2. The results of the comparison are displayed in Fig. 4.
values reported in the middle and in the right panel respec-tively, the bias is always within the current estimate of MI-PAS systematic error, if we exclude the pressure levels be-tween 20 hPa and 50 hPa. The larger values of the bias ob-served in this layer could still be within the combined sys-tematic error of the comparison, when including the missing contribution from GOMOS, consistently with what we have previously observed for MIPAS full-resolution mission. Also in this case, the precision of the comparison is less than the combined random error for pressure values less than 65 hPa. The standard deviation of the mean difference increases at lower altitudes up to a factor 3 of the random error. It is worth noticing that the estimated random error is much larger than the observed precision around 20 hPa; this feature can be explained, taking into account that the component of MI-PAS error budget due to pT propagation error shows a peak approximately at the same level (see Fig. 2) and has been considered, in our calculation, as a purely random error. If this is not the case and if the pressure/temperature propaga-tion error, for the selected dataset, is contributing to the bias and shall be considered as part of the systematic error of the comparison, we will tend to overestimate the random uncer-tainties as observed in Fig. 4.
In general, the overall result of the comparison for the dataset of MIPAS reduced-resolution measurements can be summarized by estimating a bias less than 5% in the pres-sure range from 0.4 hPa to 20 hPa, excluding the layer around
∼2 hPa, where a larger bias (∼6%) is observed, and within 10% in the stratosphere for pressure values smaller than 100 hPa. The precision error, on the other hand, appears to be between 5% and 10% in the range 0.28 hPa to 40 hPa.
To better visualize the results of the comparison between MIPAS ozone data quality at full- and reduced-spectral-resolution, we report the vertical profiles of the bias and of the precision error for the two datasets in Fig. 5 and in Fig. 6 respectively. The error bars represent the uncertainties on the bias and on the precision estimated as described in Sect. 4.
A similar behaviour is observed in the results of the com-parison for 2003–2004 and for 2005–2006 in the lower stratosphere, with relatively high values of the bias up to
∼10% around 40 hPa.
A peak of the bias is also observed between 1 and 2 hPa, both in the 2003–2004 (3%) and in the 2005–2006 (6%) datasets, whilst the results of MIPAS reduced-resolution measurements provide a better agreement with GOMOS around 12 hPa and 0.7 hPa (mean difference consistent with zero for 2005–2006 and about 3% for 2003–2004). In the range from 10 hPa to 0.3 hPa, the precision error is approxi-mately constant for both the full-resolution and the reduced-resolution datasets, with the latter providing slightly better performances (i.e. average precision value being∼6% for 2005–2006 and∼8% for 2003–2004). At pressure below 10 hPa the reduced-resolution measurements show a preci-sion error larger than, or equal to, that of the full-resolution measurements.
6 Conclusions
In this paper, we have compared ozone vertical profiles re-trieved from GOMOS measurements with coincident data obtained by MIPAS during its full- and reduced-resolution mission, with the aim of verifying the continuity of MIPAS O3 data quality after instrument operations were stopped
in March 2004 and subsequently resumed in January 2005. The results of the comparison for the period of MIPAS full-resolution measurements are fully consistent with the out-come of previous validation experiments: the bias is within the systematic error of the comparison throughout the whole profile from the lowest levels up to 0.05 hPa, except for a sin-gle layer around 40 hPa. The observed precision is explained by the a priori estimate for the random error of the compari-son in the range from 3 hPa to 40 hPa. We demonstrated that similar conclusions apply to the dataset of MIPAS reduced-resolution measurements. In this case, we found that the bias is constantly less than 10% for the whole pressure range from 100 hPa up to 0.05 hPa. In this range the bias is also consis-tent with the combined systematic error of the comparison, with the only exception of the layer around 40 hPa, as for the 2003–2004 measurements. The precision error is fully jus-tified by the estimate of the combined random error for all levels with pressure values smaller than 65 hPa.
Acknowledgements. This study was partially supported by the ESA contract 17580/03/I-OL. MIPAS data were provided by the European Space Agency. The authors gratefully acknowledge T. Fehr and B. Carli for their helpful comments and suggestions.
Edited by: U. P¨oschl
References
Barbieri, A., Diekmann, F. J., Fraisse, R., Frerick, R., J., Canela, M., and Saavedra de Miguel, L.: GOMOS In-Orbit Operations and Failure Recoveries, SPACEOPS 2006, 19–23 June 2006, Rome, Italy.
Bertaux, J. L., M´egie, G., Widemann, T.,Chassefiere, E., Pelli-nen, R., Kyr¨ol¨a, E., Korpela, S., and Simon, P.: Monitoring of ozone trend by stellar occultations, The GOMOS instrument, Adv. Space Res., 11(3), 237–242, 1991.
Bertaux, J. L., Kyr¨ol¨a, E., and Wehr, T.: Stellar occultation tech-nique for atmospheric ozone monitoring: GOMOS on Envisat, Earth Obs. Q., 67, 17–20, 2000.
Bertaux, J. L., Hauchecorne, A., Dalaudier F., et al.: First results on GOMOS/Envisat, Adv. Space Res., 33, 1029–1035, 2004. Ceccherini, S.: Analytical determination of the regularization
pa-rameter in the retrieval of atmospheric vertical profiles, Optics Letters, 30, 2554–2556, 2005.
Ceccherini, S., Belotti, C., Carli, B., Raspollini, P., and Ridolfi, M.: MIPAS new measurement scenario: enhanced vertical res-olution and regularization, ESA Publication SP-628, European Space Agency, 2006.
Ceccherini, S., Belotti, C., Carli, B., Raspollini, P., and Ridolfi, M.: Technical Note: Regularization performances with the error consistency method in the case of retrieved atmospheric profiles, Atmos. Chem. Phys., 7, 1435–1440, 2007,
http://www.atmos-chem-phys.net/7/1435/2007/.
Cortesi, U., Lambert, J. C., De Clercq, C., Bianchini, G., Blumen-stock, T., Bracher, A., Castelli, E., Catoire, V., Chance, K. V., De Mazi`ere, M., Demoulin, P., Godin-Beekmann, S., Jones, N., Jucks, K., Keim, C., Kerzenmacher, T., Kuellmann, H., Kuttip-purath, J., Iarlori, M., Liu, G. Y., Liu, Y., McDermid, I. S., Mei-jer, Y. J., Mencaraglia, F., Mikuteit, S., Oelhaf, H., Piccolo, C., Pirre, M., Raspollini, P., Ravegnani, F., Reburn, W. J., Redaelli, G., Remedios, J. J., Sembhi, H., Smale, D., Steck, T., Taddei, A., Varotsos, C., Vigouroux, C., Waterfall, A., Wetzel, G., and Wood, S.: Geophysical validation of MIPAS-ENVISAT ozone data, Atmos. Chem. Phys., 7, 1–61, 2007,
http://www.atmos-chem-phys.net/7/1/2007/.
Dudhia, A., V.L.Jay, C.D. Rodgers, Microwindow selection for high-spectral-resolution sounders, Appl. Opt., 41, 3665-3673, 2002.
Dupuy, E., Walker, K. A., Kar, J., et al. Validation of ozone mea-surements from the Atmospheric Chemistry Experiment (ACE), Atmos. Chem. Phys. Discuss., 8, 2513–2656, 2008,
http://www.atmos-chem-phys-discuss.net/8/2513/2008/. Fischer, H., Blom, C., Oelhaf, H., Carli, B., Carlotti, M.,
Del-bouille, L., Ehhalt, D., Flaud, J.-M., Isaksen, I., Lopez-Puertas, M., McElroy, C. T., and Zander, R.: Envisat-MIPAS – An instru-ment for atmospheric chemistry and climate research, edited by:
C. Readings and R.A. Harris, ESA Publication SP-1229, Euro-pean Space Agency, 2000.
Fischer, H., Birk, M., Blom, C., Carli, B., Carlotti, M., von Clar-mann, T., Delbouille, L., Dudhia, A., Ehhalt, D., EndeClar-mann, M., Flaud, J. M., Gessner, R., Kleinert, A., Koopmann, R., Langen, J., L´opez-Puertas, M., Mosner, P., Nett, H., Oelhaf, H., Perron, G., Remedios, J., Ridolfi, M., Stiller, G., and Zander, R.: MI-PAS: an instrument for atmospheric and climate research, Atmos. Chem. Phys. Discuss., 7, 8795–8893, 2007,
http://www.atmos-chem-phys-discuss.net/7/8795/2007/. Frerick, J., Canela, M., Diekmann, F. J., Rosen, J., Barbieri, A.,
Mosner, P.: MIPAS In-Orbit Operations and Failure Recoveries, SPACEOPS 2006, 19–23 June 2006, Rome, Italy.
Hauchecorne, A., Bertaux, L., Dalaudier, F., Cot, C., Lebrun, J.-C., Bekki, Marchand, S., Kyr¨ol¨a, M., Tamminen, E., Sofieva, J. V., Fussen, D., Vanhellemont, F., Fanton d’Andon, O., Barret, G., Mangin, A., Theodore, B., Guirlet, M., Snoeij, P., Koop-man, R., Saavedra de Miguel, L., Fraisse, R., and Renard, J.-B.: First simultaneous global measurements of nighttime strato-spheric NO2 and NO3 observed by Global Ozone Monitoring
by Occultation of Stars (GOMOS)/Envisat in 2003, J. Geophys. Res., 110, D18301, doi:10.1029/2004JD005711, 2005.
Kyr¨ol¨a, E., Sihvola, E., Kotivuori, Y., Tikka, M., Tuomi, T., and Haario, H.: Inverse theory for occultation measurements: 1. Spectral inversion, J. Geophys. Res., 98, 7367–7381, 1993. Kyr¨ol¨a, E., Tamminen, J., Leppelmeier, G. W., et al.: GOMOS on
Envisat: An overview, Adv. Space Res., 33, 1020–1028, 2004. Kyr¨ol¨a, E., Tamminen, J., Leppelmeier, G. W., et al., Nighttime
ozone profiles in the stratosphere and mesosphere by the Global Ozone Monitoring by Occultation of Stars on Envisat, J. Geo-phys. Res., 111, D24306, doi:10.1029/2006JD007193, 2006. Meijer, Y. J., Swart, D. P. J., Allaart, M., Andersen, S. B., Bodeker,
G., Boyd, I., Braathen, G., Calisesi, Y., Claude, H., Dorokhov, V., von der Gathen, P., Gil, M., Godin-Beekmann, S., Goutail, F., Hansen, G., Karpetchko, A., Keckhut, P., Kelder, H. M., Koele-meijer, R., Kois, B., Koopman, R. M., Kopp, G., Lambert, J.-C., Leblanc, T., McDermid, I. S., Pal, S., Schets, H., Stubi, R., Suortti, T., Visconti, G., and Yela, M.: Pole-to-pole valida-tion of Envisat GOMOS ozone profiles using data from ground-based and balloon sonde measurements, J. Geophys. Res., 109, D23305, doi:10.1029/2004JD004834, 2004.
Nett, H., Frarick, J., Paulsen, T., and Levrini, G.: The atmospheric instruments and their applications: GOMOS, MIPAS and SCIA-MACHY, ESA Bulletin (ISSN 0376-4265), 106, 77–87, 2001. Raspollini, P., Belotti, C., Burgess, A., Carli, B., Carlotti, M.,
Cec-cherini, S., Dinelli, B. M., Dudhia, A., Flaud, J.-M., Funke, B., Hoepfner, M., Lopez-Puertas, M., Payne, V., Piccolo, C., Reme-dios, J. J., Ridolfi, M., and Spang, R.: MIPAS level 2 operational analysis, Atmos. Chem. Phys., 6, 5605–5630, 2006,
http://www.atmos-chem-phys.net/6/5605/2006/.
Ridolfi, M., Carli, B., Carlotti, M., von Clarmann, T., Dinelli, B. M., Dudhia, A., Flaud, J.-M., H¨opfner, M., Morris, P. E., Raspollini, P., Stiller, G., and Wells, R. J.: Optimized forward model and re-trieval scheme for MIPAS near-real-time data processing, Appl. Opt., 39, 1323–1340, 2000.
Sivia, D. S.: Data Analysis, A Bayesian Tutorial, Clarendon Press – Oxford, 1996.
Sofieva, V. F., Kyr¨ol¨a, E., Dalaudier, F., et al.: Influence of scintilla-tion on quality of ozone monitoring by GOMOS, Proceedings of the Envisat Symposium, ESA SP-636, Montreux, Switzerland, 23–27 April, 2007.
Sofieva, V. F., Tamminen, J., Haario, H., Kyr¨ol¨a, E., and Lehti-nen, M.: A priori smoothness on ozone profile smoothness in the inversion from limb measurements, Ann. Geophys., 22(10), 3411–3420, 2004.