BGD
5, 3623–3663, 2008Annual African biomass burning temporal dynamics
G. Roberts et al.
Title Page
Abstract Introduction
Conclusions References
Tables Figures
◭ ◮
◭ ◮
Back Close
Full Screen / Esc
Printer-friendly Version
Interactive Discussion Biogeosciences Discuss., 5, 3623–3663, 2008
www.biogeosciences-discuss.net/5/3623/2008/ © Author(s) 2008. This work is distributed under the Creative Commons Attribution 3.0 License.
Biogeosciences Discussions
Biogeosciences Discussionsis the access reviewed discussion forum ofBiogeosciences
Annual and diurnal African biomass
burning temporal dynamics
G. Roberts, M. J. Wooster, and E. Lagoudakis
King’s College London, Environmental Monitoring and Modeling Research Group, Department of Geography, Strand, London, WC2R 2LS, UK
Received: 20 June 2008 – Accepted: 5 August 2008 – Published: 9 September 2008
Correspondence to: G. Roberts (gareth.j.roberts@kcl.ac.uk)
BGD
5, 3623–3663, 2008Annual African biomass burning temporal dynamics
G. Roberts et al.
Title Page
Abstract Introduction
Conclusions References
Tables Figures
◭ ◮
◭ ◮
Back Close
Full Screen / Esc
Printer-friendly Version
Interactive Discussion
Abstract
Africa is the single largest continental source of biomass burning emissions. Here we conduct the first analysis of one full year of geostationary active fire detections and fire radiative power data recorded over Africa at 15-min temporal resolution and a 3 km sampling distance (at the sub-satellite point) by the SEVIRI imaging radiometer
on-5
board the Meteosat-8 satellite. We use these data to provide new insights into the rates and totals of African open biomass burning, particularly into the extremely strong sea-sonal and diurnal cycles that exist across the continent. We find peak daily biomass combustion totals are 9 and 6 million tonnes per day in the Northern and Southern Hemispheres respectively, and total fuel consumption between February 2004 and
Jan-10
uary 2005 is at least 855 million tonnes. Analysis is carried out with regard to fire pixel temporal persistence, and we note that the majority of African fires are detected only once in consecutive 15 min imaging slots, indicating the importance of optimizing the fire pixel detection strategy performance. An investigation of the variability of the diur-nal fire cycle is carried out with respect to 20 land cover types, and whilst differences
15
are noted between land covers, the diurnal characteristics for a given land cover type are similar in both African hemispheres. We compare the FRP-derived biomass com-bustion estimates to burned-areas, both at the scale of individual fires and over the entire continent at a 1-degree spatial scale. Fuel consumption estimates are found to be less than 2 kg/m2for almost all land cover types, and for savanna grasslands where
20
literature values are commonly reported the FRP-derived median fuel consumption es-timate of 309 g/m2 appears reasonable. From mid-2008, geostationary FRP data of the type presented here will become available to interested users continuously and in near real-time from the EUMETSAT Land Surface Analysis Satellite Applications Facil-ity (LandSAF), allowing the types of analysis presented in this paper to be undertaken
25
BGD
5, 3623–3663, 2008Annual African biomass burning temporal dynamics
G. Roberts et al.
Title Page
Abstract Introduction
Conclusions References
Tables Figures
◭ ◮
◭ ◮
Back Close
Full Screen / Esc
Printer-friendly Version
Interactive Discussion
1 Introduction
Biomass burning is a key Earth system process, a major element of the terrestrial car-bon cycle and a globally significant source of atmospheric trace gases and aerosols (Hao et al., 1990; Andreae and Merlot, 2001). Varying with their size, location and tim-ing, fires significantly modify land surface properties, influence atmospheric chemistry
5
and air quality, and perturb the radiation budget (IPCC, 2001). Millions of square km of the African landscape are burned each year, and fire in Africa is characterized by strong variability, particularly diurnally and seasonally (Giglio et al., 2006b). African fires are responsible for an average of perhaps 30 to 50% of the total amount of vegetation burned globally each year, making Africa, on average, the single largest biomass
burn-10
ing emissions source (Andreae, 1991; van der Werf et al., 2003; van der Werf et al., 2006). Burning of biomass is accompanied by a wide variety of characteristic spectral signatures that can be detected by remote sensing, including those related to thermal emissions from actively burning fires, to the albedo and spectral reflectance changes induced by newly burned surfaces, and to the presence of smoke plumes containing
15
trace gas and aerosols in highly elevated concentrations (Trentmann et al., 2002; Jost et al., 2003). For these reasons, and because of the widespread and variable na-ture of global biomass burning, observations from Earth observation (EO) satellites are considered pivotal to better characterizing the extent and influence of this global phenomenon. Observations of actively burning fires probably represent the longest
du-20
ration application of satellite EO in the detection and quantification of biomass burning (Dozier, 1981). Most studies of active fires have relied on data from polar-orbiting satel-lites, but their restricted overpass frequency, coupled with the diurnal fire cycle, means that the information provided typically represents a limited temporal sample that may not be fully consistent with the need to link emissions estimates to models of
atmo-25
BGD
5, 3623–3663, 2008Annual African biomass burning temporal dynamics
G. Roberts et al.
Title Page
Abstract Introduction
Conclusions References
Tables Figures
◭ ◮
◭ ◮
Back Close
Full Screen / Esc
Printer-friendly Version
Interactive Discussion 2002; Roberts et al., 2005). In particular, active fire detections derived from the GOES
satellite have been used by Reid et al. (2004) and Holben et al. (1996) to parameter-ize the lower boundary condition of atmospheric process models in order to determine smoke emissions longevity, transport, effects and fate. Despite their relatively coarse spatial resolution, the GOES-derived active fire data has significant impact on forecasts
5
of atmospheric aerosol loading (Reid et al., 2004).
The Meteosat-8 and -9 satellites of the Meteosat Second Generation system, were launched in 2002 and 2005 respectively, and offer the potential of geostationary active fire detection across Africa, Earth’s most fire-affected continent. Both satellites carry the SEVIRI instrument, an imaging radiometer with a 3 km sampling distance at the
10
sub-satellite point and a repeat cycle that provides measurements in eleven channels covering the 0.6–14µm spectral range every 15 min. The reader is referred to Aminou et al. (1997) for a full technical description of SEVIRI, and to Roberts et al. (2005) for an introduction on how the multi-spectral radiance measures it provides can be used to identify pixels containing actively burning fires. At each such pixel the rate
15
of Fire Radiative Energy (FRE) release, also called the Fire Radiative Power (FRP), can also be retrieved from the instruments infrared radiance measures, a parameter that is highly correlated to the rate of fuel consumption and thus smoke emissions production (Wooster et al., 2005; Freeborn et al., 2008). Temporal integration of FRP provides a measure of a fire’s FRE, which can be converted to an estimate of total fuel
20
consumption using the relations of Wooster et al. (2005).
This paper concentrates on exploiting the first full year of active fire detections, FRP and FRE data recorded by SEVIRI over the African continent in order to investigate the seasonal and diurnal cycle of biomass burning in Northern and Southern Hemisphere Africa (NHA and SHA), the pattern and amounts of fuel consumed, and how these vary
25
BGD
5, 3623–3663, 2008Annual African biomass burning temporal dynamics
G. Roberts et al.
Title Page
Abstract Introduction
Conclusions References
Tables Figures
◭ ◮
◭ ◮
Back Close
Full Screen / Esc
Printer-friendly Version
Interactive Discussion
2 Dataset description and continental scale fire dynamics
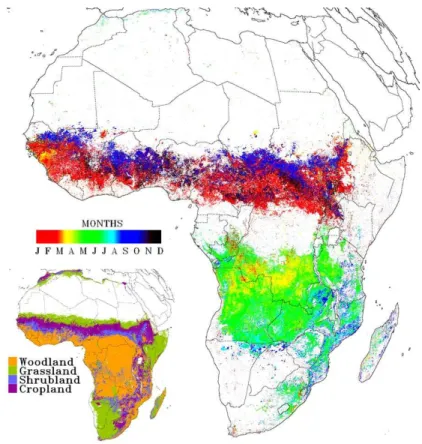
The data used in this work were produced via application of the fire detection algorithm described in Roberts and Wooster (2008) to SEVIRI level 1.5 imagery covering Febru-ary 2004 to JanuFebru-ary 2005 (the data for JanuFebru-ary 2004 still being part of the SEVIRI instrument commissioning phase). Figure 1 shows the spatial and temporal pattern of
5
fires across the African continent derived from the more than 35 000 images processed as part of this study. It is apparent that in NHA, burning occurs primarily in the Sahel, and moves from the northern to the southern Sahel between November and February, whilst in SHA fires occur primarily between June and October, generally moving from the northeast to southwest of this hemisphere. Fires are much less common in the
10
equatorial areas of the “woodland” landcover class, which is dominated by generally moist tropical forest that is resistant to burning when in an undisturbed state (Bucini and Lambin, 2002).
Notable exceptions from the gross patterns apparent in each hemisphere occur in NHA in Algeria and Morocco, where fires are evident in June and July in agricultural
15
areas close to the coast. There are also some fires in the interior of Algeria at this time, mixed with signals from oil and gas refineries. In SHA, South Africa also displays a longer fire season than most other areas, with some burning occurring throughout the year.
Three months (February, May and August) of the SEVIRI-derived dataset shown in
20
Fig. 1 were compared in detail to active fire data derived from the polar orbiting MODIS sensor, in order to quantitatively understand the geostationary dataset uncertainties. Being of significantly higher spatial resolution and with a wide dynamic range MIR spectral channel, MODIS is well suited to act as a reference sensor for the SEVIRI FRP measures, and this comparison is reported in Roberts and Wooster (2008) and
25
geo-BGD
5, 3623–3663, 2008Annual African biomass burning temporal dynamics
G. Roberts et al.
Title Page
Abstract Introduction
Conclusions References
Tables Figures
◭ ◮
◭ ◮
Back Close
Full Screen / Esc
Printer-friendly Version
Interactive Discussion stationary and polar-orbiter derived active fire datasets indicates that SEVIRI has a
false alarm detection rate of 6–8% in terms of fire pixels, with these misclassified fire pixels being responsible on average for only 4–6% of the per-scene FRP. This false alarm rate is comparable to that of other active fire detection products where such data have been published (e.g. Giglio et al., 2003a; Feltz et al., 2003). Neither
SE-5
VIRI nor MODIS can detect fires through cloud, though fortunately cloud coverage is minimized during the African fire season in both hemispheres. When a fire is detected near contemporaneously (±6 min) by both SEVIRI and by MODIS, the FRP measures from each sensor show a high level of agreement (r2=0.87, p<0.0001) despite the not insignificant time difference. Thus, provided that a fire is large and/or sufficiently
10
intensely burning to be detectable, SEVIRI should provide a measurement of its en-ergy emission rate suitable for estimating its fuel consumption. At the regional scale, SEVIRI underestimates total area-based FRP by approximately 40% due to the nu-merous lower intensity/smaller fires that remain undetected in the coarser resolution geostationary data. Over the three months examined, specific levels of FRP
underes-15
timation were 39% (February), 37% (May) and 44% (August) (Roberts and Wooster, 2008).
For the purposes of this study the raw SEVIRI-derived active fire data were gridded to 1◦ spatial resolution and adjustments made for the undetected fires and the per-centage cloud-cover within each grid cell, using the methods reported in Roberts et
20
al. (2005) and Roberts and Wooster (2008). The FRP data were corrected for the ef-fects of atmospheric attenuation using the MODTRAN 4.0 radiative transfer code and a tropical atmospheric profile (23 km ground-level visibility), informed by three hourly wa-ter vapor concentration estimates provided by the European Cenwa-ter for Medium Range Weather Forecasting (ECMWF) reanalysis product, interpolated to the SEVIRI
tempo-25
ral frequency (Berk et al., 1999). The GTOPO30 DEM was used to define the surface height for each grid cell.
BGD
5, 3623–3663, 2008Annual African biomass burning temporal dynamics
G. Roberts et al.
Title Page
Abstract Introduction
Conclusions References
Tables Figures
◭ ◮
◭ ◮
Back Close
Full Screen / Esc
Printer-friendly Version
Interactive Discussion cloud-cover adjustment on the FRP data is apparent and becomes more so on either
side of the dry season. May and October represent the times of transition between burning in NHA and SHA, and burning is overall weakest at these times due to the shift in wet and dry seasons between hemispheres. In NHA, peak burning occurs in January where up to 9 Tg (9 million tonnes) of biomass burn each day, whilst in SHA
5
burning peaks in July at 6 Tg per day. The mean daily combustion rate of biomass over Africa is 2 Tg (observed) and 2.3 Tg (cloud weighted).
Estimates of the total amount of biomass consumed by fire in NHA and SHA made using the FRE approach are 414 Tg and 440 Tg respectively. The marginally greater amount found to be consumed in SHA mirrors the findings of van der Werf et al. (2004),
10
who also found that whilst a larger area is burned in NHA (129×104km2 as compared to 75×104km2 in SHA) the generally greater fuel loads in the latter result in greater overall fuel consumption. The 855 Tg FRE-derived estimate for total fuel consumption is, however, significantly lower than that derived by certain bottom-up emissions inven-tory schemes. van der Werf et al. (2004) estimate the figure to be approximately three
15
times this over the same period, whilst estimates for the year 2000 made by Ito and Penner (2004) vary between 1824 and 2705 Tg. Using a similar modeling approach to van der Werf et al. (2004), although using burned area estimates directly to drive the SPITFIRE model within a DGVM, Lehsten et al. (2008) estimate that 1400 Tg of biomass combusted in 2004. However, lower figures also exist, such as for the peak
20
period of burning (May–October) in SHA where Scholes et al. (1996) derived an esti-mate of 90–264 Tg and Korontzi et al. (2004) 174 Tg (April–October). Over the same timeframe (although different years), our estimate is 263 Tg (observed FRP only) to 290 Tg (FRP weighted by cloud cover fraction).
Figure 3a (SHA) and 3b (NHA) presents a first annual country-by-country analysis
25
BGD
5, 3623–3663, 2008Annual African biomass burning temporal dynamics
G. Roberts et al.
Title Page
Abstract Introduction
Conclusions References
Tables Figures
◭ ◮
◭ ◮
Back Close
Full Screen / Esc
Printer-friendly Version
Interactive Discussion each). The magnitude of the cloud cover correction, illustrated temporally in Fig. 2 and
on a country-based in Fig. 3, is largest apparent over DRC, Angola, Sudan and CAR, but its impact is relatively minor. The burning fuel is∼48% carbon, and such data on biomass burning carbon emissions maybe of relevance to the information requested by the United Nations Framework Convention on Climate Change (UNFCCC), to which the
5
majority of African countries are signatories (Braatz et al., 1995). Currently, African na-tions are unable to readily benefit, either financially or technologically, from emissions mitigation schemes implemented under the Clean Development Mechanism (CDM) of the Kyoto Protocol, which focus primarily on more easily quantified industrial emissions from fossil fuel burning (Williams et al., 2007). Improved quantification of other carbon
10
sources (and sinks), and how these might be made to vary with altered land use prac-tices for example, may offer the potential to enable African nations to derive improved benefits in future.
3 FRP temporal dynamics and relationship to landcover
Information on the fire timing, land-cover type affected and amount fuel burned is
use-15
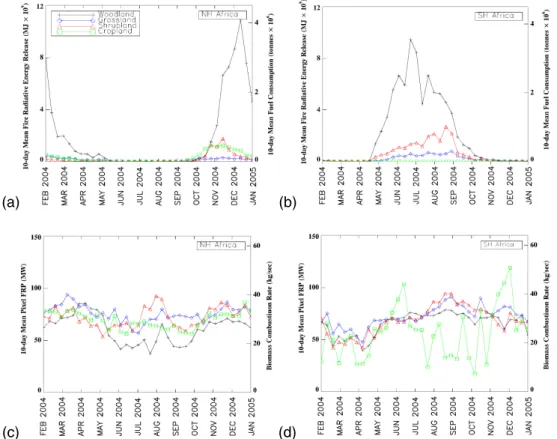
ful for parameterising emissions sources and for linking these to atmospheric chemi-cal transport models. For example, earlier dry season fires tend to more incomplete combustion due to the higher fuel moisture contents, and consequently emit a greater proportion of less oxidized trace gas products such as CO than do later dry season events (Korontzi, 2005). Figure 4a presents the temporal trajectories of daily FRE
cal-20
culated on a decadal (i.e. mean of 10 daily values) basis, together with the equivalent biomass combustion for the four main land cover classes, derived through aggregation of the 21 individual landcover types of the Global Land Cover 2000 (GLC2000) spa-tial database (Mayaux et al., 2004; shown in Fig. 1). According to this categorization, Northern (and Southern) Hemisphere Africa is 19(46)% woodland, 17(25)% grassland,
25
BGD
5, 3623–3663, 2008Annual African biomass burning temporal dynamics
G. Roberts et al.
Title Page
Abstract Introduction
Conclusions References
Tables Figures
◭ ◮
◭ ◮
Back Close
Full Screen / Esc
Printer-friendly Version
Interactive Discussion by fires in woodland (72% of all fire pixels), followed by shrubland (14%), cropland (8%)
and grassland (6%). In NHA, areas of shrubland and cropland experience a short fire season limited to between November and January when agricultural residue (stubble) is burnt after harvest (Yevich and Logan, 2003). In SHA woodland burning dominates the first half of the dry season (May–June), but becomes less dominant later on (July–
5
October) when burning in shrubland and grassland becomes more significant. This corresponds to the southward movement of fire activity from the south-central African woodlands into the shrublands and grasslands of South Africa, as can be seen in Fig. 1. Fig. 4b presents the time-series of decadal mean per-pixel FRP to match the data on mean decadal FRE shown in Fig. 4a. In NHA, around the onset of the main burning
10
season (October/November) there is correspondence between increasing mean per-pixel FRP (Fig. 4b) and the increasing daily FRE (Fig. 4a). Conversely, from the start of the time-series (February 2004), the mean per-pixel FRP of shrubland, grassland and woodland tends generally to increase until the end of the dry season, with the greatest values occurring around the end of the dry season (March–April), even though the daily
15
FRE has already decreased substantially by this time. The inference is that there is less fuel being burned at this time compared to earlier in the dry season, but where fires are occurring the combustion rates are high. One reason maybe that much of the standing dry fuel has already been burned by this time, but what is left has been drying for many months and so burns rapidly and extensively where available.
20
The situation is somewhat similar in the Southern Hemisphere. Between June and September as the dry season progresses, grassland and shrubland cover types, and to a lesser extent woodland, display increasing mean per-pixel FRP values, probably related to the decreasing vegetation moisture content and resultant increasing combus-tion completeness. This is consistent with the findings of Hoffa et al. (1999) deduced
25
BGD
5, 3623–3663, 2008Annual African biomass burning temporal dynamics
G. Roberts et al.
Title Page
Abstract Introduction
Conclusions References
Tables Figures
◭ ◮
◭ ◮
Back Close
Full Screen / Esc
Printer-friendly Version
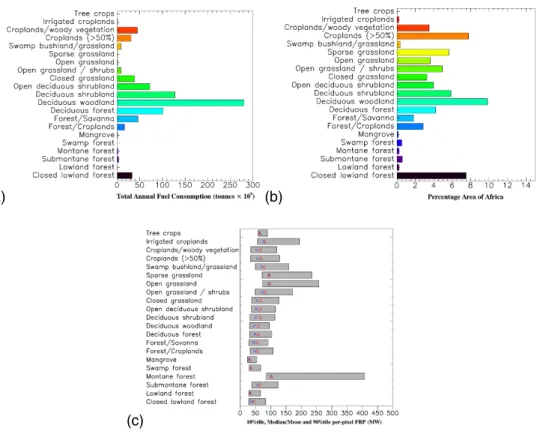
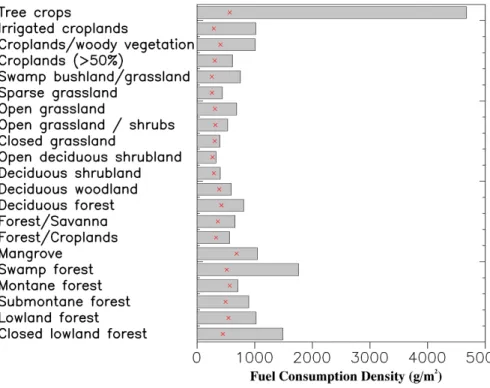
Interactive Discussion Figure 5a shows the total amount of fuel burned across a series of more finely
re-solved land cover classes adapted from those in the GLC2000 database, whose pro-portional surface areas across Africa are shown in Fig. 5b. As expected, due to differing fuel loads and degree of combustibility between each class, the amount of fuel burned is not simply proportional to its relative area. For example, deciduous forest covers the
5
largest surface area, more than twice that of deciduous woodland, but around three times more fuel burns in deciduous woodland. Figure 5c shows the mean, median, 10th and 90th percentiles of the per-pixel FRP measures for each land cover class. The highly skewed nature of the per-pixel FRP distribution for many classes is evident from the fact that the mean frequently falls towards the bottom end of the
distribu-10
tion. The mean per-pixel FRP shows a 70 MW range (from 30 to 100 MW) across the classes, and in general it is the land cover classes that would be expected to have higher proportions of herbaceous finer fuels, for example grasslands, that show greater values. Fine fuels dry most readily and are thus likely to be dominated by flaming combustion and high combustion completeness. In contrast, forest cover types
15
typically exhibit the lowest mean per-pixel FRPs, agreeing with the findings of Giglio et al. (2006) using MODIS-derived FRP measures, and this is likely to be related to the higher vegetation moisture contents and lower combustion completeness found in forests when compared to senescent grasses.
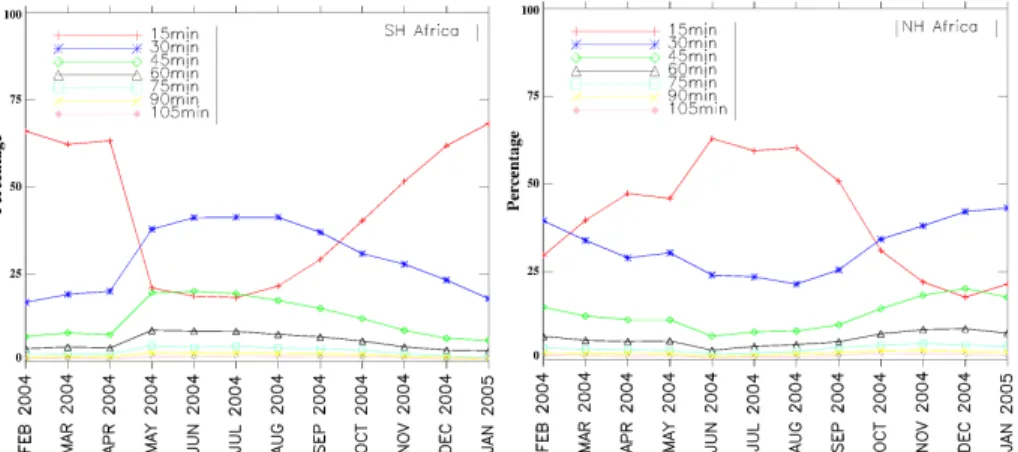
Information on fire pixel duration, calculated from the number of consecutive 15 min
20
imaging slots that a fire pixel is detected at the same location for, is shown in Fig. 6. To a first approximation, the temporal pattern of fire pixel duration in the Northern and Southern Hemispheres appears to be the inverse of one another, corresponding to durations being greatest during the period of peak burning in each hemisphere and to the fact that outside of this period the majority of fire pixels are detected in only a
25
BGD
5, 3623–3663, 2008Annual African biomass burning temporal dynamics
G. Roberts et al.
Title Page
Abstract Introduction
Conclusions References
Tables Figures
◭ ◮
◭ ◮
Back Close
Full Screen / Esc
Printer-friendly Version
Interactive Discussion more fire pixels approach the limit of detectability where they maybe detected on one
slot but not the next, even though they may actually still be burning; and (iii) cloud cover obscuration of fire pixels will increase outside the main burning periods and so may also lead to more intermittent detections. It should also be remembered that fires move across the landscape as they consume fuel, and so in any case will not persist in
5
one pixel indefinitely until they are extinguished. The fact that so many fire pixels fail to be detected in more than one consecutive imaging slot suggests that harsh temporal filtering of the fire pixel results is not an appropriate method for minimising false alarms over Africa. Instead detailed spectral and spatial filtering tests such as those used to derive the dataset used here should be employed (Roberts and Wooster, 2007). The
10
GOES ABBA fire products covering South America (Prins and Menzel, 1992; Prins et al., 1998) do use a temporal filter to remove all fires pixels detected only once, but the conditions found over this extensive and highly-cloud effected tropical forest region may make this method more appropriate.
4 Comparison to independent data sources
15
In addition to active fire detections, two other types of remotely sensed data sources are commonly used to investigate open biomass burning, namely burned area measures (e.g. Roy et al., 2002; Tansey et al., 2004; Zhang et al., 2003) and trace gas/aerosols column concentrations (e.g. Edwards et al., 2006; Jost et al., 2002). In relation to the current work, both these sorts of data can provide independent information to which
20
the SEVIRI-derived active fire data can be compared.
4.1 Comparison to MOPITT CO retrievals
Lui et al. (2005) previously demonstrated a strong agreement between AVHRR-derived active fire pixel counts and MOPITT-derived CO column concentrations over fire-affected regions of North America. However, for southern Africa a number of
BGD
5, 3623–3663, 2008Annual African biomass burning temporal dynamics
G. Roberts et al.
Title Page
Abstract Introduction
Conclusions References
Tables Figures
◭ ◮
◭ ◮
Back Close
Full Screen / Esc
Printer-friendly Version
Interactive Discussion searchers have reported a mismatch in seasonality between these types of data,
with measured CO amounts and the resultant “top-down” source emissions invento-ries derived from inverse modeling with such data peaking between August and Oc-tober (P ´etron et al., 2004; Edwards et al., 2006), whilst those derived from fire-count or burned-area driven “bottom-up” schemes, such as the commonly used Global Fire
5
Emissions Database (GFEDv2) of van der Werf et al. (2003, 2006) generally peak in July or August (as do the SEVIRI-derived combustion estimates shown in Fig. 2). To help demonstrate this disagreement, Fig. 7 provides a direct comparison between CO concentrations retrieved at five different atmospheric levels from MOPITT, and the SEVIRI-derived biomass combustion estimates for the same period. For SHA, the
10
shape of the CO time series at the lowest atmospheric level (1000 hPa) closely matches that of the SEVIRI-derived FRE profile, but with a temporal shift of around two months. CO profiles at the higher atmospheric levels show a similar trend, but with damped amplitude. Swap et al. (2003) proposed that the seasonality discrepancy between emissions inventories derived via “top-down” and “bottom-up” methods maybe a result
15
of local meteorological conditions that serve to locally trap and recycle smoke pollution over the region. However, Edwards et al. (2006) used an atmospheric chemical trans-port model to demonstrate that three quarters of fire-emitted CO would be transtrans-ported out of the region within 8 days, which is too short to explain the seasonality differences observed. As an alternative explanation, van der Werf et al. (2006) suggest the
tem-20
poral lag may result from increased combustion of woody material towards the end of the dry season. This may in part be supported by Fig. 7b, which indicates that mean per-pixel FRP (a potential indicator of combustion completeness) peaks at the same time as the atmospheric CO concentrations. Figure 4b indicates that this apparent southern African combustion completeness maxima is associated with simultaneous
25
refine-BGD
5, 3623–3663, 2008Annual African biomass burning temporal dynamics
G. Roberts et al.
Title Page
Abstract Introduction
Conclusions References
Tables Figures
◭ ◮
◭ ◮
Back Close
Full Screen / Esc
Printer-friendly Version
Interactive Discussion ment of the analysis, may enable better parameterisation of the temporal evolution of
emissions factors.
For completeness, Fig. 7c and 7d illustrate the MOPITT CO and SEVIRI FRP data for Northern Hemisphere Africa. Compared to SHA, the CO concentrations over NHA show far less temporal variability, and appear to have a much weaker relationship to
5
the FRP data than for SHA.
4.2 Comparison to burned area-derived measures
At the scale of individual large fires, the amounts of fuel burned as estimated from SE-VIRI FRP timeseries were compared to calculated pre-fire fuel loads based on time-integrated net primary production (NPP) measures and an observation of the area
10
burned. A baseline region for this comparison was selected using a burned area map from the ESA Globcarbon project (Plummer et al., 2007), and areas of decidu-ous woodland, shrubland and grassland that burned during the 2003 southern African dry season (May–October) were highlighted. Whilst burned area products such as this are known to generally miss some fire-affected areas (i.e. errors of omission), they are
15
believed to be less perturbed by errors of commission and so were believed to provide a suitable mask for identifying fire-affected regions in 2003. Since combustion com-pleteness is recorded to reach 83–98% in these areas (Scholes et al., 1996; Hoffa et al., 1999; Sa et al., 2005), we assumed that the majority of fuel capable of burning was removed during the 2003 fires and started the fuel consumption calculation for the
20
region using NPP data measured after the 2003 fires had ceased.
Within the fire-affected 2003 region, SEVIRI active fire detections were used to iden-tify large fires that burned in the same area in August 2004 over periods of between 1 and 5 days. Eighteen such fires were identified, and MODIS level 1b imagery taken immediately before and after each fire was used to delineate the burned area of each
25
BGD
5, 3623–3663, 2008Annual African biomass burning temporal dynamics
G. Roberts et al.
Title Page
Abstract Introduction
Conclusions References
Tables Figures
◭ ◮
◭ ◮
Back Close
Full Screen / Esc
Printer-friendly Version
Interactive Discussion are available at the highest (250 m) spatial resolution. The burned areas were
de-lineated using image temporal differencing and careful manual analysis, with derived areas ranging from 2 to 40 km2.
At each fire the pre-fire fuel load was calculated from the NPP time-series. NPP measures the production of new terrestrial vegetation, where carbon is allocated to
5
plant stems, leaves and roots. As a result NPP represents a measure of the difference between carbon uptake during photosynthesis and carbon expenditure during respira-tion (Fensholt et al., 2006). NPP data derived from SPOT VGT reflectance imagery and available from http://geofront.vgt.vito.be were used in this work. The data are cal-culated using a VGT-derived estimate of the fraction of absorbed photosynthetically
10
active radiation (fAPAR) at each pixel, and the simplified carbon exchange model of Veroustraete et al. (1996). Estimates of NPP (mgC/m2/d) are provided as a 10-day mean at 1 km2spatial resolution via:
GPPd =Sg,d ·fAPARd ·Fd ·C (1)
NPPd =GPPd(1−Ad) (2)
15
where GPPd=daily Gross Primary Production (GPP; g C/m 2
/d),Sd is the daily incom-ing solar radiation (MJ/m2/d), fAPARd is derived from the NDVI according to Myneni and Williams (1994), Fd expresses the dependency of GPP on incoming solar radia-tion,Cis a factor (unitless) to account for the dry matter conversion efficiency, andAd is the autotrophic respiratory fraction modeled using a linear function of daily mean air
20
temperature (unitless).
NPP data for each burned area was temporally integrated between the times of the 2003 and 2004 fires, in order to calculate the total fuel load available to burn in the 2004 events (in tonnes). Fuel was assumed to be on average 47% carbon, and calculated fuel load densities lay between 129 and 295 gC/m2, with an average of 217 g/m2. This
25
BGD
5, 3623–3663, 2008Annual African biomass burning temporal dynamics
G. Roberts et al.
Title Page
Abstract Introduction
Conclusions References
Tables Figures
◭ ◮
◭ ◮
Back Close
Full Screen / Esc
Printer-friendly Version
Interactive Discussion For comparison to the pre-burn fuel load of each fire, the time-series of
SEVIRI-derived FRP observations were used to calculate total FRE and actual fire-related fuel consumption for each fire event, using the relationships of Wooster et al. (2005). An example is shown in Fig. 8, where it can be seen that the combustion rate is highly vari-able in time and falls to zero at night. Evidently the fire was actually still burning, but
5
was below the SEVIRI detection limit, since the next day the fire signal returns. Similar diurnal patterns were observed for all fires examined, and during the course of this par-ticular 16 km2fire, 18.25×10⁶MJ of FRE was detected by SEVIRI, equivalent to 6700 tonnes of fuel burned. The pre-fire fuel load density was calculated as 420 g/m2, mak-ing the total available fuel also 6700 tonnes and thus providmak-ing a combustion
complete-10
ness of 100%. The majority of the other fires examined has combustion completeness values somewhat lower than this theoretical maximum (Fig. 9), though in two cases it is very slightly higher due to some errors in the parameterizations made here, potentially including fire pixel errors of commission, an overestimated FRP atmospheric correc-tion, NPP or burned area underestimations, or to the fact that significant fuel did in fact
15
remain after the 2003 events and that this subsequently burned in the 2004 fires.
4.3 Continental-scale fuel consumption densities
In order to examine fuel consumption densities over much larger areas than the eigh-teen fire examined in detail in the previous section, the 1◦ gridded FRE-derived total fuel consumption measures were combined with burned area estimates made for the
20
same grid cell resolution. The burned area measures used were taken from the widely used GFEDv2 database, and were themselves derived and validated with a combina-tion of MODIS fire pixel counts and MODIS burned area maps as described in detail by Giglio et al. (2006a). Calculations to derive the fuel consumption density estimates were made at a monthly timestep, and recorded for the dominant GLC2000 landcover
25
BGD
5, 3623–3663, 2008Annual African biomass burning temporal dynamics
G. Roberts et al.
Title Page
Abstract Introduction
Conclusions References
Tables Figures
◭ ◮
◭ ◮
Back Close
Full Screen / Esc
Printer-friendly Version
Interactive Discussion loads in particular have been quite widely measured and so provide a point of
compar-ison. From the current dataset the median fuel consumption for savanna grasslands is 309 g/m2, which agrees quite favorably with that reported in the literature: 221– 477 g/m2(Shea et al., 1996), 296–397g/m2(Govender et al., 2006) and 221–700 g/m2 (Ward et al., 1996). Tree crops have a larger estimate of the fuel load than other cover
5
types due to there being only 5 gridcells where this cover type dominates. Two grid-cells had very high estimates of the amount of biomass combusted and low estimates of burned area. It is likely that a combination of false detections in the SEVIRI dataset and an underestimation of burned area in the GFED dataset contribute to overestimat-ing the fuel load for this cover type.
10
5 Diurnal biomass burning dynamics
A great deal of research has been carried out monitoring the spatial and temporal distribution of African biomass burning (e.g. Giglio et al., 2006b; Giglio, 2007; Cooke et al., 1996; Dwyer et al., 2000; van der Werf et al., 2004; Pack et al., 2000), but with the exception of Giglio (2007) and Pack et al. (2000) investigations into the diurnal
15
variability remains rare, in part due the relative difficulty of investigating these variations with polar orbiting sensors. Giglio (2007) has, however, provided a clear indication that a strong diurnal fire cycle exists across Africa, and that it may vary regionally across the continent. The most notable feature of geostationary systems is their frequent imaging capability, and this is here exploited to further investigate Africa’s diurnal fire cycle at
20
unprecedented temporal resolution. Further understanding of these diurnal patterns may help the temporal partitioning of fire emissions in atmospheric transport models, and might assist in better understanding the mechanisms of land use and land cover change induced by fire. Furthermore, it is often vital to consider diurnal variations when considering the sampling biases potentially induced by the use of multiple polar orbiting
25
datasets that may have varying and different sensor overpass times.
detec-BGD
5, 3623–3663, 2008Annual African biomass burning temporal dynamics
G. Roberts et al.
Title Page
Abstract Introduction
Conclusions References
Tables Figures
◭ ◮
◭ ◮
Back Close
Full Screen / Esc
Printer-friendly Version
Interactive Discussion tions and FRP respectively for Northern and Southern Hemisphere Africa, categorized
by the GLC2000 land cover type and calculated from the full 2004 SEVIRI-derived active fire dataset. We follow the method of Giglio (2007), displaying the normalized temporal cycle, and the location of the cumulative percentile range of 25%, 50% and 75% as vertical dashed lines. Figure 11 indicates that a strong diurnal variability in
5
fire pixel detections clearly exists, and for most landcover types exhibits the form of a skewed distribution with reduced fires between midnight and 7am local time, followed by a rapid increase that peaks around 2pm local time. In most cases the distribution for a particular landcover type is rather similar in both hemispheres. Afternoons are mostly characterized by decreasing burning, but with a slope that is less steep than
10
the increase seen in the morning period. Similar characteristics were noted by Giglio (2007) using TRMM data. The diurnal cycle of FRP is shown in Fig. 12, and for most landcover classes is rather similar to that of fire pixel detections. Both parameters typi-cally peak at the same time, although during the afternoon FRP typitypi-cally decreases at a slower rate than fire pixel detections. The difference between these parameters is more
15
evident in some landcover types than others. For example, swamp bushland/grassland displays a decrease in the number of fire detections around midday, something that is not evident in the FRP trajectory.
From the data of Fig. 11 it is clear that differences exist in the diurnal fire cycle of the different broad land cover types (e.g. forest, shrublands/woodlands, grasslands and
20
croplands). These differences were analysed with respect “width” of the diurnal distri-bution, taken as the 25 and 75 cumulative percentiles of the active fire pixel detections (Fig. 11) and FRP (Fig. 12). The full duration at half maximum (FDHM) was not used, since this is more appropriate for gaussian distributions (Giglio, 2007). Results are shown in Fig. 13a (NHA) and b (SHA), and in general most land cover types can be
25
grass-BGD
5, 3623–3663, 2008Annual African biomass burning temporal dynamics
G. Roberts et al.
Title Page
Abstract Introduction
Conclusions References
Tables Figures
◭ ◮
◭ ◮
Back Close
Full Screen / Esc
Printer-friendly Version
Interactive Discussion lands have a more uniformly distributed biomass burning diurnal cycle, with a diurnal
width of 5 to 8 h. Such herbaceous cover types contain a high proportion of finer fuels that are capable of drying rapidly, most likely enabling fires to persist in an intense man-ner over a longer period of the day. The diurnal distribution of biomass burning for the more herbaceous land cover types actually suggests two peaks, particularly so in the
5
case of open grassland where mid-morning and mid-afternoon peaks are separated by a dip around midday (Figs. 11 and 12). To some extent this phenomena is seen with regard to fire pixel detections in the previous work of both Pack et al. (2000) and Giglio (2007), and a possible cause is the specific land management practices followed in both hemispheres and both parts of the day (i.e. reduced burning around midday,
pos-10
sibly due to reduced anthropogenic ignitions around this time). Another possibility is bias introduced by the fire detection algorithm, though the latter seems unlikely since the phenomena is limited to only this land cover class. It should also be noted that in the case of two land cover types, lowland forest and mangrove, the results do indeed appear to be biased due to these particular landcover types being unusually strongly
15
affected by daytime cloud cover, such that the retrieved diurnal cycles tend toward the inverse of those of all the other landcover classes.
Finally, Fig. 14 presents the diurnal distributions of mean per-pixel FRP for each land cover type. For most cover types, maximum per pixel FRP occurs in the early afternoon, and is typically around twice that of the nighttime value. Cover types with
20
a greater proportion of herbaceous material typically have the highest per-pixel FRP, consistent with the data of Fig. 5c. Generally, results are similar for both hemispheres, although closed lowland forest and swamp/bushland/grassland are notable exceptions. In these cases, the hemisphere with the greatest number of fire pixel detections in that cover type shows the greatest mean per-pixel FRP.
BGD
5, 3623–3663, 2008Annual African biomass burning temporal dynamics
G. Roberts et al.
Title Page
Abstract Introduction
Conclusions References
Tables Figures
◭ ◮
◭ ◮
Back Close
Full Screen / Esc
Printer-friendly Version
Interactive Discussion
6 Discussion and conclusion
We have conducted an analysis of the spatial and temporal dynamics of African biomass burning using the first full year of geostationary FRP data, calculated from over 35 000 individual SEVIRI imaging slots. Using the geostationary observations, patterns of active fire activity have been quantified on a continental scale and at
tem-5
poral frequency previously unavailable for investigation. African biomass burning is shown to involve periods of extreme fuel consumption, but also to be highly variable in space and time. Peak daily biomass combustion totals are 9 and 6 million tonnes per day in the Northern and Southern Hemispheres respectively, but with values close to zero at periods outside of the key dry season of each hemisphere. The fire
diur-10
nal cycle is shown to be strong for both hemispheres and for most landcover types, with combustion rates peaking early in the afternoon in most cases and with relatively little combustion at night. Peak combustion rates in the Northern and Southern Hemi-spheres reach 170 and 200 tonnes of fuel per second respectively.
This manuscript also presents some of the first estimates of the amount of vegetation
15
fuel consumed annually by open biomass burning in Africa, calculated using a common methodology for all African countries. Over 60% of the total fuel burned across Africa is consumed by fires in Angola, DRC, Sudan and the Central African Republic, and over the continent as a whole we estimate that a minimum of 855 million tonnes of biomass was burned in 2004. In both hemispheres, the majority of fire detections
20
occur in woodland and shrubland cover types and, perhaps surprisingly, according to the geostationary data and the GLC2000 landcover map areas classed as croplands contribute more (8% of the total) to biomass burning than do grasslands (6% of the total). Analysis of active fire persistence in a pixel indicates that Southern hemisphere Africa contains a marginally greater number of fires which burn for longer than those in
25
BGD
5, 3623–3663, 2008Annual African biomass burning temporal dynamics
G. Roberts et al.
Title Page
Abstract Introduction
Conclusions References
Tables Figures
◭ ◮
◭ ◮
Back Close
Full Screen / Esc
Printer-friendly Version
Interactive Discussion We have compared the SEVIRI-derived biomass combustion estimates to
burned-area based measures, both at the scale of individual fires and over the entire continent at a 1-degree spatial scale. Fuel consumption estimates were less than 2 kg/m2 for all land cover types, apart from tree crops. In this case the fuel load is overestimated which is believed to result from SEVIRI false detections and an underestimate of the
5
burned area. Over savannas, we calculate median biomass combustion measures of 309 g/m2, which agrees quite well with literature values of∼220–700 g/m2.
In order to be of maximum use to atmospheric scientists and those involved in mod-eling carbon-climate interactions over Africa, the datasets presented here must ideally be extended to include multi-year observations. In part to meet this requirement, the
10
European Organisation for the Exploitation of Meteorological Satellites (EUMETSAT) has instigated a process to operationalise the production of the SEVIRI FRP product, both at the pixel scale and at a reduced spatial and temporal resolution with appro-priate bias adjustments for the limitations induced by geostationary data sources (i.e. the non-detection of smaller/less intense fires), as discussed briefly in Roberts and
15
Wooster (2008). These datasets will be produced at the EUMETSAT Land Surface Analysis Satellite Applications Facility (LandSAF) and the first product versions are ex-pected to be disseminated in near-real time from mid-2008 onwards, and to continue for at least the duration of the Meteosat Second Generation mission.
Acknowledgements. Support for the development and analysis of this dataset came variously
20
from the NERC Earth Observation Enabling Fund (NE/C515498 4/06), the European Union FP6 “CARBOAFRICA” project, and from EUMETSAT. SEVIRI data were kindly provided under an ESA/EUMETSAT AO. MOPITT and MODIS data were provided by the NASA Langley and EDC DAACS respectively. The authors would like to thank the referees for the constructive comments that helped improve this manuscript.
BGD
5, 3623–3663, 2008Annual African biomass burning temporal dynamics
G. Roberts et al.
Title Page
Abstract Introduction
Conclusions References
Tables Figures
◭ ◮
◭ ◮
Back Close
Full Screen / Esc
Printer-friendly Version
Interactive Discussion
References
Aminou, D. M. A., Jacquet, B., and Pasternak, F.: Characteristics of the Meteosat Second Generation Radiometer/Imager: SEVIRI, Proceedings of SPIE, Europto series, 3221, 19– 31, 1997.
Andreae, M. O. and Merlet, P.: Emission of trace gases and aerosols from biomass burning,
5
Global Biogeoch. Cy., 15, 995–966, 2001.
Andreae, M. O.: Biomass Burning: Its history, use and distribution and its impact on the en-vironmental quality and global climate, in: Global Biomass Burning: Atmospheric, Climatic and Biospheric Implications, edited by: Levine, J. S., MIT Press, Cambridge, Massachusetts, 2–21, 1991.
10
Barbosa, P. M., Stroppiana, D., Gr ´egoire, J. M., and Pereira, J. M. C.: An assessment of vegeta-tion fire in Africa (1981–1991): Burned areas, burned biomass, and atmospheric emissions, Global Biogeoch. Cy., 13, 933–950, 1999.
Berk, A., Anderson, G. P., Bernstein, L. S., Acharya, Dothe, H., Matthew, M. W., Adler-Golden, S. M., Chetwynd, J. H., Richtmeier, S. C., Pukall, B., Allred, C. L., Jeong, L. S., and Hoke, M.
15
L.: MODTRAN4 radiative transfer modeling for atmosphereic correction, Proceedings SPIE Optical Spectroscopic Techniques and Instrumentation for Atmospheric and Space Research III, 3756, 19–21 July, 1999.
Bucini, G and Lambin, E. F.: Fire impacts on vegetation in Central Africa: a remote-sensing-based statistical analysis, Applied Geography, 22, 27–48, 2002.
20
Braatz, B. V., Brown, S., Isichei, A. O., Scholes, R. J., Sokona, Y., drichi, P., Gaston, G., Delmas, R., Holmes, R., Amous, S., Muyungi, R. S., De Jode, A., and Gibbs, M.: African greenhouse gas emission inventories and mitigation options: forestry, land-use change and agriculture, Environ. Monit. Assess., 38, 109–126, 1995.
Cooke, W. F., Koffi, B., and Gregoire, J.-M.: Seasonality of vegetation fires in Africa from
re-25
mote sensing data and application to a global chemistry model, J. Geophys. Res., 101(D15), 21 051–21 065, 1996.
Dennison, P. E., Charoensiri, K., Roberts, D. A., Peterson, S. H., and Green, R. O.: Wild-fire temperature and land cover modeling using hyperspectral data, Remote Sens. Environ., 100(2), 212–222, 2006.
30
BGD
5, 3623–3663, 2008Annual African biomass burning temporal dynamics
G. Roberts et al.
Title Page
Abstract Introduction
Conclusions References
Tables Figures
◭ ◮
◭ ◮
Back Close
Full Screen / Esc
Printer-friendly Version
Interactive Discussion Dwyer, E., Pinnock, S., Gregoire, J.-M., and Pereira, J. M. C.: Global spatial and temporal
distribution of vegetation fires as determined from satellite observations, Int. J. Rem. Sens., 21, 6–7, 1289–1302, 2000.
Edwards, D. P. Emmons, L. K. Gille, J. C., Chu, A., Attie, J-L., Giglio, L., Wood, S. W., Hay-wood, J., Deeter, M. N., Massie, S. T., Ziskin, D. C., and Drummond, J. R.: Satellite-observed
5
pollution from Southern Hemisphere biomass burning, J. Geophys. Res., 111, D14312, doi:10.1029/2005JD006655, 2006.
Feltz, J. M., Moreau, M., Prins, E. M., McClaid-Cook, K., and Brown, I. F.: Recent validation studies of the GOES Wildfire Automated Biomass Burning Algorithm (WF-ABBA) in North and South America. International Wildland Fire Ecology and Fire Management Congress,
10
2nd and Symposium on Fire and Forest Meteorology, 5th, Orlando, FL, 16–20 November 2003, P7.3, 2003
Fensholt, R., Sandholt, I., Rasmussen, M. S., Stisen, S. and Diouf, A.: Evaluation of satellite based primary production modeling in the semi-arid Sahel. Remote Sens. Environ., 105, 173–188, 2006.
15
Freeborn, P. H., Wooster, M. J., Hao, W. M., Ryan, C. A., Nordgren, B. L., Baker, S. P., and Ichoku, C.: Relationships between energy release, fuel mass loss, and trace gas and aerosol emissions during laboratory biomass fires. J. Geophys. Res., 113, D01301, doi:10.1029/2007JD008679, 2008.
Giglio, L., Descloitres, J., Justice, C. O., and Kaufman, Y. J.: An enhanced contextural fire
20
detection algorithm for MODIS, Remote Sens. Environ., 87(2–3), 273–282, 2003.
Giglio, L., van der Werf, G. R., Randerson, J. T., Collatz, C. J., and Kasibhatla, P.: Global estimation of burned area using MODIS active fire Observations, Atmos. Chem. Phys., 6, 957–974, 2006a,
http://www.atmos-chem-phys.net/6/957/2006/.
25
Giglio, L., Csiszar, I., and Justice, C. O.: Global distribution and seasonality of active fires as observed with Terra and Aqua Moderate Resolution Imaging Spectroradiometers (MODIS) sensors, J. Geophys. Res., 111, G02016, doi:10.1029/2005JG000142, 2006b.
Giglio, L.: Characterization of the tropical diurnal fire cycle using VIRS and MODIS observa-tions, Remote Sens. Environ., 108(4), 407–421, 2007.
30
Govaerts, Y. M., J. M. Pereira, J. M., Pinty, B., and Mota, B.: Impact of fires on
BGD
5, 3623–3663, 2008Annual African biomass burning temporal dynamics
G. Roberts et al.
Title Page
Abstract Introduction
Conclusions References
Tables Figures
◭ ◮
◭ ◮
Back Close
Full Screen / Esc
Printer-friendly Version
Interactive Discussion Govender, N., Trollope, W. S. W., and van Wilgen, B. W.: The effect of fire season, fire
fre-quency, rainfall and management on fire intensity in savanna vegetation in South Africa, J. Appl. Ecol., 43, 748–758, 2006.
Hao, W. M., Ward, D, E., Olbu, G., and Baker,, S. P.: Emissions of CO2, CO and hydrocarbons from fires in diverse African savanna ecosystems, J. Geophys. Res., 101, 23 577–23 584,
5
1996.
Hoffa, E. A., Ward, D. E., Hao, W. M., Susott, R. A., and Wakimoto, R. H.: Seasonality of carbon emissions from biomass burning in a Zambian savanna, J. Geophys. Res., 104, 13 841–13 853, 1999.
Holben, B. N., Setzer, A, Eck, T. F., Pereira, A., and Slutsker, I.: Effect of dry-season biomass
10
burning on Amazon basin aerosol concentrations and optical properties, 1992–1994, J. Geo-phys. Res., 101, 19 465–19 482, 1996.
Houghton, J. T., Ding, Y., Griggs, D. J., Nouger, M., van der Linden, P. J. and Xiaosu, D. (eds.): Contribution of Working Group I to the Third Assessment Report of the Intergovernmental Panel on Climate Change (IPCC), Cambridge University Press, UK, pp. 944, 2001.
15
Hyer, E. J., Kasischke, E. S., and Allen, D. J.: Effects of source temporal resolu-tion on transport simularesolu-tions of boreal fire emissions, J. Geophys. Res., 112, D01302, doi:10.1029/2006JD007234, 2007.
Ichoku, C., Kaufman, Y. J., Giglio, L., Li, Z., Fraser, R. H., Jin, J.-Z., and Park, W. M.: Compara-tive analysis of daytime fire detection algorithms using AVHRR data for the 1995 fire season
20
in Canada: perspective for MODIS, Int. J. Rem. Sens., 24(8), 1669–1690, 2003.
Ito, A. and Penner, J. E.: Global estimates of biomass burning emissions based on satellite imagery for the year 2000, J. Geophys. Res., 109, D19306, doi:10.1029/2003/D004423, 2004.
Jost, C., Trentmann, J., Sprung, D., Andreae, M. O., McQuaid, J. B., and Barjat, H.: Trace
25
gas chemistry in a young biomass burning plume over Namibia: Observations and model simulations, J. Geophys. Res., 108, 8482, doi:10.1029/2002JD002431, 2003.
Justice, C. O., Kendall, J. D., Dowty, P. R., and Scholes, R. J.: Satellite remote sensing of fires during the SAFARI campaign using NOAA advanced very high resolution radiometer data, J. Geophys. Res., 101, 23 851–23 863, 1996.
30
BGD
5, 3623–3663, 2008Annual African biomass burning temporal dynamics
G. Roberts et al.
Title Page
Abstract Introduction
Conclusions References
Tables Figures
◭ ◮
◭ ◮
Back Close
Full Screen / Esc
Printer-friendly Version
Interactive Discussion doi:10.1029/2004GB002300, 2005.
Korontzi, S.: Seasonal patterns of biomass burning emissions from southern Africa vegetation fires for the year 2000, Global Change Biology, 11, 1–21, 2005.
Korontzi, S., Roy, D. P., Justice, C. O., and Ward, D. E.: Modeling and sensitivity analysis of fire emissions in southern Africa during SAFARI 2000, Remote Sens. Environ., 92, 376–396,
5
2004.
Langaas, S.: A critical review of sub-resolution fire detection techniques and principles using thermal satellite data, PhD Thesis, Department of Geography, University of Oslo, Norway, 1995.
Lehsten, V., Tansey, K. J., Balzter, H., Thonicke, K., Spessa, A., Weber, U., Smith, B. and
10
Arneth, A.: Estimating carbon emissions from African wildfires, Biogeosciences Discuss., 5, 3091–3122, 2008,
http://www.biogeosciences-discuss.net/5/3091/2008/.
Lentile, L. B., Holden, Z. A., Smith, A. M. S., Falkowski, M. J., Hudak, A. T., Morgan, P., Lewis, S. A., Gessler, P. E., and Benson, N. C.: Remote sensing techniques to assess active fire
15
and post-fire effects, Int. J. Wildland Fire, 15, 319–345, 2006.
Liu, J., Drummond, J. R., Li, Q., Gille, J. C., and Ziskin, D. C.: Satellite mapping of CO emis-sion from forest fires in Northwest America using MOPITT measurements, Remote Sens. Environ., 95, 502–516, 2005.
Liousse, C., Andreae, M. O., Artaxo, P., Barbosa, H., M. O. Andreae, P. Artaxo , P. Barbosa, P.,
20
Cachier, H., Gr ´egoire, J. M., Hobbs, P., Lavou ´e, F., Mouillot, F., Penner, J., Scholes, M., and Schultz, M. J.: Deriving global quantitative estimates for spatial and temporal distributions of biomass burning emissions, In: Emissions of Atmospheric Trace Compounds, Edited by: Granier, C., Artaxo, P., and Reeves, C. E., Kluwer Academic Press, 560 pp., 1996.
Los, S. O., Colltz, G. J., Sellers, P. J., Malmstrom, C. M., Pollack, N. H., DeFries, R. S., Bounoua,
25
L., Parris, M. T., Tucker, C. J., and Dazlich, D., A.: A global 9-year biophysical land surface dataset from NOAA AVHRR data, J. Hydrometeor., 1, 183–199, 2000.
Lutz, H.-J., Gustafsson, J. B., and Valenzuela-Leyenda, R.: Scenes and cloud analysis from Meteosat Second Generation (MSG), Proceedings of the 2003 EUMETSAT Meteorological Satellite Conference, Weimar, Germany, EUMETSAT, EUM P, 39, 311–318, 2003.
30
Mayaux, P., Bartholom ´e, E., Fritz, S., and Belward, A.: A new land-cover map of Africa for the year 2000, J. Biogeography, 31, 861–877, 2004.
BGD
5, 3623–3663, 2008Annual African biomass burning temporal dynamics
G. Roberts et al.
Title Page
Abstract Introduction
Conclusions References
Tables Figures
◭ ◮
◭ ◮
Back Close
Full Screen / Esc
Printer-friendly Version
Interactive Discussion product over Southern Africa with ASTER data, Int. J. Rem. Sens., 26, 4239–4264, 2005.
Moula, M., Brustet, J. M., and Fontan, J.: Remote sensing-modelisation approach for diurnal estimation of burnt biomass in the Central African Republic savanna, J. Atmos. Chem., 25, 1-19, 1996.
Myneni, R. B. and Williams, D. L.: On the relationship between FAPAR and NDVI, Remote
5
Sens. Environ., 49, 200–211, 1994.
Pack, D. W., Rice, C. J., Tressel, B. J., Lee-Wagner, C. J., and Oshika, E. W.: Civilian uses of surveillance satellites, Crosslink, The Aerospace Corporation, 2–9, 2000.
P ´etron, G., Granier, C., Khattatov, B., Yudin, V., Lamarque, J.-F., Emmons, L., Gille, J., and Edwards, D. P.: Monthly CO surface sources inventory based on the 2000–2001 MOPITT
10
satellite data, J. Geophys. Res. Lett., 31, L21107, doi:10.1029/2004GL020560, 2004. Plummer, S., Arino, O., Ranera, F., Tansey, K., Chen, J., Dedieu, G., Eva, H., Piccolini, I., Leigh,
R., Borstlap, G., Beusen, B., Heyns, W., and Benedetti, R.: The GLOBCARBON Initiative: Global Biophysical Products for Terrestrial Carbon Studies, IEEE International Geoscience and Remote Sensing Symposium, Barcelona, Spain, 23–27 July, 2007.
15
Potter, C. S., Randerson, J. T., Field, C. B., Matson, P. A., Vitousek, P. M., Mooney, H. A., and Klooster, S. A.: Terrestrial ecosystem production: A process model based on global satellite and surface data, Global Biogeoch. Cy., 7, 811–841, 1993.
Prins, E. M. and Menzel, W. P.: Geostaionary satellite detection of biomass burning in South America, Int. J. Rem. Sens., 13, 2783–2799, 1992.
20
Prins, E. M. and Menzel, W. P.: Trends in South American biomass burning with the GOES visible infrared spin scan radiometer atmospheric sounder from 1983 to 1991, J. Geophys. Res., 99, 16 719–16 735, 1994.
Prins, E. M., Felts, J. M., Menzel, W. P., and Ward, D. E.: An overview of GOES-8 diurnal fire and smoke results for SCAR-B and 1995 fire season in South America, J. Geophys. Res.,
25
103, 31 821–31 835, 1998.
Reid, J. S., Prins, E. M., Westphal, D. L., Schmidt, C. C., Richardson, K. A., Christopher, S. A., Eck, T. F., Reid, E. A., Curtis, C. A., and Hoffman, J. P.: Real-time monitoring of South Amer-ican smoke particle emissions and transport using a coupled remote sensing/box-model approach, Geophys. Res. Lett., 31, L06107, doi:10.1029/2003GL018845, 2004.
30
BGD
5, 3623–3663, 2008Annual African biomass burning temporal dynamics
G. Roberts et al.
Title Page
Abstract Introduction
Conclusions References
Tables Figures
◭ ◮
◭ ◮
Back Close
Full Screen / Esc
Printer-friendly Version
Interactive Discussion doi:10.1029/2005JD006018, 2005.
Roberts, G. and Wooster, M., J.: Fire Detection and Fire Characterization over Africa using Meteosat SEVIRI, IEEE Transactions on Geoscience and Remote Sensing, 48(4), 1200– 1219, 2008.
Roy, D. P., Lewis, P. E., and Justice, C. O.: Burned area mapping using multi-temporal
moder-5
ate spatial resolution data – A bi-directional reflectance model-based expectation approach, Remote Sens. Environ., 83, 263–286, 2002.
S ´a, A. C. L., Pereira, J. M. C., and Silva, J. M. N.: Estimation of combustion completeness based on fire-induced spectral reflectance changes in a dambo grassland (Western Province, Zambia), Int. J. Rem. Sens., 26, 4185–4195, 2005.
10
Scholes, R. J., Kendal, J., and Justice, C. O.: The quantity of biomass burned in southern Africa, J. Geophys. Res., 101(19), 23 667–23 676, 1996.
Seiler, W. and Crutzen, P. J.: Estimates of gross and net fluxes of carbon between the biosphere and the atmosphere from biomass burning, Clim. Change, 2, 207–247, 1980.
Shea, R. W., Shea, B. W., Kauffman, J. B., Ward, D. E., Haskins, C. I., and Scholes, M. C.:
15
Fuel biomass and combustion factors associated with fires in savanna ecosystems of South Africa and Zambia, J. Geophys. Res., 101, 23 551–23 569, 1996.
Smith, A. M. S., Drake, N., Wooster, M. J., Hudak, A., and Holden, Z. A.: Production of Landsat ETM reference imagery of burned areas within Southern African savannahs: comparison of methods and application to MODIS, Int. J. Rem. Sens., 28, 2753–2775, 2007.
20
Tansey, K., Gr ´egoire, J.-M., Stroppiana, D., Sousa, A., Silva, J. M. N., Pereira, J. M. C., Boschetti, L., Maggi, M., Brivio, P. A., Fraser, R., Flasse, S., Ershov, D., Binaghi, E., Graetz, D. and Peduzzi, P.: Vegetation burning in the year 2000: Global burned area estimates from SPOT VEGETATION data, J. Geophys. Res., 109, D14S03, doi:10.1029/2003JD003598, 2004.
25
Trentmann, J., Andreae, M. O., Graf, H.-F., Hobbs, P. V., Ottmar, R. D., and Trautmann, T.: Simulation of a biomass-burning plume: Comparison of model results with observations, J. Geophys. Res., 107, 4013, doi:10.1029/2001JD000410, 2002.
Van der Werf, G. R., Randerson Collatz, G. J., and Giglio, L.: Carbon emission from fires in tropical and subtropical ecosystems, Glob. Change Biol., 9, 547–562, 2003.
30
BGD
5, 3623–3663, 2008Annual African biomass burning temporal dynamics
G. Roberts et al.
Title Page
Abstract Introduction
Conclusions References
Tables Figures
◭ ◮
◭ ◮
Back Close
Full Screen / Esc
Printer-friendly Version
Interactive Discussion http://www.atmos-chem-phys.net/6/3423/2006/.
Ward, D. E., Hao, W. M., Susott, R. A., Babbitt, R. E., Shea, R. W., Kauffman, J. B., and Justice, C. O.: Effect of fuel composition on combustion efficiency and emission factors for African savanna ecosystems, J. Geophys. Res., 101, 23 569–23 577, 1996.
Williams, C. A., Hanan, N. P., Neff, J. C., Scholes, R. J., Berry, J. A., Denning, A. S., and
5
Baker, D. A.: Africa and the global carbon cycle, Carbon Balance and Management, 2(3), doi:10.1186/1750=0680-2-3, 2007.
Wittenberg, U., Heimann, M., Esser, G., McGuire, A. and Sauf, W.: On the influence of biomass burning on the seasonal CO2 signal as observed at monitoring stations, Global Biogeoch. Cy., 12, 531–544, 1998.
10
Wooster, M. J., Zhukov, B., and Oertel, D.: Fire radiative energy for quantitative study of biomass burning: derivation from the BIRD experimental satellite and comparison to MODIS fire products, Remote Sens. Environ., 86, 83–107, 2003.
Wooster, M. J., Roberts, G., Perry, G. L. W., and Kaufman, Y. J.: Retrieval of biomass combus-tion rates and totals from fire radiative power observacombus-tions: FRP derivacombus-tion and calibracombus-tion
15
relationships between biomass consumption and fire radiative energy release, J. Geophys. Res., 110, D24311, doi:10.1029/2005JD006318, 2005.
Yevich, R. and Logan, J. A.: An assessment of biofuel use and burning of agricultural waste in the developing world, Global Biogeoch. Cy., 17, 1095, doi:10.1029/2002GB001952, 2002. Zhang, Y. H., Wooster, M. J., Tutubalina, O., and Perry, G. L. W.: Monthly burned area and
20
BGD
5, 3623–3663, 2008Annual African biomass burning temporal dynamics
G. Roberts et al.
Title Page
Abstract Introduction
Conclusions References
Tables Figures
◭ ◮
◭ ◮
Back Close
Full Screen / Esc
Printer-friendly Version
Interactive Discussion
BGD
5, 3623–3663, 2008Annual African biomass burning temporal dynamics
G. Roberts et al.
Title Page
Abstract Introduction
Conclusions References
Tables Figures
◭ ◮
◭ ◮
Back Close
Full Screen / Esc
Printer-friendly Version
Interactive Discussion
BGD
5, 3623–3663, 2008Annual African biomass burning temporal dynamics
G. Roberts et al.
Title Page
Abstract Introduction
Conclusions References
Tables Figures
◭ ◮
◭ ◮
Back Close
Full Screen / Esc
Printer-friendly Version
Interactive Discussion (a)
(b)
BGD
5, 3623–3663, 2008Annual African biomass burning temporal dynamics
G. Roberts et al.
Title Page
Abstract Introduction
Conclusions References
Tables Figures
◭ ◮
◭ ◮
Back Close
Full Screen / Esc
Printer-friendly Version
Interactive Discussion
(a) (b)
(c) (d)
BGD
5, 3623–3663, 2008Annual African biomass burning temporal dynamics
G. Roberts et al.
Title Page
Abstract Introduction
Conclusions References
Tables Figures
◭ ◮
◭ ◮
Back Close
Full Screen / Esc
Printer-friendly Version
Interactive Discussion
(a) (b)
(c)
BGD
5, 3623–3663, 2008Annual African biomass burning temporal dynamics
G. Roberts et al.
Title Page
Abstract Introduction
Conclusions References
Tables Figures
◭ ◮
◭ ◮
Back Close
Full Screen / Esc
Printer-friendly Version
Interactive Discussion
BGD
5, 3623–3663, 2008Annual African biomass burning temporal dynamics
G. Roberts et al.
Title Page
Abstract Introduction
Conclusions References
Tables Figures
◭ ◮
◭ ◮
Back Close
Full Screen / Esc
Printer-friendly Version
Interactive Discussion
(a) (b)
(c) (d)
Fig. 7. Comparisons between atmospheric carbon monoxide concentrations and SEVIRI-derived biomass burning measures over southern (aandb) and Northern Hemisphere (cand
d) Africa. CO concentrations were calculated from daytime 1◦
BGD
5, 3623–3663, 2008Annual African biomass burning temporal dynamics
G. Roberts et al.
Title Page
Abstract Introduction
Conclusions References
Tables Figures
◭ ◮
◭ ◮
Back Close
Full Screen / Esc
Printer-friendly Version
Interactive Discussion
Fig. 8. 15 min FRP time series for a single fire that burned on 6 and 7 August 2004 in an area of northern Botswana (26.12◦E, 18.28◦S) classified as sparse grassland, calculated from the
BGD
5, 3623–3663, 2008Annual African biomass burning temporal dynamics
G. Roberts et al.
Title Page
Abstract Introduction
Conclusions References
Tables Figures
◭ ◮
◭ ◮
Back Close
Full Screen / Esc
Printer-friendly Version
Interactive Discussion
BGD
5, 3623–3663, 2008Annual African biomass burning temporal dynamics
G. Roberts et al.
Title Page
Abstract Introduction
Conclusions References
Tables Figures
◭ ◮
◭ ◮
Back Close
Full Screen / Esc
Printer-friendly Version
Interactive Discussion
BGD
5, 3623–3663, 2008Annual African biomass burning temporal dynamics
G. Roberts et al.
Title Page
Abstract Introduction
Conclusions References
Tables Figures
◭ ◮
◭ ◮
Back Close
Full Screen / Esc
Printer-friendly Version
Interactive Discussion
BGD
5, 3623–3663, 2008Annual African biomass burning temporal dynamics
G. Roberts et al.
Title Page
Abstract Introduction
Conclusions References
Tables Figures
◭ ◮
◭ ◮
Back Close
Full Screen / Esc
Printer-friendly Version
Interactive Discussion
BGD
5, 3623–3663, 2008Annual African biomass burning temporal dynamics
G. Roberts et al.
Title Page
Abstract Introduction
Conclusions References
Tables Figures
◭ ◮
◭ ◮
Back Close
Full Screen / Esc
Printer-friendly Version
Interactive Discussion (a)
(b)
BGD
5, 3623–3663, 2008Annual African biomass burning temporal dynamics
G. Roberts et al.
Title Page
Abstract Introduction
Conclusions References
Tables Figures
◭ ◮
◭ ◮
Back Close
Full Screen / Esc
Printer-friendly Version
Interactive Discussion